. 2024 Feb;80(2):268-281.
doi: 10.1016/j.jhep.2023.10.035. Epub 2023 Nov 7.

Inhibition of the renal apical sodium dependent bile acid transporter prevents cholemic nephropathy in mice with obstructive cholestasis

Affiliations

Inhibition of the renal apical sodium dependent bile acid transporter prevents cholemic nephropathy in mice with obstructive cholestasis

Ahmed Ghallab et al. J Hepatol. 2024 Feb.

Erratum in

  • Erratum to: 'Inhibition of the renal apical sodium dependent bile acid transporter prevents cholemic nephropathy in mice with obstructive cholestasis' [J Hepatol (2024) 80:268-281].
    Ghallab A, González D, Strängberg E, Hofmann U, Myllys M, Hassan R, Hobloss Z, Brackhagen L, Begher-Tibbe B, Duda JC, Drenda C, Kappenberg F, Reinders J, Friebel A, Vucur M, Turajski M, Seddek AL, Abbas T, Abdelmageed N, Morad SAF, Morad W, Hamdy A, Albrecht W, Kittana N, Assali M, Vartak N, van Thriel C, Sous A, Nell P, Villar-Fernandez M, Cadenas C, Genc E, Marchan R, Luedde T, Åkerblad P, Mattsson J, Marschall HU, Hoehme S, Stirnimann G, Schwab M, Boor P, Amann K, Schmitz J, Bräsen JH, Rahnenführer J, Edlund K, Karpen SJ, Simbrunner B, Reiberger T, Mandorfer M, Trauner M, Dawson PA, Lindström E, Hengstler JG. Ghallab A, et al. J Hepatol. 2025 Jun;82(6):1140. doi: 10.1016/j.jhep.2025.02.031. Epub 2025 Mar 15. J Hepatol. 2025. PMID: 40090770 Free PMC article. No abstract available.

Abstract

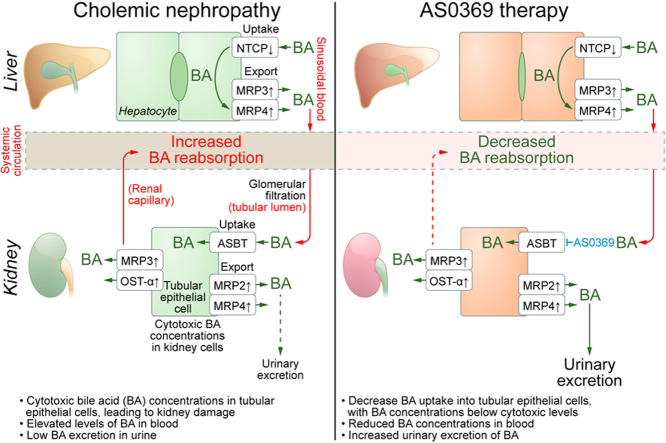
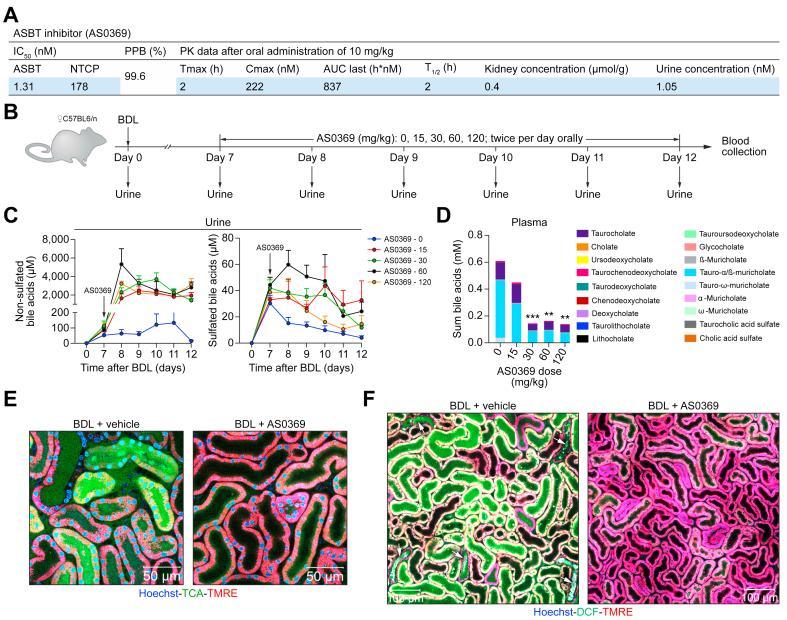
Background & aims: Cholemic nephropathy (CN) is a severe complication of cholestatic liver diseases for which there is no specific treatment. We revisited its pathophysiology with the aim of identifying novel therapeutic strategies.

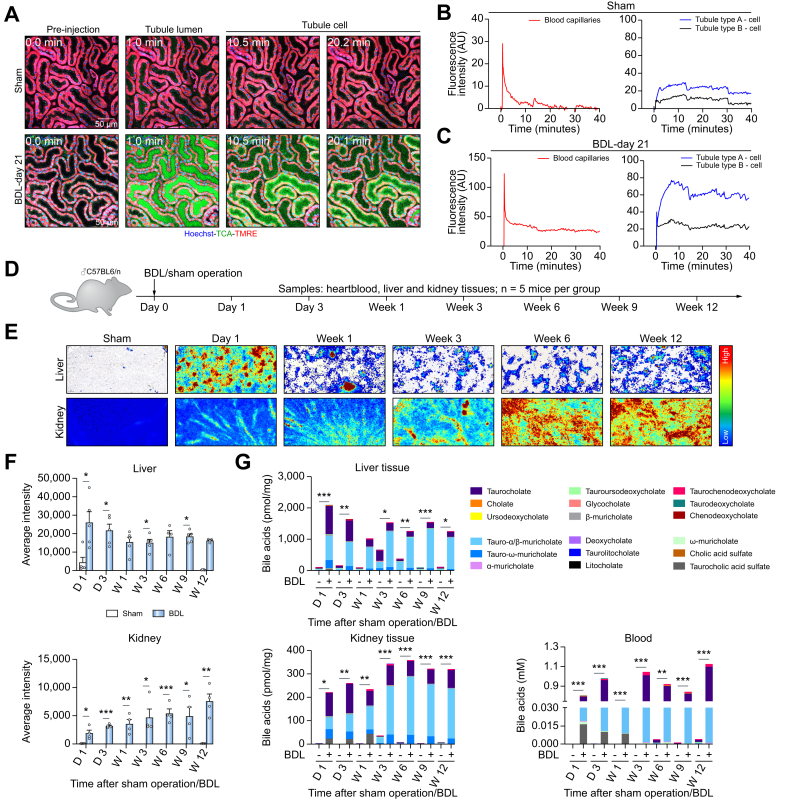
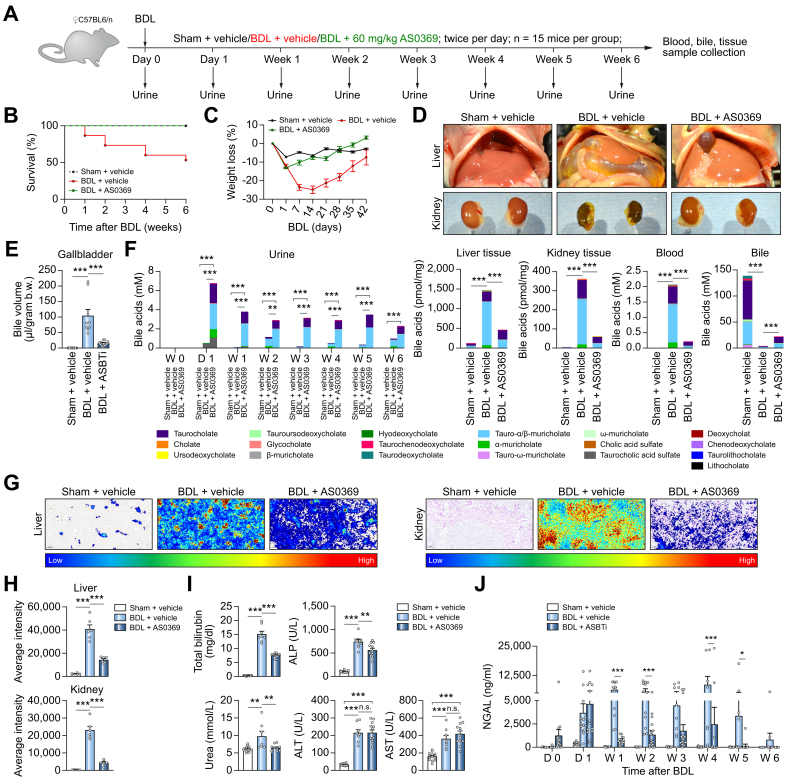
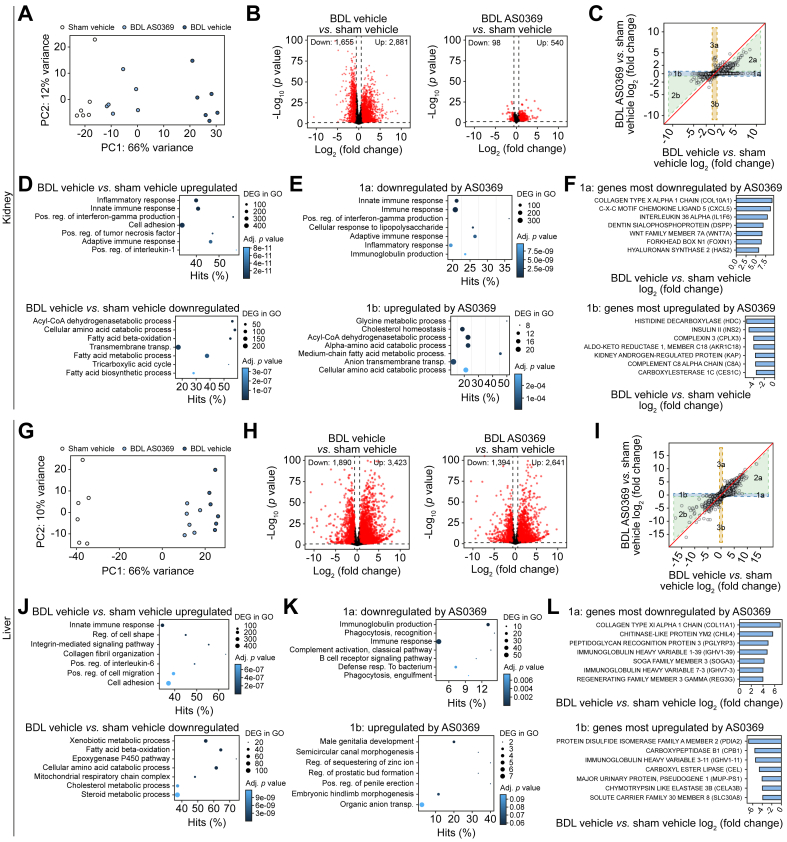
Methods: Cholestasis was induced by bile duct ligation (BDL) in mice. Bile flux in kidneys and livers was visualized by intravital imaging, supported by MALDI mass spectrometry imaging and liquid chromatography-tandem mass spectrometry. The effect of AS0369, a systemically bioavailable apical sodium-dependent bile acid transporter (ASBT) inhibitor, was evaluated by intravital imaging, RNA-sequencing, histological, blood, and urine analyses. Translational relevance was assessed in kidney biopsies from patients with CN, mice with a humanized bile acid (BA) spectrum, and via analysis of serum BAs and KIM-1 (kidney injury molecule 1) in patients with liver disease and hyperbilirubinemia.

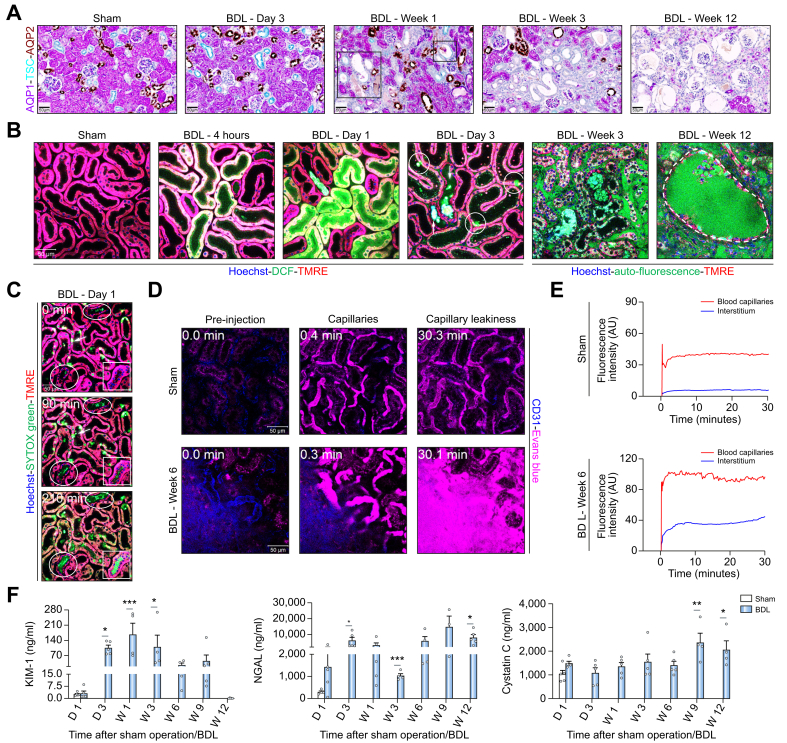
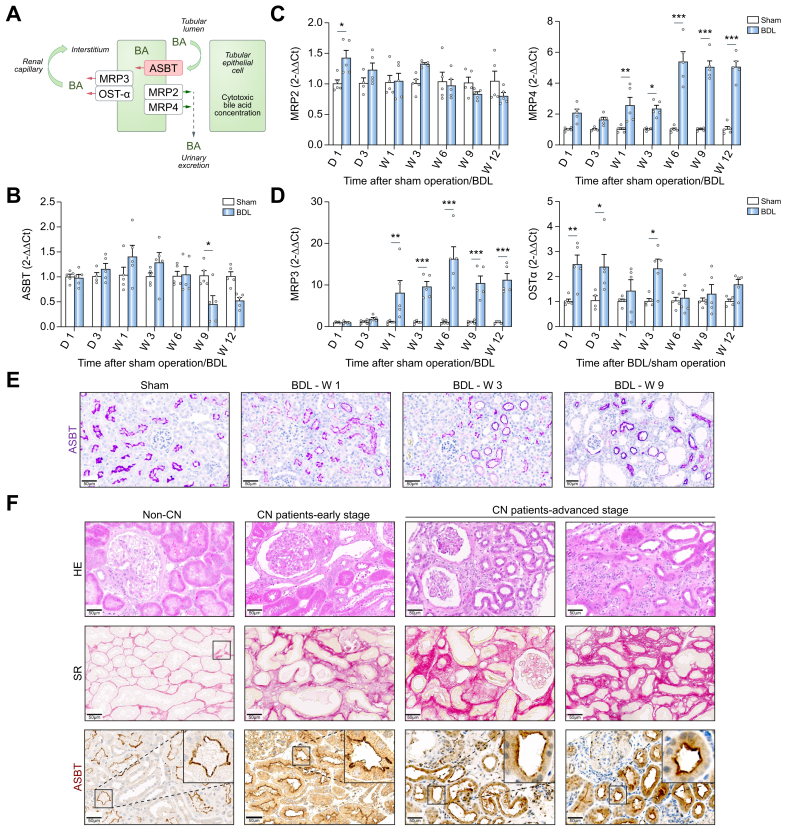
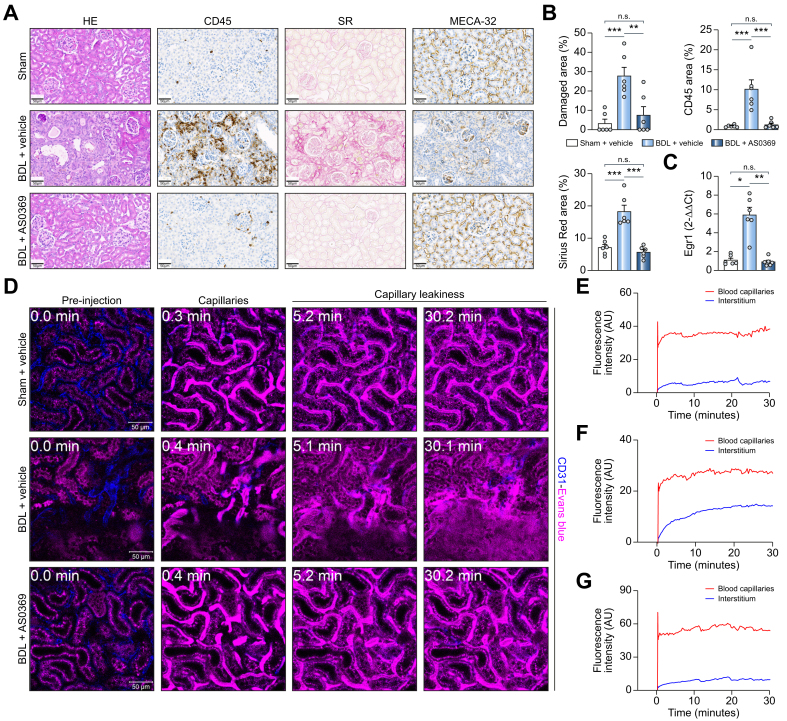
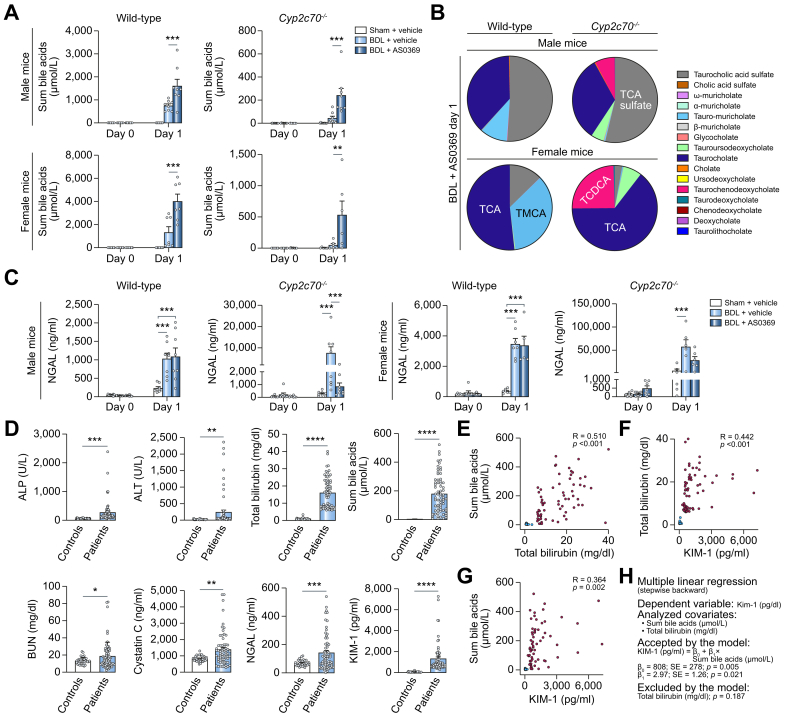
Results: Proximal tubular epithelial cells (TECs) reabsorbed and enriched BAs, leading to oxidative stress and death of proximal TECs, casts in distal tubules and collecting ducts, peritubular capillary leakiness, and glomerular cysts. Renal ASBT inhibition by AS0369 blocked BA uptake into TECs and prevented kidney injury up to 6 weeks after BDL. Similar results were obtained in mice with humanized BA composition. In patients with advanced liver disease, serum BAs were the main determinant of KIM-1 levels. ASBT expression in TECs was preserved in biopsies from patients with CN, further highlighting the translational potential of targeting ASBT to treat CN.

Conclusions: BA enrichment in proximal TECs followed by oxidative stress and cell death is a key early event in CN. Inhibiting renal ASBT and consequently BA enrichment in TECs prevents CN and systemically decreases BA concentrations.

Impact and implications: Cholemic nephropathy (CN) is a severe complication of cholestasis and an unmet clinical need. We demonstrate that CN is triggered by the renal accumulation of bile acids (BAs) that are considerably increased in the systemic blood. Specifically, the proximal tubular epithelial cells of the kidney take up BAs via the apical sodium-dependent bile acid transporter (ASBT). We developed a therapeutic compound that blocks ASBT in the kidneys, prevents BA overload in tubular epithelial cells, and almost completely abolished all disease hallmarks in a CN mouse model. Renal ASBT inhibition represents a potential therapeutic strategy for patients with CN.

Keywords: Cholestasis; bile cast nephropathy; bile duct ligation; intravital imaging; kidney injury.


Figures

None
Graphical abstract
Fig. 1
Fig. 1
Enhanced uptake of bile acids into renal tubular epithelial cells in obstructive cholestasis. (A-C) Stills from intravital videos of sham controls and mice 21 days after BDL, and corresponding quantifications. Red: TMRE; green: TCA; blue: Hoechst. Scale bars: 50 μm (Video S2). (D) Experimental schedule. (E,F). MALDI-MSI analysis of mouse livers and kidneys at different time intervals after BDL, and corresponding quantifications. (G) LC-MS/MS analysis of BAs in liver and kidney tissues and in blood; data are presented as mean± SEM; n = 5 mice per group. ∗p <0.05; ∗∗p <0.01; ∗∗∗p <0.001 compared to sham day 1, Unpaired t test. The data are from male mice. BDL, bile duct ligation; TCA, taurocholic acid; TMRE, tetramethylrhodamine ethyl ester. (This figure appears in color on the web.)
Fig. 2
Fig. 2
Key events of CN. (A) Co-immunostaining of the proximal TEC marker AQP1, distal TEC marker TSC and the collecting duct marker AQP2 at various time periods after BDL. (B) Intravital imaging demonstrating oxidative stress of proximal TECs 4 h and 1 day after BDL based on the marker DCF. Dead proximal TECs (circles) and debris attached in distal tubules (arrows) on day 3 after BDL. Auto-fluorescence in (white arrows) and around peritubular capillaries at week 3 post BDL. Week 12 after BDL shows glomerular cysts (marked area). (C) Intravital imaging of dead proximal TECs based on the cytotoxicity marker SYTOX Green (arrowhead) at day 1 after BDL and formation of casts in a collecting duct (square) and distal tubules (circles) (Video S3A). (D) Leakiness of peritubular capillaries 6 weeks after BDL. Intravital imaging was performed after tail vein injection of Evans blue (magenta). Peritubular capillaries are visualized by anti-CD31 antibody (blue); scale bars: 50 μm. (E) Quantification of Evans blue signal in the peritubular capillaries and in the interstitium corresponding to Video S4. (F) Time course of kidney injury biomarkers in urine; data are presented as mean ± SEM; n = 5 mice per group. ∗p <0.05; ∗∗p <0.01; ∗∗∗p <0.001 compared to the corresponding sham controls; Tukey's multiple comparisons test. The data are from male mice. BDL, bile duct ligation; D, day; DCF, dichlorofluorescein; TKIM1, kidney injury molecule; MRE, tetramethylrhodamine ethyl ester; NGAL, neutrophil gelatinase-associated lipocalin; W, week. (This figure appears in color on the web.)
Fig. 3
Fig. 3
Preserved ASBT expression in renal tissue of mice and patients with CN. (A) Schedule of BA transport in TECs. (B-D) RNA levels of BA transporters in renal tissue of mice at various periods after BDL compared to sham-operated mice; data are presented as mean ± SEM; n = 5 mice per group; ∗p <0.05; ∗∗p <0.01; ∗∗∗p <0.001 compared to the corresponding controls; Tukey's multiple comparisons test. (E) Immunostaining of ASBT in renal tissue of mice after BDL. The data are from male mice. (F) ASBT expression in renal biopsies of patients with CN at early and advanced stages. Fibrosis was visualized by Sirius red (SR). Scale bars: 50 μm. ASBT, apical sodium-dependent bile acid transporter; CN, cholemic nephropathy; HE, haematoxylin and eosin; Mrp2/3/4, multidrug resistance-associated protein 2/3/4; Ostα, organic solute transporter alpha; SR, sirius red. (This figure appears in color on the web.)
Fig. 4
Fig. 4
Development of a systemic ASBT-specific inhibitor. (A) Inhibitory concentrations and pharmacokinetic data for AS0369. (B) Experimental schedule. (C, D) Concentrations of non-sulfated and sulfated BAs in urine and plasma after ASBT inhibition; data are presented as mean ± SEM; n = 3-6 mice per group; ∗∗p <0.01; ∗∗∗p <0.001 compared to the controls (0); Tukey's multiple comparisons test. (E) ASBT inhibition reduces TCA uptake into TECs. Intravital imaging was performed 3 days after BDL and AS0369 treatment (60 mg/kg, twice per day). Imaging was performed approximately 2 h after administration of the last AS0369 dose; scale bars: 50 μm. (F) Overview of renal tissue in mice on day 2 after BDL showing reduced oxidative stress and tubule casts after AS0369 treatment compared to vehicle treated mice; scale bars: 100 μm. The data in panels (E) and (F) are from male mice. ASBT, apical sodium-dependent bile acid transporter; BDL, bile duct ligation; DCF, dichlorofluorescein; NTCP, sodium-taurocholate co-transporting polypeptide; PPB, plasma protein binding; PK, pharmacokinetic; TCA, taurocholic acid; TMRE, tetramethylrhodamine ethyl ester. (This figure appears in color on the web.)
Fig. 5
Fig. 5
Efficient prevention of CN by inhibition of renal ASBT. (A) Experimental schedule. (B, C) Survival analysis and body weight changes. (D) Gross pathology of mouse livers and kidneys. (E) Gallbladder bile volume. (F) BA concentrations in urine, liver, and kidney tissues, blood, and bile. ∗∗∗p <0.001, Tukey's multiple comparisons test. (G, H) MALDI-MSI analysis of taurocholic acid in liver and kidney tissues, and corresponding quantifications. (I, J) Blood (total bilirubin, alkaline phosphatase, urea, ALT, AST) and urine (NGAL) biomarkers of liver and kidney damage. ∗p <0.05, ∗∗∗p <0.001, Tukey's multiple comparisons test. Data are presented as mean ± SEM. The data are from female mice. ALP, alkaline phosphatase; ALT, alanine transaminase; AST, aspartate transaminase; BDL, bile duct ligation; NGAL, neutrophil gelatinase-associated lipocalin. (This figure appears in color on the web.)
Fig. 6
Fig. 6
Prevention of peritubular capillary leakiness by ASBT inhibition. (A,B) Histopathology and immunostaining of leukocyte (CD45), and endothelial cells (MECA-32) in the three treatment groups illustrated in Fig 5A, and corresponding quantifications; scale bars: 50 μm. (C) RNA levels of Egr1 in renal tissue; ∗p <0.05, ∗∗p <0.01, ∗∗∗p <0.001; Tukey's multiple comparisons test. Data are presented as mean ± SEM. (D-G) Intravital imaging after tail vein injection of Evans blue (magenta) and the corresponding quantifications in the peritubular capillaries and the interstitium (Videos S5A-C). The peritubular capillaries are visualized by anti-CD31 antibody (blue); scale bars: 50 μm. The data are from female mice. BDL, dile duct ligation; CD45, cluster of differentiation 45, Egr1, early growth response protein-1; HE, haematoxylin and eosin; MECA-32, mouse endothelial cell antigen-32; SR, sirius red. (This figure appears in color on the web.)
Fig. 7
Fig. 7
RNA-seq analysis of BDL mice confirms the protective effect of ASBT inhibition in the kidney and liver. (A) PCA plots of sham vehicle mice, BDL mice treated with the vehicle, and BDL mice treated with AS0369. Each dot represents an individual mouse. (B) Volcano plots illustrating differential genes between vehicle-treated (left panel) and AS0369-treated (right panel) mice with BDL and controls (sham vehicle). (C) DiPa plots illustrating the response to AS0369. Each dot represents an individual gene. (D, E) Plots of overrepresented GO groups in the indicated differential gene sets. The size of the dots represents the number of genes in the individual GO groups and the color code the adjusted (adj) p value. (F) Genes most influenced by AS0369 in groups 1a and 1b of the DiPa plot. (G-L) correspond to A-F but were performed with liver tissue. The data are from female mice. BDL, bile duct ligation; PCA, Principal component analysis. (This figure appears in color on the web.)
Fig. 8
Fig. 8
Translational relevance. (A-C) Analysis of mice with humanized BA spectrum; Cyp2c70-/-. (A) Urine BAs in mice after sham surgery, BDL and vehicle administration, and BDL plus 60 mg/kg AS0369 twice, on day 1. (B) Individual BAs in wild-type and Cyp2c70-/- mice. (C) Urine NGAL in male and female wild-type and Cyp2c70-/- mice. ∗∗p <0.01, ∗∗∗p <0.001; Tukey's multiple comparisons test. (D-H) Analysis of patients with acute and/or chronic liver disease and hyperbilirubinemia. (D) Liver enzymes, bilirubin, BA and kidney injury markers in serum of patients and in healthy volunteers (controls). ∗p <0.05, ∗∗p <0.01, ∗∗∗p <0.001, ∗∗∗∗p <0.0001; Unpaired t-test. (E-G) Spearman´s correlation of BA, bilirubin, and KIM-1 in serum of patients (red circles) and heathy volunteers (blue circles); R: correlation coefficient; P: Spearman’s p value. (H) Multiple linear regression analysis with serum KIM-1 as a dependent variable. ALP, alkaline phosphatase; ALT, alanine transaminase; BDL, bile duct ligation; BUN, blood urea nitrogen; KIM1, kidney injury molecule; NGAL, neutrophil gelatinase-associated lipocalin. (This figure appears in color on the web.)

Comment in

References

    1. EASL. EASL Clinical Practice Guidelines for the management of patients with decompensated cirrhosis. J Hepatol. 2018;69:406–460. - PubMed
    1. Krones E., Pollheimer M.J., Rosenkranz A.R., et al. Cholemic nephropathy - historical notes and novel perspectives. Biochim Biophys Acta Mol Basis Dis. 2018;1864:1356–1366. - PubMed
    1. Somagutta M.R., Jain M.S., Pormento M.K.L., et al. Bile cast nephropathy: a comprehensive review. Cureus. 2022;14 - PMC - PubMed
    1. Mandorfer M., Aigner E., Cejna M., et al. Austrian consensus on the diagnosis and management of portal hypertension in advanced chronic liver disease (Billroth IV) Wien Klin Wochenschr. 2023;135:493–523. - PMC - PubMed
    1. Simbrunner B., Trauner M., Reiberger T., et al. Recent advances in the understanding and management of hepatorenal syndrome. Fac Rev. 2021;10:48. - PMC - PubMed

Publication types