. 2023 Nov 8;14(1):7216.
doi: 10.1038/s41467-023-42421-0.

Single cell spatial analysis reveals inflammatory foci of immature neutrophil and CD8 T cells in COVID-19 lungs

Affiliations

Single cell spatial analysis reveals inflammatory foci of immature neutrophil and CD8 T cells in COVID-19 lungs

Praveen Weeratunga et al. Nat Commun. .

Abstract

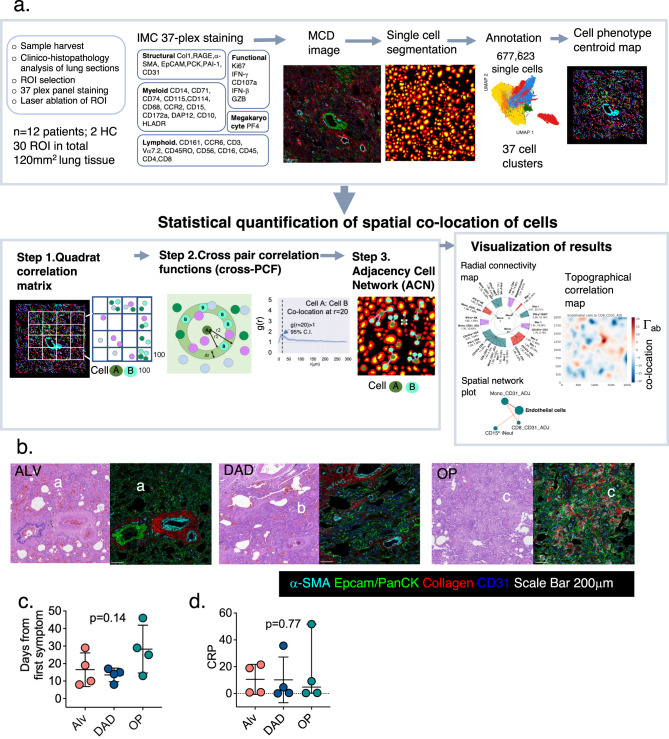
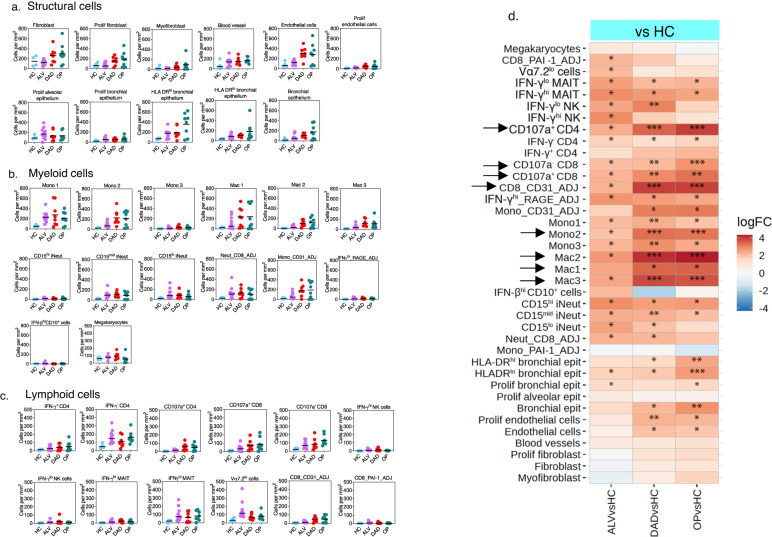
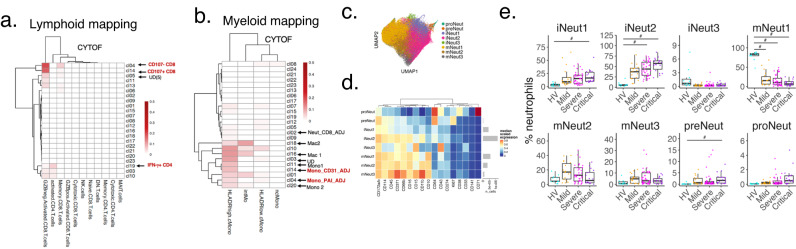
Single cell spatial interrogation of the immune-structural interactions in COVID -19 lungs is challenging, mainly because of the marked cellular infiltrate and architecturally distorted microstructure. To address this, we develop a suite of mathematical tools to search for statistically significant co-locations amongst immune and structural cells identified using 37-plex imaging mass cytometry. This unbiased method reveals a cellular map interleaved with an inflammatory network of immature neutrophils, cytotoxic CD8 T cells, megakaryocytes and monocytes co-located with regenerating alveolar progenitors and endothelium. Of note, a highly active cluster of immature neutrophils and CD8 T cells, is found spatially linked with alveolar progenitor cells, and temporally with the diffuse alveolar damage stage. These findings offer further insights into how immune cells interact in the lungs of severe COVID-19 disease. We provide our pipeline [Spatial Omics Oxford Pipeline (SpOOx)] and visual-analytical tool, Multi-Dimensional Viewer (MDV) software, as a resource for spatial analysis.


Conflict of interest statement

P.K. has acted as a consultant for Biomunex, Infinitopes, Astra Zeneca and UCB. The remaining authors declare no competing interests.

Figures

Fig. 1
Fig. 1. Spatial analysis pipeline and histopathology categorisation of samples.
a Overview of the workflow and SpOOx pipeline. The steps of the analysis are presented in Supplementary Fig. 1 in more detail. n = 677,623 single cells refer to segmented cells, without filtering for cells with no antibody staining, and ‘undefined’ clusters. IMC – imaging mass cytometry. b H&E section from COVID-19 tissue section showing formal histopathology features of alveolitis (ALV), diffuse alveolar damage (DAD) and organizing pneumonia with their corresponding MCD file image showing staining for 5 of 35 antibodies (α-SMA, EpCAM, PanCK, Col 1a and CD31). ‘a–‘c’ in figure refer to characteristic features of ALV, DAD and OP. ‘a’ - thickened alveolar epithelial wall and septae with immune cell infiltrate and congestion of alveolar walls ‘b’ widespread presence of hyaline membrane, and regenerating/proliferating Type II alveolar epithelium and ‘c’ -fibroblasts and collagen presence around bronchial epithelium. See also Supplementary Fig. 2. Representative H&E and MCD images is for ROI from n = 10 ROIs for ALV, n = 8 ROIs (DAD), n = 8 ROIs (OP); n = 12 patients. H&E staining performed once per tissue section. 37-plex staining was performed once for each lung sample. c Point when samples were obtained from the first day of symptoms and corresponding histopathology states in lung sections. Mean and S.D. shown, p value calculated using one-way ANOVA test with Tukey’s multiple comparison test; normality tested with d’Agostino & Pearson test. n = 4 patients in each histopathology group (ALV, DAD and OP). d C-reactive protein (CRP) levels closest to the point of sampling and corresponding histopathology state in lung sections. Median and IQR shown, p value calculated using Kruskal-Wallis test with Dunn’s multiple comparison test. n = 4 patients in each histopathology group (ALV, DAD and OP). Source data are provided in the Source Data File.
Fig. 2
Fig. 2. High definition immunophenotyping of lung cells and identification of tissue structure.
a UMAP representation of myeloid, lymphocyte and structural cell ‘mega clusters’ from all regions of interest (ROI) (k = 30) (COVID-19 and HC). See also Supplementary Fig. 7 for extended analysis steps. HC – healthy control. b, c Number of cells per mm2 of lung tissue sections in all COVID-19 samples (n = 12 patients, 30 ROIs’ in total) compared to healthy control (HC) samples (n = 2 individuals, 4 ROIs in total). Median shown, error bars are IQR. n = 524,552 cells in total for COVID-19 samples, n = 30,053 cells for HC. Statistical analysis performed after samples grouped into histopathology states (see Fig. 3d). Source data are provided in the Source Data File. d, e Immunofluorescence (IF) staining validation for Neut_CD8_ADJ cell cluster and Mono_CD31_ADJ cell clusters. Small panels are high magnification confocal images showing CD8 and CD15 staining (top small panel), and CD14 and CD31 staining (bottom small panel) on adjacent cells. Broken yellow circles show CD8 T cell (white- CD8) – neutrophil (green-CD15) couplets throughout lungs (d); and CD14-staining cells next to CD31-expressing cells (endothelium) in lung tissue (e). See also Supplementary Fig. 6 for negative controls. IF images shown are representative of lung sections from n = 3 patients; staining experiment performed once per lung sections. f Heatmap of median scaled intensity for each marker for all cell clusters in the ‘Myeloid’ mega cluster. ‘n_cells’ - average number of cells in all COVID-19 ROIs. Total cells – 171, 777. UD – undefined cluster. g, h Exemplar MCD image from 37-plex imaging mass cytometry (IMC) staining of a DAD ROI showing expression of CD8 T cells (CD8 -green), neutrophils (CD15-red) and CD8_CD15_ADJ cell clusters (green and red co- expression, making yellow). Image is one of n = 26 ROIs, some of which do not have the CD8_CD15_ADJ cell clusters—see Fig. 3b for number of ROIs showing presence of this cell cluster in all ROIs (n = 26 COVID-19; n = 4 HC). h Same MCD images as (G) but with IFN-β channel ‘open’ (white) showing IFN-β expression on Neut_CD8_ADJ (yellow). i Higher magnification of a set of 3 MCD panels - ‘none’ - Neut_CD8_ADJ (yellow) only (arrows); ‘IFN-γ’ – with ‘IFN-γ’ (white) channel opened on MCD viewer showing expression on Neut_CD8_ADJ (yellow) (arrows) and some CD8 (green); ‘GZB’ - with ‘GZB’ (cyan) channel opened and showing expression on Neut_CD8_ADJ (yellow) (arrows). CD172a panel shows confocal immunofluorescence staining (white) on CD15 and CD8 adjacent to each other. IF images shown are representative of lung sections from n = 3 patients; staining experiment performed once per lung sections. ALV – alveolitis, DAD – diffuse alveolar damage, OP -organising pneumonia. MCD images from all 26 ROIs (n = 10 ALV, n = 8 DAD and n = 8 OP) were analysed and median expression intensity for all ROIs shown in (f) and Supplementary Fig. S7. All scale bars in μm.
Fig. 3
Fig. 3. Quantification of immune and structural cells in COVID-19 lungs.
ac Cell abundance plots for immune cells (myeloid and lymphoid cells) and structural cells in lung tissue, adjusted for surface area in COVID lungs categorised into those with histopathology states of alveolitis(ALV) (n = 4 patients, 10 ROIs), diffuse alveolar damage (DAD) (n = 4 patients, 8 ROIs) and organising pneumonia (OP) (n = 4 patients, 8 ROIs), compared to healthy control (n = 2 individuals, 4 ROIs). Line in figure represents median. See Supplementary Table 4 for extended phenotypic description for all cell types and clusters. Source data are provided in the Source Data File. d Heatmap of fold change (FC) difference in abundance of cell types for COVID-19 samples (ALV, DAD and OP) vs healthy controls (HC) depicted in (a). Asterisks show those with significant differences - adjusted p values are *p < 0.05 **p < 0.01 ***p < 0.001, calculated using code from the diffcyt R package (version 1.8.8) with the option testDA_edgeR; two-sided analysis employed, and multiple comparisons adjusted using Benjamini-Hochberg method. Arrow refers to immune cells that showed progressive increase in abundance with progression histopathology states from ALV to OP.
Fig. 4
Fig. 4. Spatial analysis of immune and structural cells in COVID-19 lungs.
a Schematic representation of the sequential spatial analysis of cellular co-location, starting with quadrat correlation matrix (QCM), then cross pair correlation function (cross-PCF) analysis, interrogation of cross-PCF output and organization according to main questions. QCM output is provided in Supplementary Fig. 8. b. g(r = 20) heatmaps showing statistically significant correlated pairs of cells derived from QCM and cross-PCF analysis (see Methods for full description). n = 479,349 single cells from n = 12 COVID patients’ lung sections (n = 26 ROIs); in total, n = 144,937 cells in ALV, n = 146333 in DAD and n = 163,506 in OP. Red boxes indicate groups of cell subsets from the same immune phenotype—neutrophils (Group 1), monocytes and macrophages (Group 2), CD3 T cells (Group 3) and MAIT cells (Group 4).
Fig. 5
Fig. 5. Spatial organization of immune cells around structural cells in COVID-19 lungs.
a, b Spatial connectivity plots for proliferating alveolar epithelium, showing immune cells that are significantly co-located to proliferating alveolar epithelium (designated ‘anchor cell’) in the three histopathology states. The size of the nodes (filled-in circle) represents mean cell counts (abundance) for the specified cell cluster for all the ROIs in the histopathology state (scale shown in grey), and colour of nodes relate to histopathology state. Connecting lines indicate a statistically significant co-location between the two cell types derived from QCM and cross-PCF analyses. The thickness of the lines relates to the g(r = 20) value relative to each pair in the plot – the thicker the line, the higher the g(r = 20) and therefore greater strength of co-location between the immune cell type and anchor cell. n = 479,349 single cells from n = 12 COVID patients’ lung sections (n = 10 ROIs for ALV; n = 8 DAD; n = 8 OP); n = 144,937 cells in ALV, n = 146333 in DAD and n = 163,506 in OP. Histogram shows % of two anchor cells – proliferating alveolar epithelial (PAE) cells (c) and endothelial cells (d) that are in contact with specified immune cell type. Source data are provided in the Source Data File. e, f Cross-PCF profiles for the two most abundant co-located structure:immune cell pairs in DAD. Curves show the change in g(r) along the radius(r) from anchor cells [proliferating alveolar epithelium (prolif alv epit) and endothelial cells (endo)] for Neut-CD8_ADJ cell clusters and Mono_CD31_ADJ cell clusters respectively. Blue coloured area around curve is the 95% confidence interval for n = 8 ROIs with DAD. g. Radial connectivity map depicting all statistically significant pairs of structure:immune cells in all histopathology states; anchor cells (structural cells) are in smaller, inner circle. n = 479,349 single cells from n = 12 COVID patients’ lung sections (n = 10 ROIs for ALV; n = 8 DAD; n = 8 OP). ‘DRhi BE’ – HLADRhi bronchial epithelium; ‘DRlo BE’ – HLA DRlo bronchial epithelium; “Endo’- endothelial cells; ‘PAE’- ‘proliferating alveolar epithelium’, ‘PBE’ – ‘proliferating bronchial epithelium’; ‘PE’ – ‘proliferating endothelium’ ‘BV” –‘blood vessels’. Numerical values indicate g(r = 20) for that pair in that state (coloured bar), and % indicates proportion of anchor cells that are co-located with the specified immune cells. h Topographical correlation map showing distribution of the co-located Neut_CD8_ADJ cluster and proliferating alveolar epithelial cell pair (left panel) in an exemplar tissue (an ROI with DAD). Cells of type A (e.g. Neut_CD8_ADJ) are positively (Γab0) or negatively (Γab0) associated with cells of type B (e.g. Proliferating alveolar epithelium) (see Methods). i. MCD images showing Neut_CD8_ADJ clusters amidst single CD8+ T cells, CD15+ immature neutrophils and epithelial markers (EpCAM and PanCK). Couplets of CD8+ and CD15+ cells - Neut_CD8_ADJ clusters (red and green merging to form yellow cells) (arrows) are most clearly visible in DAD. Exemplar section is shown from analyses of n = 10 ALV ROIs, n = 8 DAD ROIs and n = 8 OP ROIs (n = 12 patients). Sections were stained once with 37 plex panel.
Fig. 6
Fig. 6. Spatial organization amongst immune cells in COVID-19 lungs.
Radial connectivity map depicting all statistically significantly co-located pairs of immune- immature neutrophil subsets (including ADJ subsets) (a) immune-monocyte subsets (b, c, separated for clarity) cells in all histopathology states (n = 10 ALV, n = 8 DAD and n = 8 OP). Anchor cells (immature neutrophil and monocyte subsets) are in smaller, inner circle. Numerical values indicate g(r = 20) for that pair in that state (coloured bar), and % indicates proportion of anchor cells that are co-located with the specified immune cells. These significantly co-located pairs of cells are derived from n = 479,349 single cells in all ROIs from n = 12 COVID patients’ lung sections (n = 10 ROIs for ALV; n = 8 DAD; n = 8 OP); n = 144,937 cells in ALV, n = 146333 in DAD and n = 163,506 in OP (see “Methods” for 3-step mathematical algorithm for determining statistical significance of co-location). Spatial connectivity plots for Neut_CD8_ADJ (d) and Mono_CD31_ADJ (e), showing immune cells that are statistically significant co-located to proliferating alveolar epithelium (designated ‘anchor cell’) in the three histopathology states (see “Methods” for 3-step mathematical algorithm for determining statistical significance of co-location). Size of nodes (filled-in circle) represent mean cell counts for the specified cell cluster for all the ROIs in the histopathology state, and colour of nodes relate to histopathology state. Connecting lines indicate a statistically significant co-location between the two cell types derived from QCM and cross-PCF analyses. Thickness of line relate to value of g(r = 20) relative to each pair in the plot – the thicker the line, the higher the g(r = 20) and strength of co-location between the immune cell type and anchor cell. f Adjacency cell network (ACN) map showing contact between the Mono_CD31_ADJ cluster, Neut_CD8_ADJ cluster and proliferating alveolar epithelial. Cell segmentation masks generated by DeepCell were used to produce this spatially-embedded network in which nodes represent centres of cell types (e.g. green – Neut_CD8_ADJ cell cluster). Nodes are connected by a line if the corresponding cells in the segmentation mask share a border. g MCD image showing CD8 (green), CD15(red) and CD15 and CD8 co-staining (yellow) (representing Neut_CD8_ADJ cell clusters) amidst endothelial cells (CD31 staining in turquoise) and monocytes (CD14 staining in purple) in a lung section with DAD on histopathology analysis. Exemplar ROI is shown for (f) and (g), out of 26 ROIs stained, from 12 patients (n = 10 ALV ROI, n = 8 DAD and n = 8 OP).
Fig. 7
Fig. 7. Comparison between blood (COMBAT) and lung (COSMIC) data.
a SCMAP matching heatmaps representing the Jaccard indices of similarity between COMBAT (blood) and COSMIC (lung) lymphocyte clusters. CD107a- CD8 T cell and CD107a+ CD8 T cell in COSMIC matched to blood GZB- CD8 T cells in COMBAT. IFN-γ+ CD4 T cells matched to COMBAT’s ‘activated CD4 T cells’. b SCMAP matching heatmaps representing the Jaccard indices of similarity between COMBAT (blood) and COSMIC (lung) myeloid clusters. Mono_CD31_ADJ and Mono_PAI-1_ADJ and all macrophage subsets matched with HLA DRhi classical monocytes in the blood from COMBAT data. c UMAP representation of neutrophils from controls and COVID-19 infected patients (n = 2,776,928 single cells from n = 77 COVID-19 patients and 11 healthy volunteers (HV), down sampled to 100 000 cells per condition) obtained from COMBAT consortium, showing 8 subsets of neutrophils. d Heatmap showing median marker expression for genes (selected to match COSMIC’s key protein expression on neutrophils) on the 8 neutrophil subsets, demonstrating high similarity of marker expression in immature neutrophil 2 (iNeut2) in COMBAT (blood) with Neut_CD8_ADJ in COSMIC (lung) (See also Fig. 2f). e Abundance of the 8 neutrophil subsets in blood as % of total neutrophils, from healthy volunteers (HV), mild, severe and critical COVID-19 patients from the COMBAT consortium showing a progressive increase in immature 2 neutrophils with increasing COVID-19 disease severity. HV (n = 11), mild (n = 18), severe (n = 41), critical (n = 18) patients, n = 1 experiment. The boxplot is median, with IQR; whiskers are the range or 1.5*IQR (whichever is smaller). Composition analysis was performed using scCODA with inbuilt adjustment for multiple comparison. Credible compositional changes were identified comparing all groups to HV and FDR < 0.1 is marked with #. Source data are provided in Source Data File.

References

    1. Wang, et al. Estimating excess mortality due to the COVID-19 pandemic: a systematic analysis of COVID-19-related mortality, 2020-21. Lancet. 2022;399:1513–1536. doi: 10.1016/S0140-6736(21)02796-3. - DOI - PMC - PubMed
    1. Gorog DA, et al. Current and novel biomarkers of thrombotic risk in COVID-19: a Consensus Statement from the International COVID-19 Thrombosis Biomarkers Colloquium. Nat. Rev. Cardiol. 2022;19:475–495. doi: 10.1038/s41569-021-00665-7. - DOI - PMC - PubMed
    1. Lamers MM, Haagmans BL. SARS-CoV-2 pathogenesis. Nat. Rev. Microbiol. 2022;20:270–284. doi: 10.1038/s41579-022-00713-0. - DOI - PubMed
    1. Nalbandian A, et al. Post-acute COVID-19 syndrome. Nat. Med. 2021;27:601–615. doi: 10.1038/s41591-021-01283-z. - DOI - PMC - PubMed
    1. Pustake M, Tambolkar I, Giri P, Gandhi C. SARS, MERS and CoVID-19: An overview and comparison of clinical, laboratory and radiological features. J. Fam. Med Prim. Care. 2022;11:10–17. doi: 10.4103/jfmpc.jfmpc_839_21. - DOI - PMC - PubMed

Publication types