

Global, regional and national burden of male infertility in 204 countries and territories between 1990 and 2019: an analysis of global burden of disease study
- PMID: 37940907
- PMCID: PMC10631182
- DOI: 10.1186/s12889-023-16793-3
Global, regional and national burden of male infertility in 204 countries and territories between 1990 and 2019: an analysis of global burden of disease study
Abstract
Background: Many countries and regions have experienced male fertility problems due to various influencing factors, especially in less developed countries. Unlike female infertility, male infertility receives insufficient attention. Understanding the changing patterns of male infertility in the world, different regions and different countries is crucial for assessing the global male fertility and reproductive health.
Methods: We obtained data on prevalence, years of life lived with disability (YLD), age-standardized rates of prevalence (ASPR) and age-standardized YLD rate (ASYR) from the Global Burden of Disease Study 2019. We analyzed the burden of male infertility at all levels, including global, regional, national, age stratification and Socio-demographic Index (SDI).
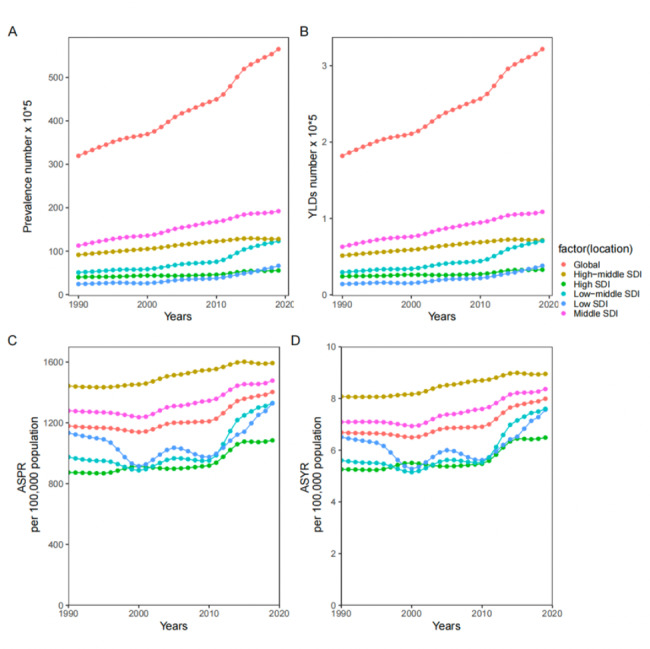
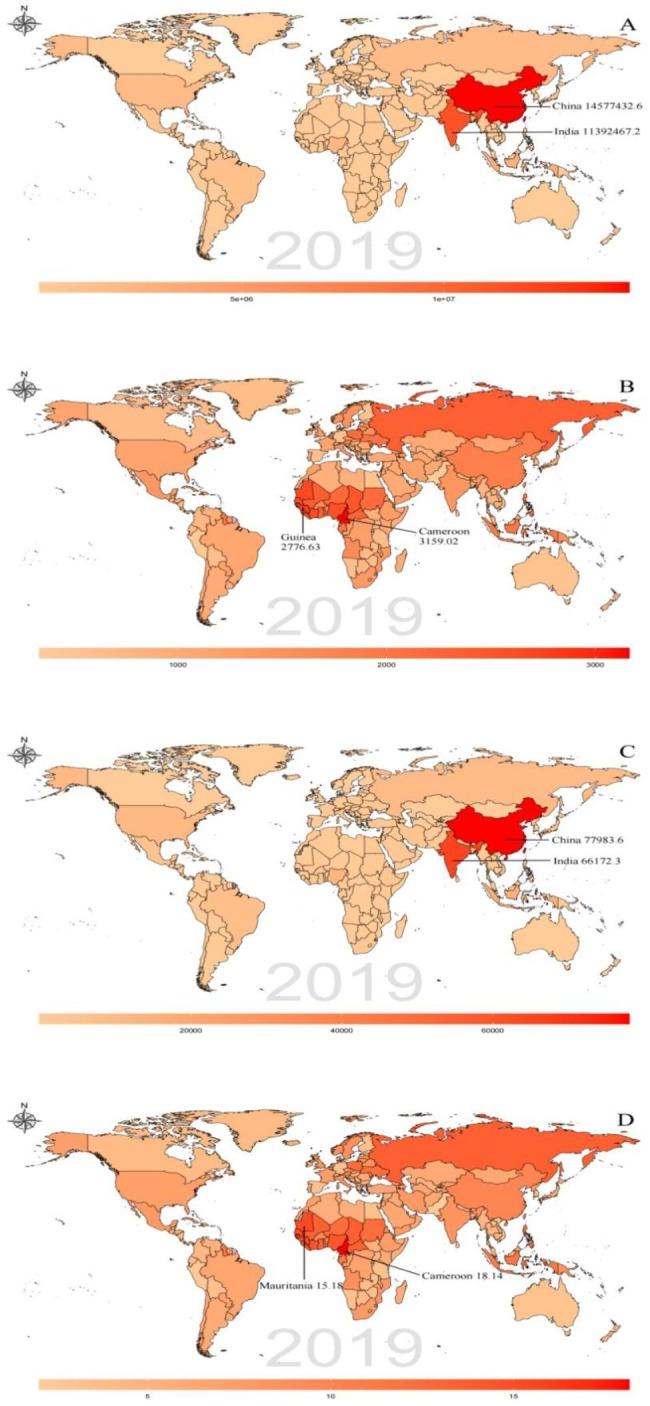
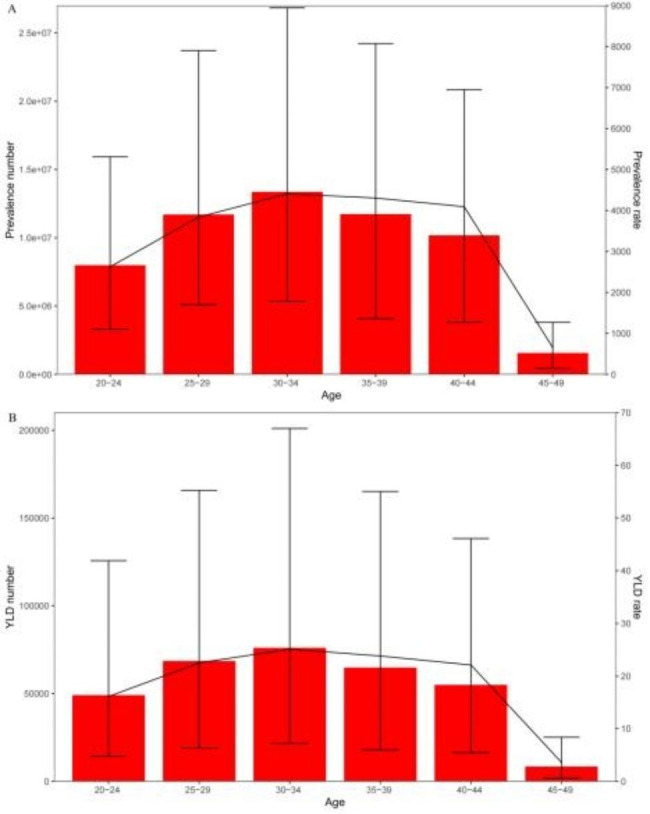
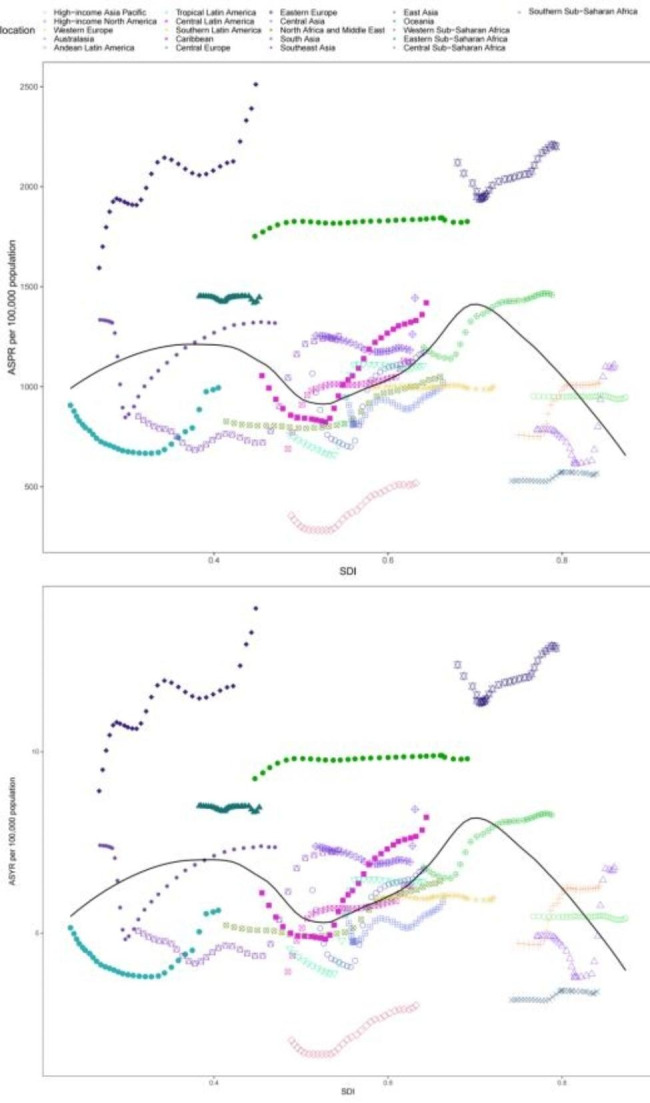
Results: In 2019, the global prevalence of male infertility was estimated to be 56,530.4 thousand (95% UI: 31,861.5-90,211.7), reflecting a substantial 76.9% increase since 1990. Furthermore, the global ASPR stood at 1,402.98 (95% UI: 792.24-2,242.45) per 100,000 population in 2019, representing a 19% increase compared to 1990. The regions with the highest ASPR and ASYR for male infertility in 2019 were Western Sub-Saharan Africa, Eastern Europe, and East Asia. Notably, the prevalence and YLD related to male infertility peaked in the 30-34 year age group worldwide. Additionally, the burden of male infertility in the High-middle SDI and Middle SDI regions exceeded the global average in terms of both ASPR and ASYR.
Conclusion: The global burden of male infertility has exhibited a steady increase from 1990 to 2019, as evidenced by the rising trends in ASPR and ASYR, particularly in the High-middle and Middle SDI regions. Notably, the burden of male infertility in these regions far exceeds the global average. Additionally, since 2010, there has been a notable upward trend in the burden of male infertility in Low and Middle-low SDI regions. Given these findings, it is imperative to prioritize efforts aimed at improving male fertility and reproductive health.
Keywords: Global burden of disease; Male infertility; Socio-demographic index; Years lived with disability.
© 2023. The Author(s).
Conflict of interest statement
The authors declare no competing interests.
Figures
References
-
- Vollset SE, Goren E, Yuan CW, Cao J, Smith AE, Hsiao T, et al. Fertility, mortality, migration, and population scenarios for 195 countries and territories from 2017 to 2100: a forecasting analysis for the global burden of Disease Study. Lancet. 2020;396(10258):1285–306. doi: 10.1016/S0140-6736(20)30677-2. - DOI - PMC - PubMed
MeSH terms
LinkOut - more resources
Full Text Sources
Medical
