

Heat-responsive microRNAs participate in regulating the pollen fertility stability of CMS-D2 restorer line under high-temperature stress
- PMID: 37941013
- PMCID: PMC10634144
- DOI: 10.1186/s40659-023-00465-y
Heat-responsive microRNAs participate in regulating the pollen fertility stability of CMS-D2 restorer line under high-temperature stress
Abstract
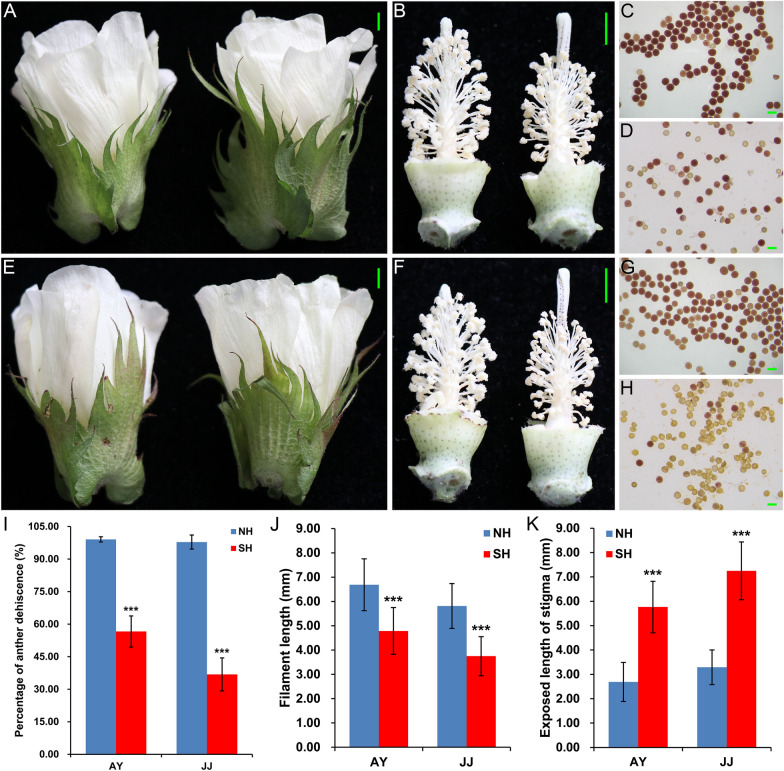
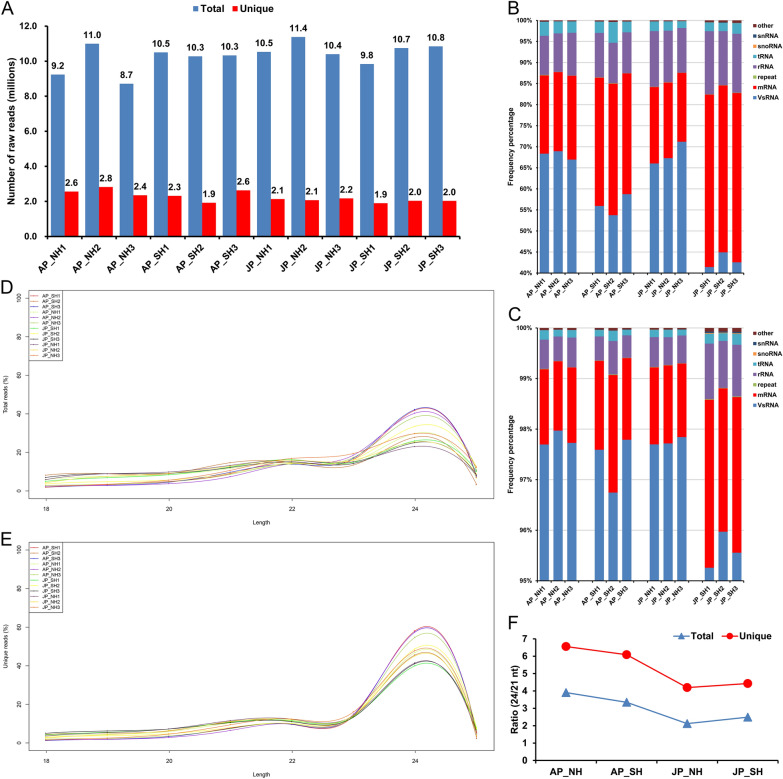
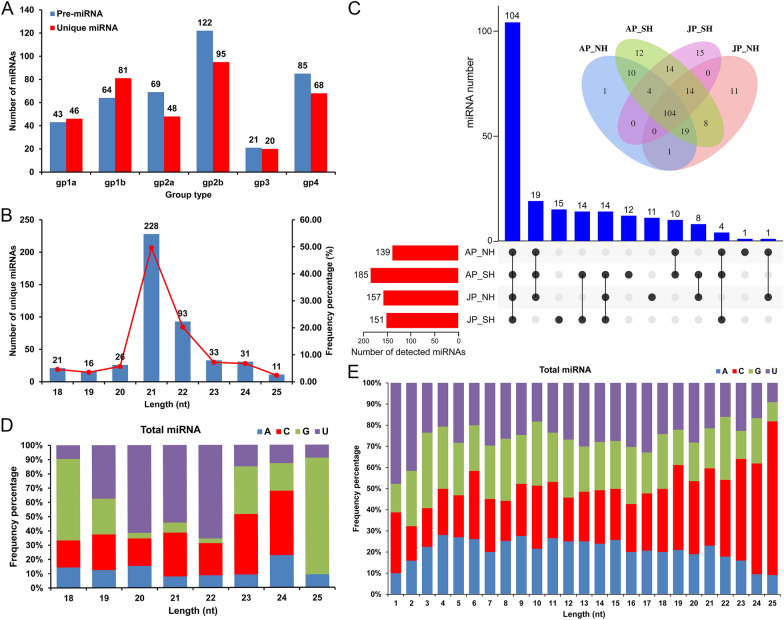
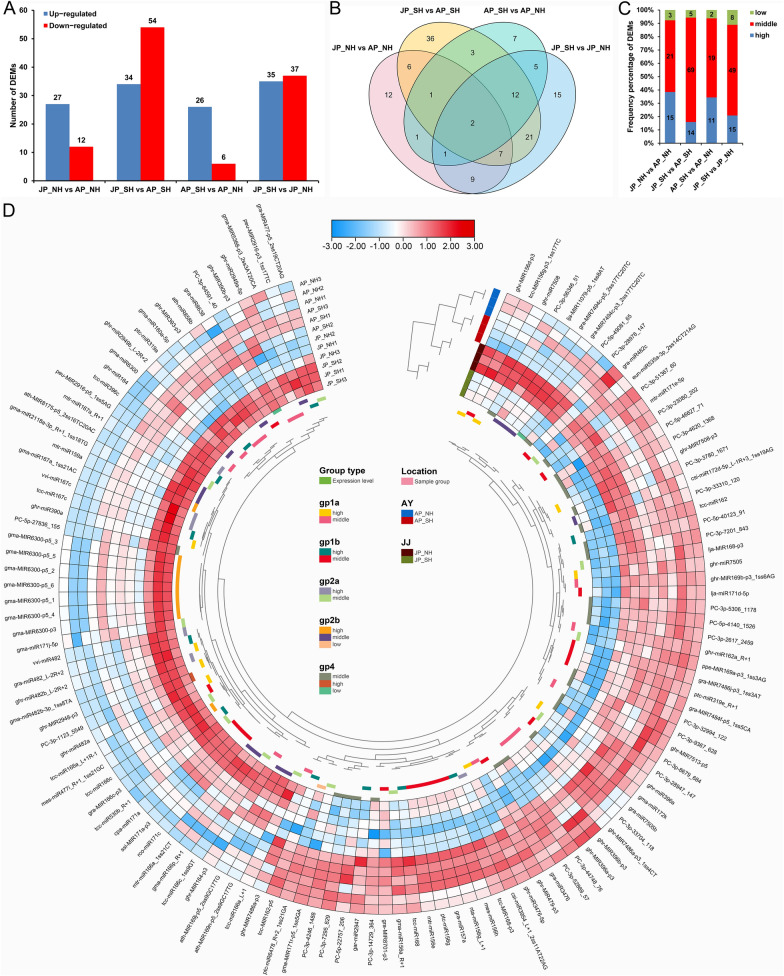
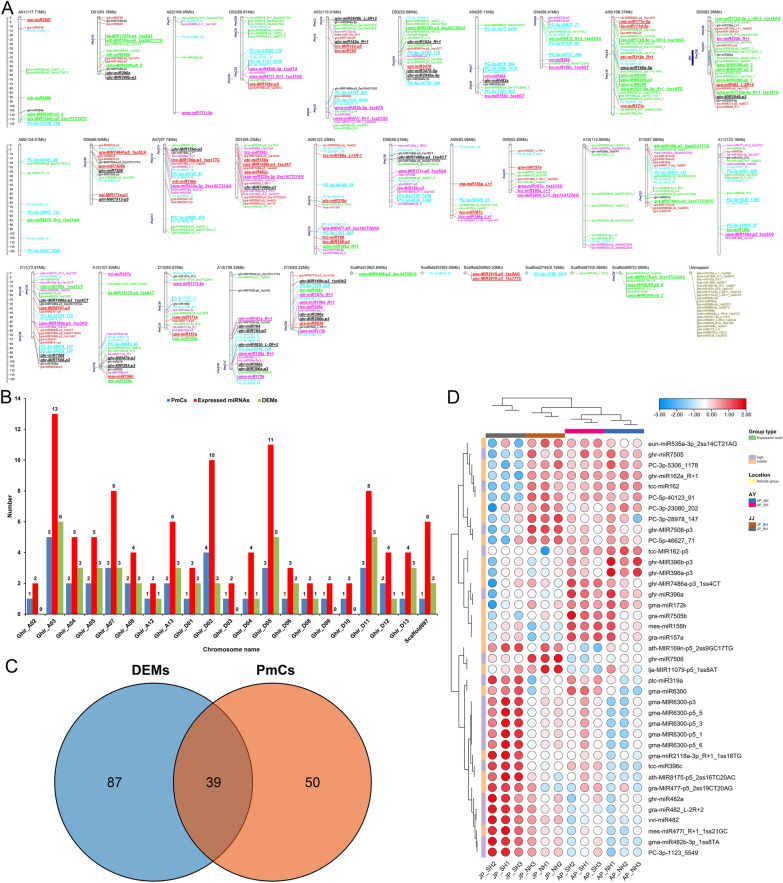
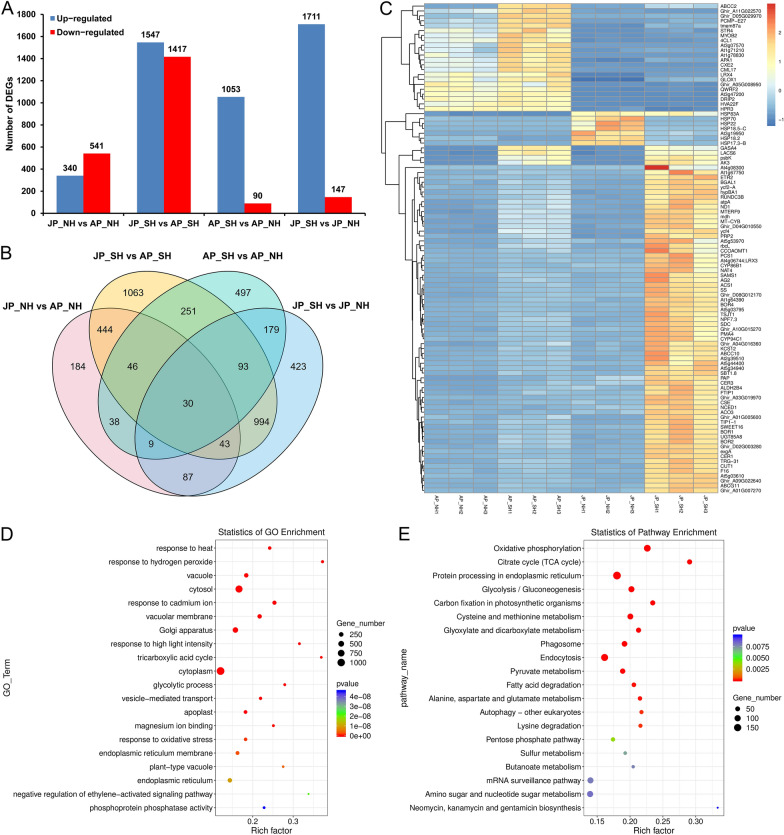
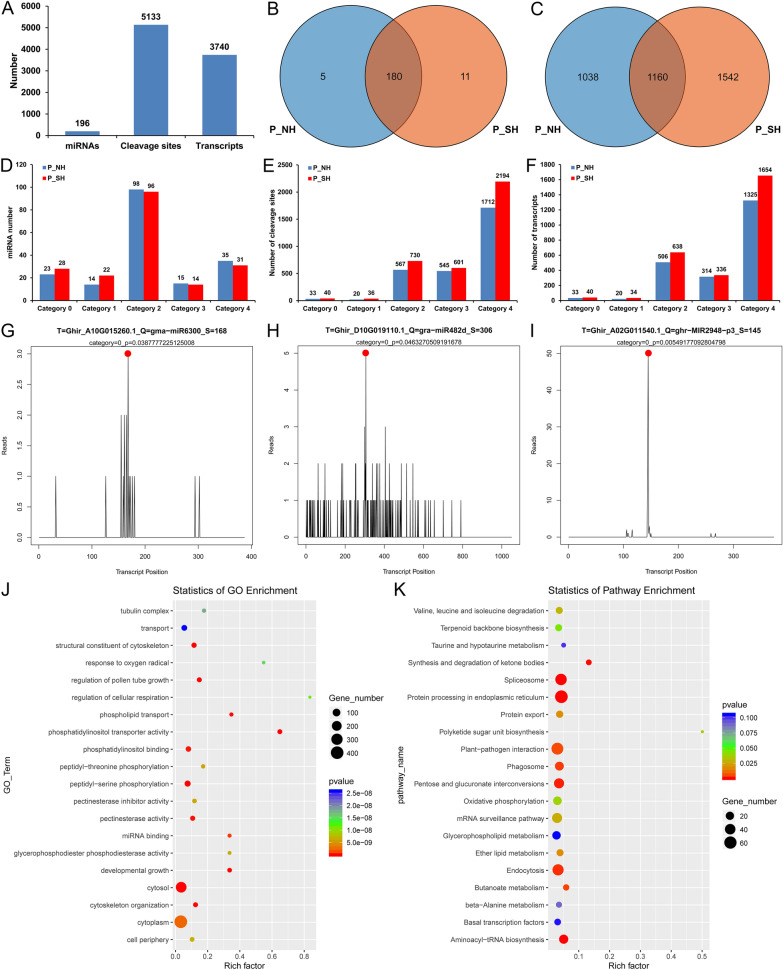
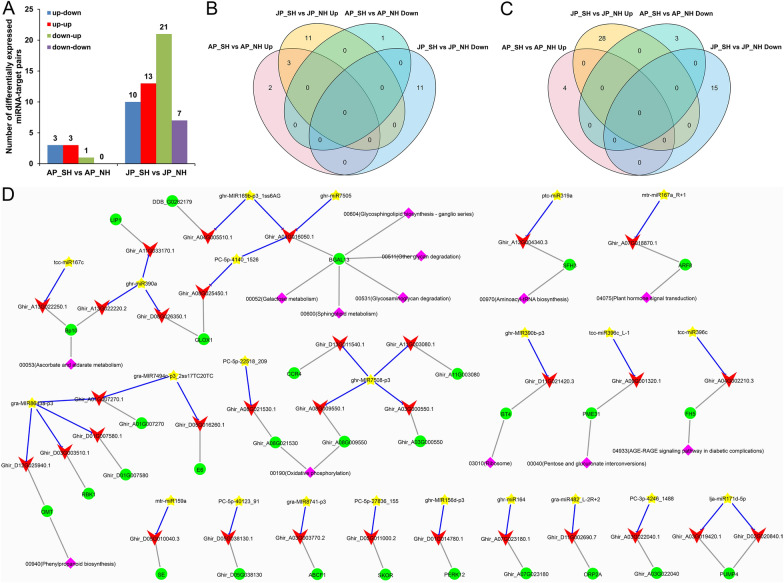
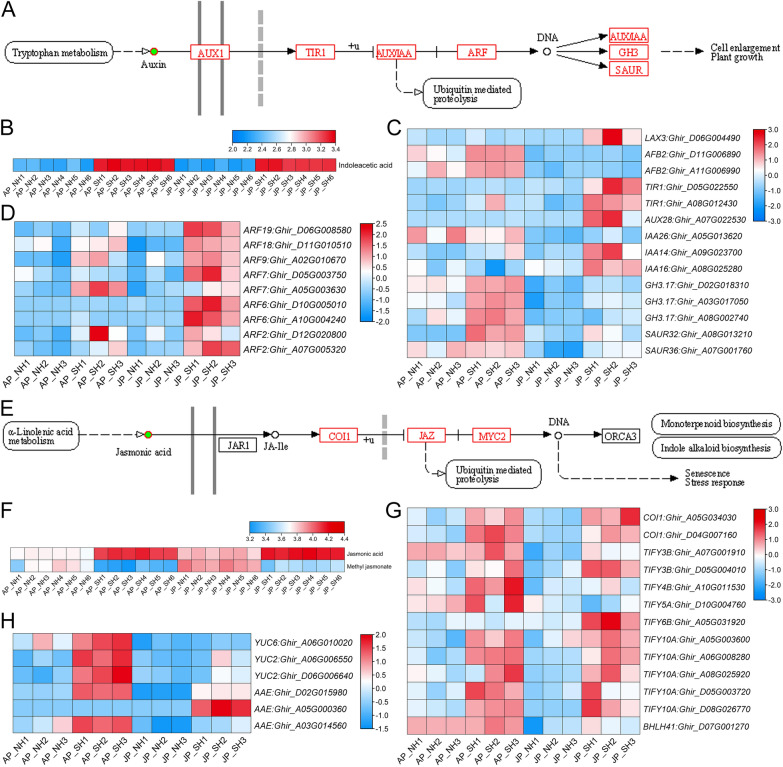
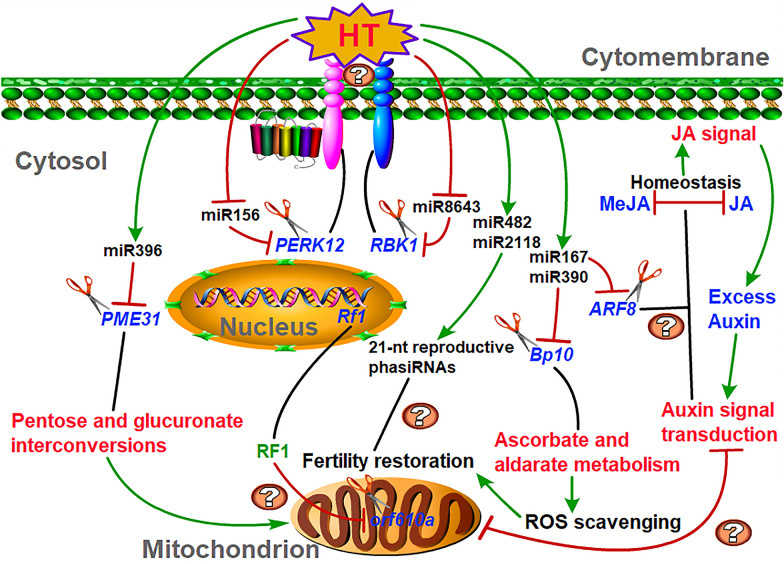
Anther development and pollen fertility of cytoplasmic male sterility (CMS) conditioned by Gossypium harknessii cytoplasm (CMS-D2) restorer lines are susceptible to continuous high-temperature (HT) stress in summer, which seriously hinders the large-scale application of "three-line" hybrids in production. Here, integrated small RNA, transcriptome, degradome, and hormone profiling was performed to explore the roles of microRNAs (miRNAs) in regulating fertility stability in mature pollens of isonuclear alloplasmic near-isogenic restorer lines NH and SH under HT stress at two environments. A total of 211 known and 248 novel miRNAs were identified, of which 159 were differentially expressed miRNAs (DEMs). Additionally, 45 DEMs in 39 miRNA clusters (PmCs) were also identified, and most highly expressed miRNAs were significantly induced in SH under extreme HT, especially four MIR482 and six MIR6300 family miRNAs. PmC28 was located in the fine-mapped interval of the Rf1 gene and contained two DEMs, gra-miR482_L-2R + 2 and gma-miR2118a-3p_R + 1_1ss18TG. Transcriptome sequencing identified 6281 differentially expressed genes, of which heat shock protein (HSP)-related genes, such as HSP70, HSP22, HSP18.5-C, HSP18.2 and HSP17.3-B, presented significantly reduced expression levels in SH under HT stress. Through integrating multi-omics data, we constructed a comprehensive molecular network of miRNA-mRNA-gene-KEGG containing 35 pairs of miRNA/target genes involved in regulating the pollen development in response to HT, among which the mtr-miR167a_R + 1, tcc-miR167c and ghr-miR390a, tcc-miR396c_L-1 and ghr-MIR169b-p3_1ss6AG regulated the pollen fertility by influencing ARF8 responsible for the auxin signal transduction, ascorbate and aldarate metabolism, and the sugar and lipid metabolism and transport pathways, respectively. Further combination with hormone analysis revealed that HT-induced jasmonic acid signaling could activate the expression of downstream auxin synthesis-related genes and cause excessive auxin accumulation, followed by a cascade of auxin signal transduction, ultimately resulting in pollen abortion. The results provide a new understanding of how heat-responsive miRNAs regulate the stability of fertility restoration for CMS-D2 cotton under heat stress.
Keywords: CMS-D2 restorer line; Degradome; High-temperature stress; MiRNA cluster; Plant hormone signal transduction; Pollen fertility stability.
© 2023. The Author(s).
Conflict of interest statement
The authors declare that they have no known competing financial interests or personal relationships that may be perceived as influencing their work.
Figures
Similar articles
-
Identification and characterization of circular RNAs involved in the fertility stability of cotton CMS-D2 restorer line under heat stress.BMC Plant Biol. 2024 Jan 5;24(1):32. doi: 10.1186/s12870-023-04706-w. BMC Plant Biol. 2024. PMID: 38183049 Free PMC article.
-
Integrated analysis of metabolome and transcriptome reveals the cytoplasmic effects of CMS-D2 on pollen fertility resulting from disrupted lipid metabolism.Front Plant Sci. 2022 Sep 30;13:998203. doi: 10.3389/fpls.2022.998203. eCollection 2022. Front Plant Sci. 2022. PMID: 36247574 Free PMC article.
-
Dose effects of restorer gene modulate pollen fertility in cotton CMS-D2 restorer lines via auxin signaling and flavonoid biosynthesis.Plant Cell Rep. 2023 Nov;42(11):1705-1719. doi: 10.1007/s00299-023-03053-2. Epub 2023 Sep 16. Plant Cell Rep. 2023. PMID: 37715064
-
[Cytoplasmic male sterility and restoration of pollen fertility in higher plants].Genetika. 2007 Apr;43(4):451-68. Genetika. 2007. PMID: 17555121 Review. Russian.
-
Two non-allelic nuclear genes restore fertility in a gametophytic pattern and enhance abiotic stress tolerance in the hybrid rice plant.Theor Appl Genet. 2012 Mar;124(5):799-807. doi: 10.1007/s00122-011-1755-9. Epub 2011 Dec 4. Theor Appl Genet. 2012. PMID: 22139140 Review.
Cited by
-
Integrative phenotyping analyses reveal the relevance of the phyB-PIF4 pathway in Arabidopsis thaliana reproductive organs at high ambient temperature.BMC Plant Biol. 2024 Jul 29;24(1):721. doi: 10.1186/s12870-024-05394-w. BMC Plant Biol. 2024. PMID: 39075366 Free PMC article.
-
Identification of differentially expressed miRNAs between male sterile and fertile floral buds in watermelon (Citrullus lanatus L.) via high-throughput sequencing.3 Biotech. 2024 Oct;14(10):247. doi: 10.1007/s13205-024-04084-6. Epub 2024 Sep 25. 3 Biotech. 2024. PMID: 39345966
-
Identification and characterization of circular RNAs involved in the fertility stability of cotton CMS-D2 restorer line under heat stress.BMC Plant Biol. 2024 Jan 5;24(1):32. doi: 10.1186/s12870-023-04706-w. BMC Plant Biol. 2024. PMID: 38183049 Free PMC article.
-
New insights into the salt-responsive regulation in eelgrass at transcriptional and post-transcriptional levels.Front Plant Sci. 2025 Feb 6;16:1497064. doi: 10.3389/fpls.2025.1497064. eCollection 2025. Front Plant Sci. 2025. PMID: 39980478 Free PMC article.
References
-
- Chen L, Tang H, Zhang X, Qi T, Guo L, Shahzad K, et al. Comparative performance of hybrid generations reveals the potential application of F2 hybrids in upland cotton. J Cotton Res. 2022;5(1):18. doi: 10.1186/s42397-022-00125-8. - DOI
-
- Kubo T, Kitazaki K, Matsunaga M, Kagami H, Mikami T. Male sterility-inducing mitochondrial genomes: how do they differ? Crit Rev Plant Sci. 2011;30(4):378–400. doi: 10.1080/07352689.2011.587727. - DOI
-
- Shahzad K, Li X, Qi T, Guo L, Tang H, Zhang X, et al. Genetic analysis of yield and fiber quality traits in upland cotton (Gossypium hirsutum L.) cultivated in different ecological regions of China. J Cotton Res. 2019;2(1):14. doi: 10.1186/s42397-019-0031-4. - DOI
-
- Havey MJ. The use of cytoplasmic male sterility for hybrid seed production. In: Molecular biology and biotechnology of plant organelles. Berlin/Heidelberg, Germany: Springer; 2004, pp 623–634.
-
- Wu J, Gong Y, Cui M, Qi T, Guo L, Zhang J, et al. Molecular characterization of cytoplasmic male sterility conditioned by Gossypium harknessii cytoplasm (CMS-D2) in upland cotton. Euphytica. 2011;181(1):17–29. doi: 10.1007/s10681-011-0357-6. - DOI
MeSH terms
Substances
Grants and funding
- 232300421269/Youth Program of the Natural Science Foundation of Henan Province
- 212101510001/Zhongyuan Academician Foundation
- 232300421168/General Program of the Natural Science Foundation of Henan Province
- CB2022C05/Fundamental Research Funds for National Key Laboratory of Cotton Bio-breeding and Integrated Utilization
LinkOut - more resources
Full Text Sources
