. 2023 Nov 8;10(1):53.
doi: 10.1186/s40779-023-00487-3.

Caveolin-1 is critical for hepatic iron storage capacity in the development of nonalcoholic fatty liver disease

Affiliations

Caveolin-1 is critical for hepatic iron storage capacity in the development of nonalcoholic fatty liver disease

Guang-Hui Deng et al. Mil Med Res. .

Abstract

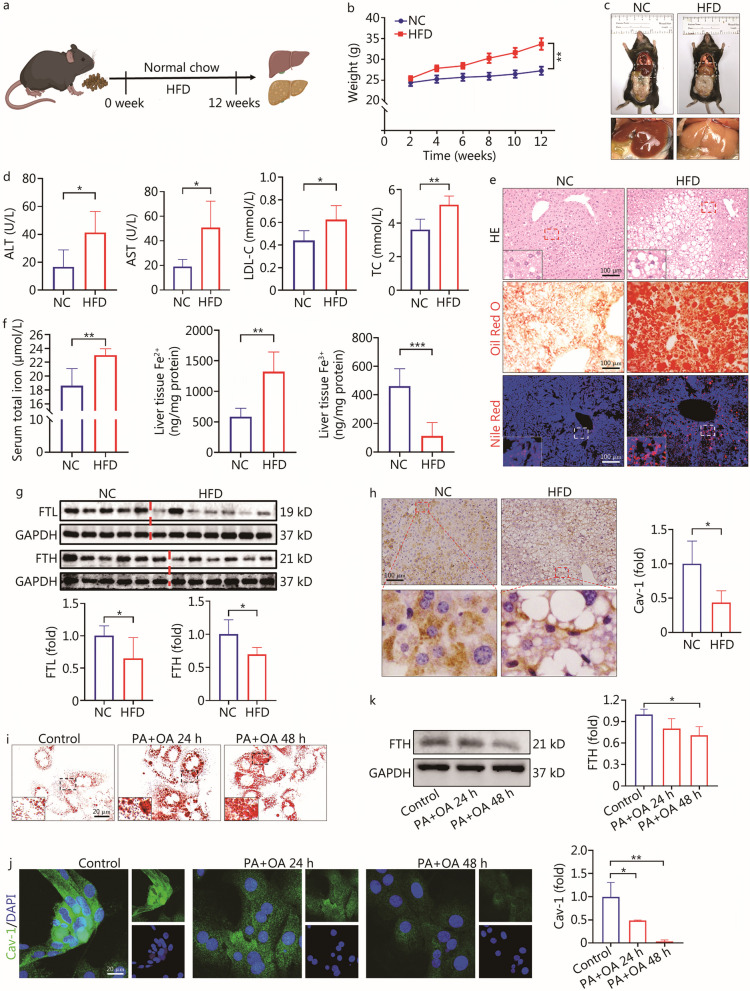
Background: Nonalcoholic fatty liver disease (NAFLD) is associated with disordered lipid and iron metabolism. Our previous study has substantiated the pivotal role of Caveolin-1 (Cav-1) in protecting hepatocytes and mediating iron metabolism in the liver. This study aimed to explore the specific mechanisms underlying the regulation of iron metabolism by Cav-1 in NAFLD.

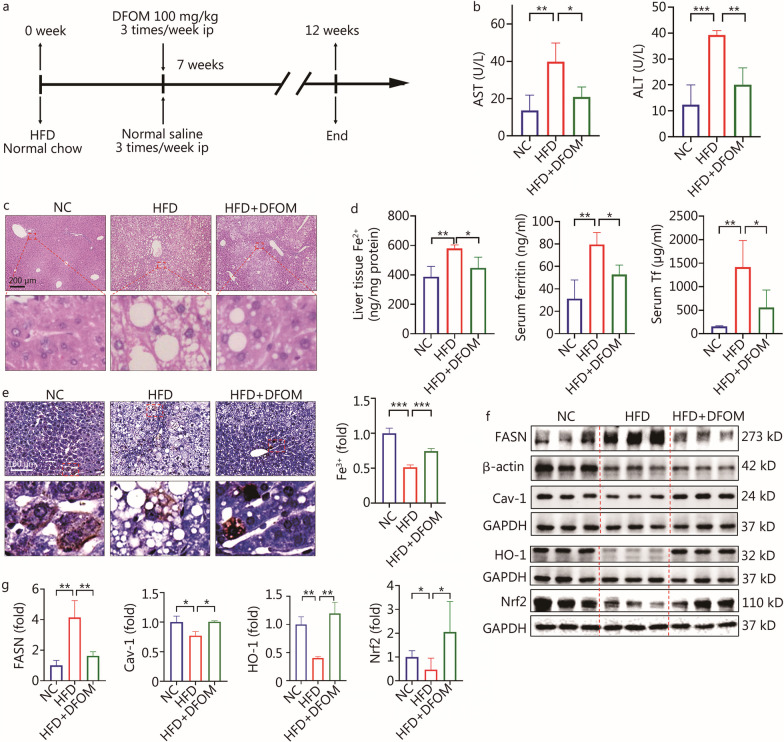
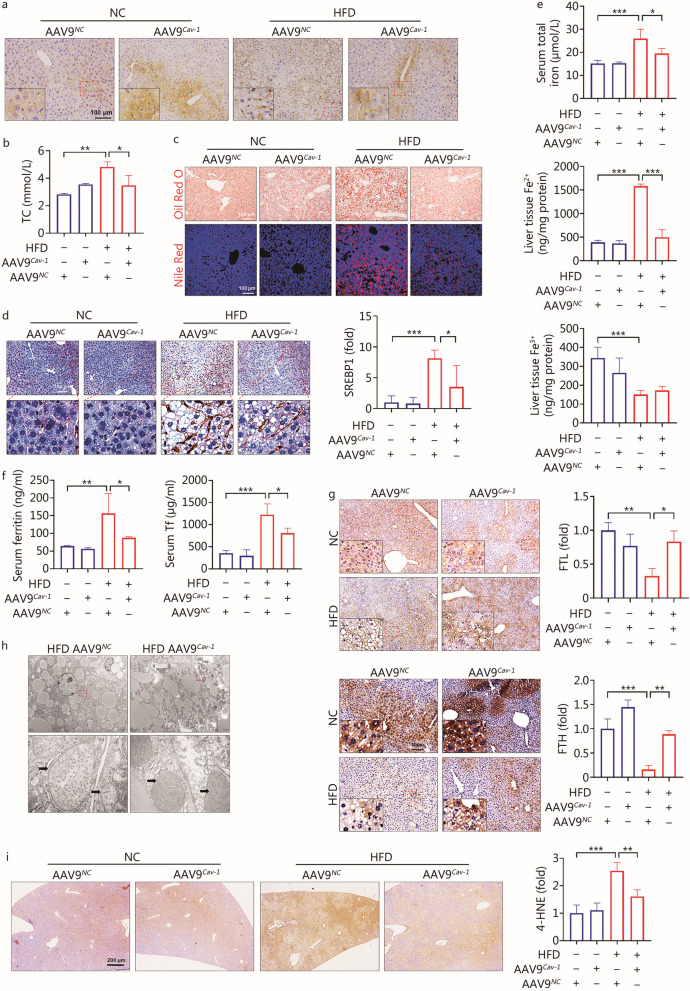
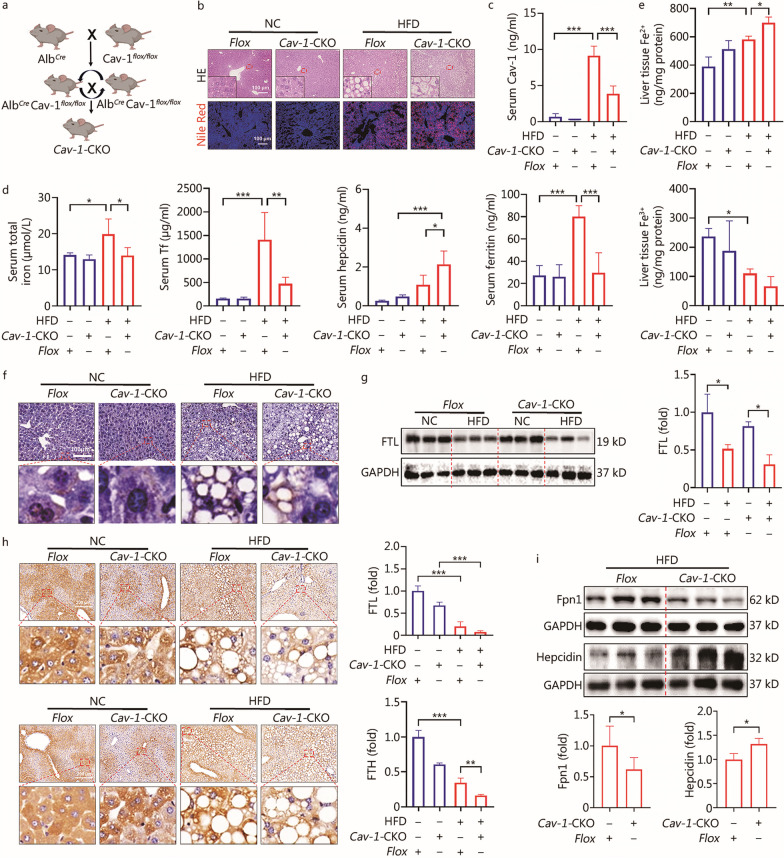
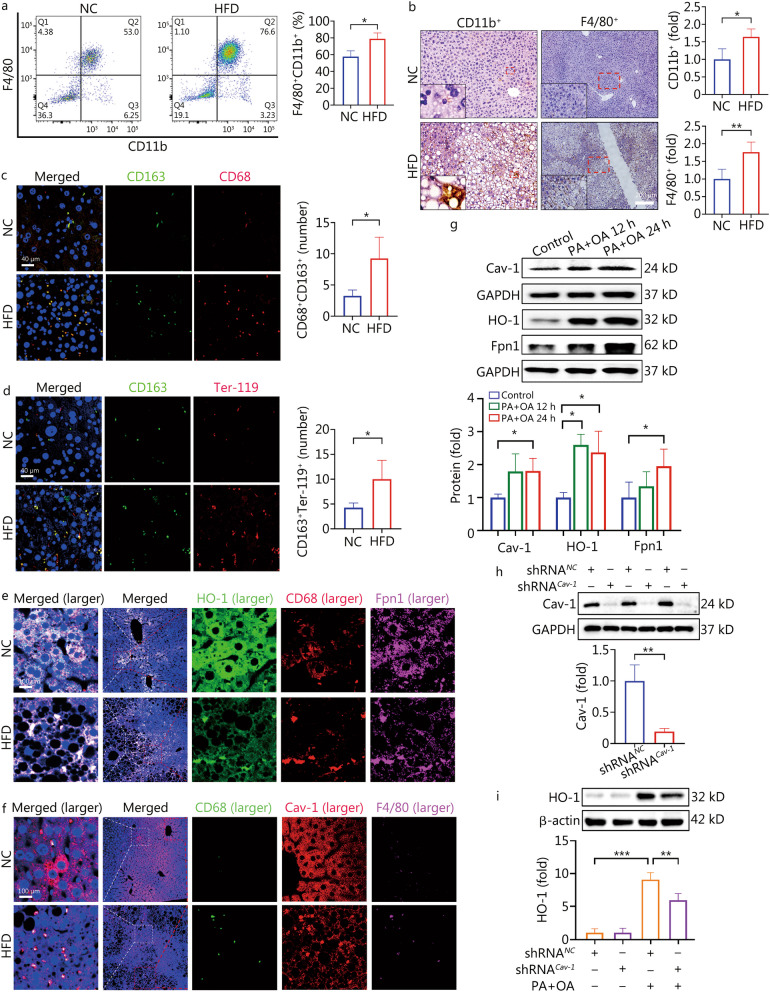
Methods: Hepatocyte-specific Cav-1 overexpression mice and knockout mice were used in this study. Cav-1-knockdown of RAW264.7 cells and mouse primary hepatocytes were performed to verify the changes in vitro. Moreover, a high-fat diet and palmitic acid plus oleic acid treatment were utilized to construct a NAFLD model in vivo and in vitro, respectively, while a high-iron diet was used to construct an in vivo iron overload model. Besides, iron concentration, the expression of Cav-1 and iron metabolism-related proteins in liver tissue or serum were detected using iron assay kit, Prussian blue staining, Western blotting, immunofluorescence staining, immunohistochemical staining and ELISA. The related indicators of lipid metabolism and oxidative stress were evaluated by the corresponding reagent kit and staining.

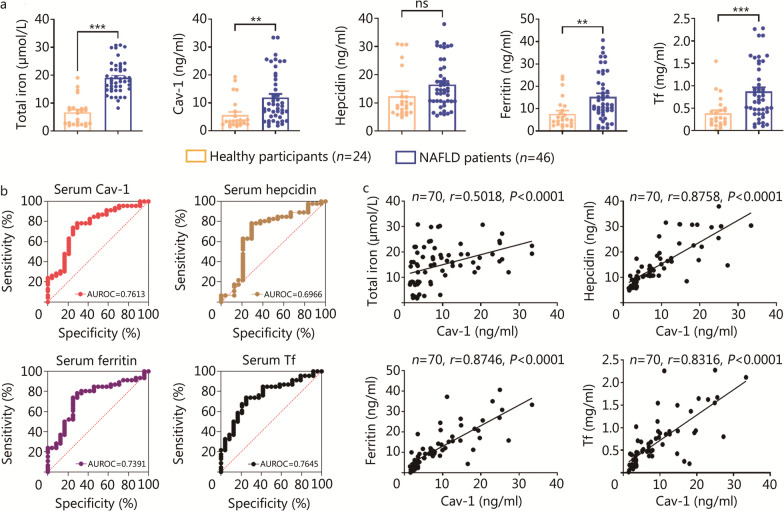
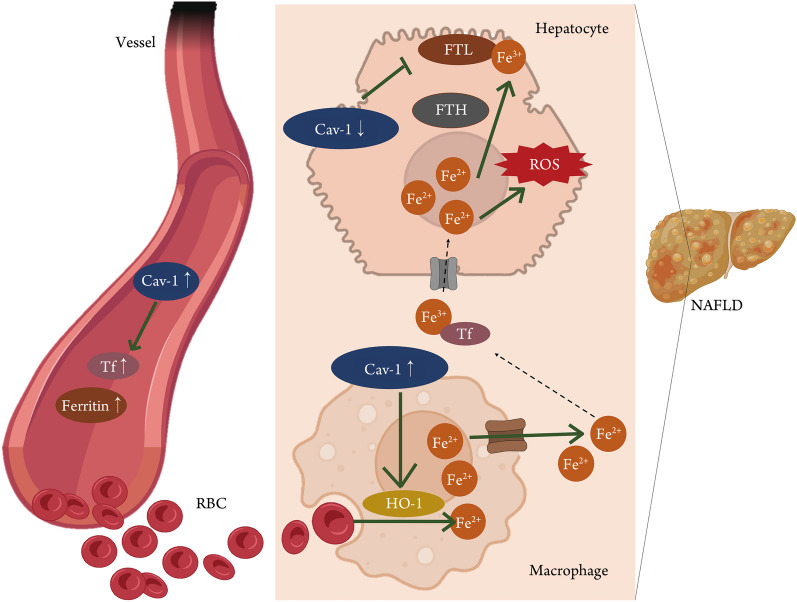
Results: Significant disorder of lipid and iron metabolism occurred in NAFLD. The expression of Cav-1 was decreased in NAFLD hepatocytes (P < 0.05), accompanied by iron metabolism disorder. Cav-1 enhanced the iron storage capacity of hepatocytes by activating the ferritin light chain/ferritin heavy chain pathway in NAFLD, subsequently alleviating the oxidative stress induced by excess ferrous ions in the liver. Further, CD68+CD163+ macrophages expressing Cav-1 were found to accelerate iron accumulation in the liver, which was contrary to the effect of Cav-1 in hepatocytes. Positive correlations were also observed between the serum Cav-1 concentration and the serum iron-related protein levels in NAFLD patients and healthy volunteers (P < 0.05).

Conclusions: These findings confirm that Cav-1 is an essential target protein that regulates iron and lipid metabolic homeostasis. It is a pivotal molecule for predicting and protecting against the development of NAFLD.

Keywords: Caveolin-1; Ferritin; Iron metabolism; Nonalcoholic fatty liver disease; Oxidative stress.


Conflict of interest statement

The authors declare no competing interests.

Figures

Fig. 1
Fig. 1
NAFLD was characterized by abnormal iron metabolism accompanied by down-regulation of Cav-1 in liver. a Flow chart of mouse NAFLD model construction. b Line chart of changes in body weight of mice within 12 weeks (n = 7). c Accumulation of fat in liver of mice. d Serum levels of ALT, AST, LDL-C and TC between NC group and HFD group (n = 5). e HE staining, Oil Red O staining and Nile Red staining results of liver tissue between NC group and HFD group. f Concentration of serum total iron, liver tissue Fe2+ and liver tissue Fe3+ between NC group and HFD group (n = 5). g Western blotting analyses of FTL and FTH proteins between NC group and HFD group (n ≥ 5). h Cav-1 immunohistochemistry staining between NC group and HFD group (n = 4). i Oil Red O staining results of primary hepatocytes with or without 100 μmol/L PA + 200 μmol/L OA. j Cav-1 immunofluorescence staining of primary hepatocytes with or without PA + OA (n = 3). k Western blotting analyses of FTH proteins with or without PA + OA (n = 3). *P < 0.05, **P < 0.01, ***P < 0.001, as determined by Student’s t test analysis or one-way ANOVA with Bonferroni post hoc analysis. All data were shown as the mean ± SD. NAFLD non-alcoholic fatty liver disease, NC negative control, HFD high-fat diet, ALT alanine aminotransferase, AST aspartate transaminase, LDL-C low-density lipoprotein cholesterol, TC total cholesterol, FTL ferritin light chain, FTH ferritin heavy chain, Cav-1 caveolin-1, PA palmitic acid, OA oleic acid
Fig. 2
Fig. 2
Iron chelator DFOM alleviated the development of NAFLD by improving iron and lipid metabolism. a Schematic diagram of DFOM intervention. b Serum levels of AST and ALT from mice with or without DFOM treatment (n ≥ 4). c HE staining results of liver tissue with or without DFOM treatment. d The concentration of liver tissue Fe2+, serum ferritin and serum Tf with or without DFOM treatment (n = 4). e Prussian blue staining of the liver (n = 4). f, g Western blotting method detected the expression of FASN, Cav-1, HO-1 and Nrf2 in liver tissue with or without DFOM treatment (n = 3). *P < 0.05, **P < 0.01, ***P < 0.001, as determined by one-way ANOVA. All data were shown as the mean ± SD. ns non-significant, DFOM deferoxamine mesylate, NAFLD non-alcoholic fatty liver disease, AST aspartate transaminase, ALT alanine aminotransferase, HFD high-fat diet, Tf transferrin, FASN fatty acid synthase, Cav-1 caveolin-1, Nrf2 nuclear factor erythroid 2-related factor 2, HO-1 heme oxygenase-1
Fig. 3
Fig. 3
Cav-1 promoted the storage of iron in the cells as Fe3+. a Western blotting detected the expression of Cav-1 between AAV9NC and AAV9Cav-1 (n = 3). b Immunofluorescence staining results showed the green fluorescence (EGFP) and red fluorescence (Cav-1) of liver tissue overlapped in the AAV9Cav-1 group. The red fluorescence of hepatocytes in the AAV9Cav-1 group was significantly increased (n = 3). c Concentration of serum total iron, serum ferritin and serum Tf between AAV9Cav-1 and AAV9NC mice with or without high-iron diet (n = 4). d Prussian blue staining results in different groups between AAV9Cav-1 and AAV9NC mice with high-iron diet. e The concentration of liver tissue Fe2+ between AAV9Cav-1 and AAV9NC mice with or without high-iron diet (n = 4). f Western blotting results of FTL in liver tissue between AAV9Cav-1 and AAV9NC mice with or without high-iron diet (n = 3). g Immunohistochemical staining was used to detect the expression of FTH in liver tissue between AAV9Cav-1 and AAV9NC mice with or without high-iron diet (n = 4). *P < 0.05, **P < 0.01, ***P < 0.001, as determined by Student’s t test analysis or one-way ANOVA. All data were shown as the mean ± SD. AAV9 adeno-associated virus 9, Cav-1 caveolin-1, Tf transferrin, FTL ferritin light chain, FTH ferritin heavy chain
Fig. 4
Fig. 4
Cav-1 alleviated the development of NAFLD by up-regulating the expression of FTL/FTH. a Immunohistochemical staining results of Cav-1 in liver tissue between AAV9Cav-1 and AAV9NC mice with or without high-fat diet (HFD) (n = 4). b Concentration of serum TC between AAV9NC and AAV9Cav-1 with or without HFD (n = 3). c Oil Red O staining and Nile Red staining detected lipid accumulation in liver tissue. d Immunohistochemical staining detected the expression of SREBP1 protein in liver tissue (n = 4). e Concentration of serum total iron, liver tissue Fe2+ and liver tissue Fe3+ between AAV9Cav-1 and AAV9NC mice with or without HFD (n = 4). f Concentration of serum ferritin and serum Tf in different groups (n = 4). g Immunohistochemical staining was used to detect the expression of FTL and FTH in liver tissue (n = 3). h Transmission electron microscopy to detect the changes in the mitochondrial structure of hepatocytes (n = 3). Black arrows indicate mitochondrion. i Immunohistochemical method detected the expression of 4-HNE protein in liver tissue (n = 4). *P < 0.05, **P < 0.01, ***P < 0.001, as determined by one-way ANOVA. All data were shown as the mean ± SD. AAV9 adeno-associated virus 9, TC total cholesterol, SREBP1 sterol regulatory element binding transcription factor 1, Tf transferrin, FTL ferritin light chain, FTH ferritin heavy chain, 4-HNE 4-hydroxynonenal
Fig. 5
Fig. 5
Cav-1 deficiency in hepatocytes aggravated the accumulation of liver Fe2+ in NAFLD. a Schematic construction of hepatocellular-specific Cav-1 knockdown mice. b HE staining and Nile Red staining results of liver tissue. c The concentration of serum Cav-1 between Flox mice and Cav-1-CKO mice with or without high-fat diet (HFD) (n = 4). d The concentration of serum total iron, serum Tf, serum hepcidin, and serum ferritin in different groups (n = 4). e The concentration of Fe2+ and Fe3+ in liver tissue between Flox mice and Cav-1-CKO mice with or without HFD (n = 4). f Prussian blue staining results in different groups. g The expression of FTL in liver tissue was detected by Western blotting (n = 3). h Immunohistochemical method detected the expression of FTL and FTH protein in liver tissue (n = 4). i The expression of Fpn1 and hepcidin in liver tissue between Flox mice and Cav-1-CKO mice with HFD (n ≥ 3). *P < 0.05, **P < 0.01, ***P < 0.001, as determined by Student’s t test analysis or one-way ANOVA. All data were shown as the mean ± SD. Cav-1-CKO Cav-1-knockout mice, Cav-1 caveolin-1, NAFLD non-alcoholic fatty liver disease, Tf transferrin, FTL ferritin light chain, FTH ferritin heavy chain, Fpn1 ferroportin 1, PA palmitic acid, OA oleic acid
Fig. 6
Fig. 6
The CD68+CD163+ macrophage with high expression of Cav-1 accelerated iron homeostasis disorder in NAFLD. a Number of F4/80+CD11b+ macrophages in liver tissue were detected by flow cytometry (n = 3). b Expression of CD11b+ and F4/80+ in liver tissue were detected by immunohistochemical method between NC group and HFD group (n = 4). c CD68 and CD163 immunofluorescence co-staining results in liver tissue (n = 4). d CD163 and Ter-119 immunofluorescence co-staining results in liver tissue (n = 4). e Expressing of HO-1, CD68 and Fpn1 in liver tissue were detected by multiplex fluorescence immunohistochemical staining method (n = 3). f Multiplex fluorescence immunohistochemical staining method to detect the activation of F4/80+CD68+ macrophages and the expression of Cav-1 in liver tissue (n = 3). g Western blotting detected the expression of Cav-1, HO-1 and Fpn1 proteins in RAW264.7 cells with or without PA + OA (n ≥ 3). h Western blotting detected the expression of HO-1 in RAW264.7 cell between shRNACav-1 treatment and shRNANC treatment (n = 3). i Western blotting detected the expression of HO-1 in RAW264.7 cell between shRNACav-1 treatment and shRNANC treatment with or without PA + OA (n = 3). *P < 0.05, **P < 0.01, ***P < 0.001 as determined by Student’s t test analysis or one-way ANOVA. All data were shown as the mean ± SD. Cav-1 caveolin-1, NAFLD non-alcoholic fatty liver disease, HFD high-fat diet, HO-1 heme oxygenase-1, Fpn1 ferroportin 1
Fig. 7
Fig. 7
Serum Cav-1 was a pivotal indicator in NAFLD and positively correlated with serum iron-related proteins in volunteers. a Detection of serum total iron, Cav-1, hepcidin, ferritin and Tf concentrations in healthy people (n = 24, the same below) and NAFLD patients (n = 46, the same below). b The AUROC analysis of serum Cav-1, hepcidin, ferritin and Tf levels. c Correlation analysis of serum Cav-1 concentration and serum of total iron, hepcidin, ferritin, and Tf concentration. **P < 0.01, ***P < 0.001, as determined by Student’s t test analysis, Spearman’s rank correlation test or receiver operating characteristic curve analysis. All data were shown as the mean ± SD. AUROC area under the receiver operating characteristic curve, Cav-1 caveolin-1, Tf transferrin, NAFLD non-alcoholic fatty liver disease
Fig. 8
Fig. 8
Scheme of Cav-1 inhibiting the development of NAFLD by regulating iron metabolism. The HFD inhibited the expression of Cav-1 in hepatocytes and up-regulated the expression of Cav-1 in liver macrophages. In hepatocytes, Cav-1 regulated the FTL/FTH signaling pathway to promote the conversion of Fe2+ to Fe3+, which helped to slow down the oxidative stress induced by Fe2+ and ultimately alleviate the progression of NAFLD. In macrophages, Cav-1 regulated the expression of HO-1 in CD68+CD163+ macrophages, and promoted the degradation of red blood cells into Fe2+ within macrophages which ultimately exacerbated the disorder of iron metabolism in the liver. In addition, the concentration of ferritin and transferrin in serum was up-regulated by Cav-1, and the two were positively correlated in human subject. HFD high-fat diet, Cav-1 caveolin-1, Tf transferrin, NAFLD non-alcoholic fatty liver disease, HO-1 heme oxygenase-1, FTL ferritin light chain, FTH ferritin heavy chain, RBC red blood cell, ROS reactive oxygen species

References

    1. Asrani SK, Devarbhavi H, Eaton J, Kamath PS. Burden of liver diseases in the world. J Hepatol. 2019;70(1):151–171. doi: 10.1016/j.jhep.2018.09.014. - DOI - PubMed
    1. Moore JB. From sugar to liver fat and public health: systems biology driven studies in understanding non-alcoholic fatty liver disease pathogenesis. Proc Nutr Soc. 2019;78(3):290–304. doi: 10.1017/S0029665119000570. - DOI - PubMed
    1. Cobbina E, Akhlaghi F. Non-alcoholic fatty liver disease (NAFLD)—pathogenesis, classification, and effect on drug metabolizing enzymes and transporters. Drug Metab Rev. 2017;49(2):197–211. doi: 10.1080/03602532.2017.1293683. - DOI - PMC - PubMed
    1. Diehl AM, Day C. Cause, pathogenesis, and treatment of nonalcoholic steatohepatitis. New Engl J Med. 2017;377(21):2063–2072. doi: 10.1056/NEJMra1503519. - DOI - PubMed
    1. Sanyal AJ, Friedman SL, McCullough AJ, Dimick-Santos L, et al. Challenges and opportunities in drug and biomarker development for nonalcoholic steatohepatitis: findings and recommendations from an American Association for the Study of Liver Diseases-US Food and Drug Administration Joint Workshop. Hepatology. 2015;61(4):1392–1405. doi: 10.1002/hep.27678. - DOI - PMC - PubMed

LinkOut - more resources