. 2024 May 3;26(5):811-825.
doi: 10.1093/neuonc/noad214.

TREM2 mediates MHCII-associated CD4+ T-cell response against gliomas

Affiliations

TREM2 mediates MHCII-associated CD4+ T-cell response against gliomas

Jiaying Zheng et al. Neuro Oncol. .

Abstract

Background: Myeloid cells comprise up to 50% of the total tumor mass in glioblastoma (GBM) and have been implicated in promoting tumor progression and immunosuppression. Modulating the response of myeloid cells to the tumor has emerged as a promising new approach for cancer treatment. In this regard, we focus on the Triggering Receptor Expressed on Myeloid Cells 2 (TREM2), which has recently emerged as a novel immune modulator in peripheral tumors.

Methods: We studied the TREM2 expression profile in various patient tumor samples and conducted single-cell transcriptomic analysis in both GBM patients and the GL261 mouse glioma model. We utilized multiple mouse glioma models and employed state-of-the-art techniques such as invivo 2-photon imaging, spectrum flow cytometry, and in vitro co-culture assays to study TREM2 function in myeloid cell-mediated phagocytosis of tumor cells, antigen presentation, and response of CD4+ T cells within the tumor hemispheres.

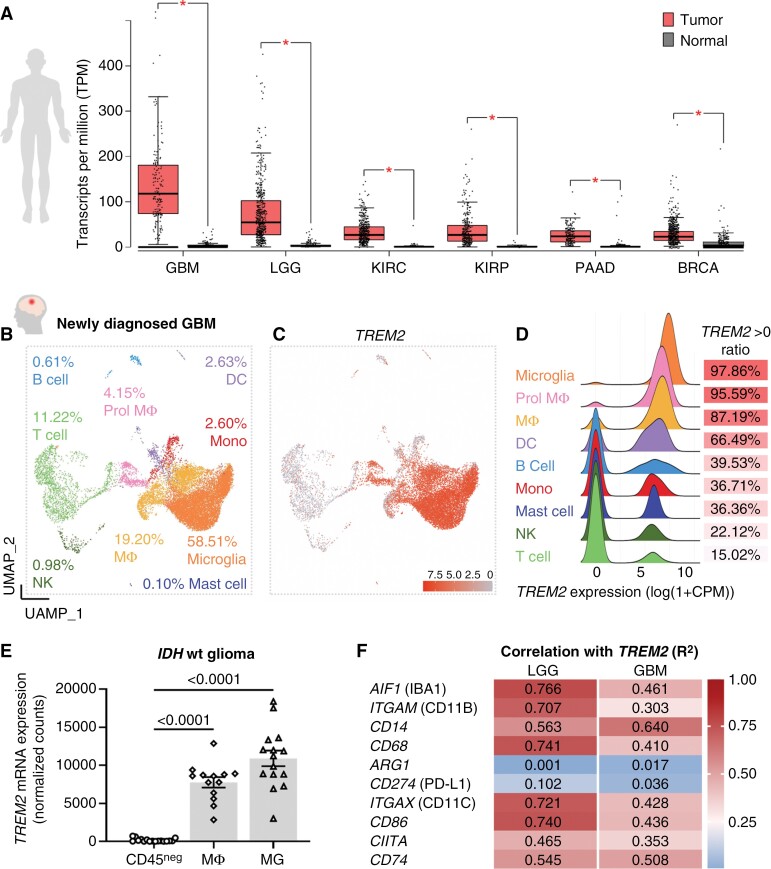
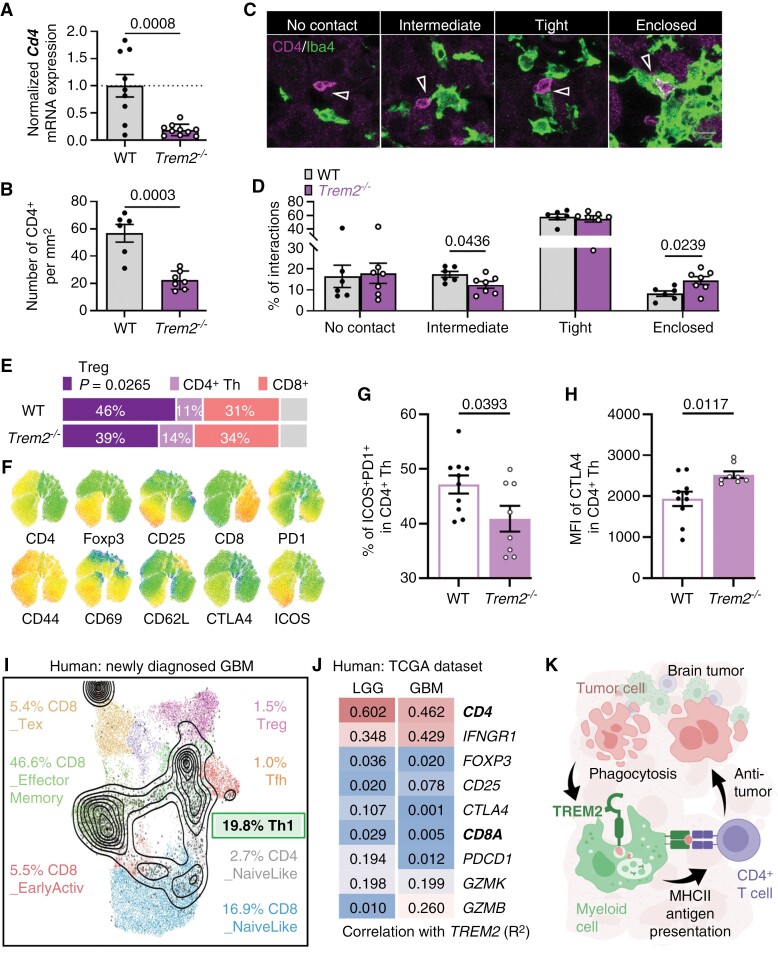
Results: Our research revealed significantly elevated levels of TREM2 expression in brain tumors compared to other types of tumors in patients. TREM2 was predominantly localized in tumor-associated myeloid cells and was highly expressed in nearly all microglia, as well as various subtypes of macrophages. Surprisingly, in preclinical glioma models, TREM2 deficiency did not confer a beneficial effect; instead, it accelerated glioma progression. Through detailed investigations, we determined that TREM2 deficiency impaired the ability of tumor-myeloid cells to phagocytose tumor cells and led to reduced expression of MHCII. This deficiency further significantly decreased the presence of CD4+ T cells within the tumor hemispheres.

Conclusions: Our study unveiled a previously unrecognized protective role of tumor-myeloid TREM2. Specifically, we found that TREM2 enhances the phagocytosis of tumor cells and promotes an immune response by facilitating MHCII-associated CD4+ T-cell responses against gliomas.

Keywords: TREM2; glioma; tumor-associated macrophages.


Conflict of interest statement

None declared.

Figures

Figure 1.
Figure 1.
Brain tumors exhibit significantly higher levels of TREM2 expression, predominantly in tumor-associated myeloid cells. (A) Top 6 types of tumors with elevated TREM2 expression in a descending order from left to right, which were glioblastoma (GBM), brain lower grade glioma (LGG), kidney renal clear cell carcinoma (KIRC), kidney renal papillary cell carcinoma (KIRP), pancreatic adenocarcinoma (PAAD), and breast cancer (BRCA). (B) UMAP plots displaying the immune cells in patients with newly diagnosed GBM. (C, D) TREM2 transcription in different immune cell populations. (E) TREM2 is not detected in brain tumor cells. The data were shown as mean ± SEM and analyzed by 1-way ANOVA. (F) The correlation between TREM2 expression and signature genes related to myeloid cell phagocytosis, immunosuppression, and antigen presentation was evaluated in LGG and GBM patients. The Spearman’s correlation test produces both P-values and correlation coefficients (R2). All listed genes had a P-value of less than 0.05. Genes with an R2 value greater than 0.25 were considered to have a correlation (either positive or negative) with TREM2 expression.
Figure 2.
Figure 2.
TREM2 deficiency does not slow mouse glioma progression. (A) A schematic illustration of establishing an immunocompetent glioma model using murine glioma GL261 cells. (B) To determine the expression of Trem2 in the GL261 cell line, CD11b+ cells were sorted from gliomas of both WT and Trem2−/− mice, serving as positive and negative controls, respectively. (C) The mRNA levels of Trem2 in the contralateral and tumor hemispheres were quantified by qRT-PCR. (D, E) Bioluminescence imaging was used to track and monitor the same mice over a period of 21 days. The statistical analysis showed that brain tumor burden was relatively higher in Trem2−/− mice compared to WT mice. (F) A larger tumor size was observed in Trem2−/− mice compared to the WT mice 21 days after tumor inoculation, as indicated by the increased weight of tumor hemisphere. (GI). The survival study using 26 WT (12 males and 14 females) and 23 Trem2−/− (9 males and 14 females) mice showed Trem2 deficiency did not confer any survival benefit in glioma. The data were shown as mean ± SEM. The data were tested for normal distribution using Shapiro–Wilk test first. P-values were acquired using 2-tailed Student t tests or 2-way ANOVA if the data were normally distributed, or Mann–Whitney test if they were not. Survival curves were analyzed using log-rank test.
Figure 3.
Figure 3.
TREM2 deficiency reduces the ability of tumor-associated myeloid cells to phagocytose tumors and exhibit MHC Class II expression. (A) UMAP plots displaying the immune cells in mice with glioma GL261. (B, C) TREM2 transcription in different immune cell populations. (D) Through in vivo 2-photon imaging, interactions between CX3CR1GFP myeloid cells and mCherry+ tumor cells were observed. Solid triangles indicate myeloid cells that uptake red tumor debris and hollow triangles indicating those that do not. Scale bar: 10 µm. (E) Immunostaining revealed a diverse mCherry signal distribution within the cytosol of tumor-associated myeloid cells, identified by the pan-myeloid marker IBA1. These observations delineated a spectrum of patterns: Cells 1 and 4 lacked discernible mCherry signals, Cell 3 showcased discrete mCherry+ puncta within the cytosol, and Cells 2 and 5 displayed a spherical morphology accompanied by condensed DAPI staining. (E’) IMARIS-generated 3D reconstruction demonstrates distinct patterns of mCherry signal in Cell 1, 2, and 3. (F) An analysis of myeloid cell dimensions and mCherry content revealed variations in the occurrence of mCherry signals across different sizes of myeloid cells. Each tumor mouse contributed 15 cells, and each group consisted of 5 mice. The distribution is depicted in the violin plot, highlighting that the absence of TREM2 in myeloid cells led to a reduction in the presence of mCherry signals. (G, G’) Measurement of the MFI of mCherry+ tumor debris signal in F4/80+MHCII+ macrophages. The percentage of tumor debris signal in F4/80+MHCII+ macrophages was reduced in Trem2−/−. (H, I) The mRNA levels of Cd68 and H2Aa (encoding MHC Class II) in the endpoint tumor hemispheres were collected and quantified by qRT-PCR. The bar graphs were shown as mean ± SEM. The data were tested for normal distribution using Shapiro–Wilk test first. P-values were acquired using 2-tailed Student t tests if the data were normally distributed, or Mann–Whitney test if they were not.
Figure 4.
Figure 4.
TREM2 is necessary for accumulation of CD4+ T cells in brain tumors. (A) Quantification of CD4 mRNA levels in tumor hemispheres using qRT-PCR. (B) Quantification of the number of CD4+ T cells per mm2 in the tumor core using confocal microscopy on 5 µm thick brain slides. (C) Representative images of CD4+ T cell and myeloid cell (Iba1+) interactions. Scale bar: 10 µm. (D). Quantifications of different types of CD4+-myeloid cell interactions in WT and Trem2−/−. (E). The percentage of each CD3+ T cell subset in WT and Trem2−/− mice. Unidentified populations are indicated in gray. (F) Expression levels of T cell cluster markers and feature genes indicating T cell activation or immunosuppression. (G). The proportion of a CD4+ Th cell subset co-expressing PD-1 and ICOS is greater in WT mice compared to Trem2−/− mice. (H) The MFI of CTLA expression in CD4+ Th cells was higher in Trem2−/− compared to the WT. The bar graphs were shown as mean ± SEM. The data were tested for normal distribution using Shapiro–Wilk test first. P-values were acquired using 2-tailed Student t tests if the data were normally distributed, or Mann–Whitney test if they were not. (I) Projection of T cells from newly diagnosed GBM using the ProjecTIL package to reveal T-cell subsets. (J) Correlation between TREM2 expression and marker genes of T cell subtypes in LGG and GBM patients. All listed genes, except for CTLA4, had a P-value less than 0.05. (K) Our working model proposes that TREM2-mediated phagocytosis of glioma debris by myeloid cells leads to further MHC Class II presentation to CD4+ T cells, ultimately contributing to antitumor immunity in brain tumors.

Update of

Comment in

References

    1. Alspach E, Lussier DM, Miceli AP, et al.. MHC-II neoantigens shape tumour immunity and response to immunotherapy. Nature. 2019;574(7780):696–701. - PMC - PubMed
    1. Oh J, Magnuson A, Benoist C, Pittet MJ, Weissleder R.. Age-related tumor growth in mice is related to integrin alpha 4 in CD8+ T cells. JCI Insight. 2018;3(21):e122961. - PMC - PubMed
    1. Molgora M, Esaulova E, Vermi W, et al.. TREM2 modulation remodels the tumor myeloid landscape enhancing anti-PD-1 immunotherapy. Cell. 2020;182(4):886–900.e17. - PMC - PubMed
    1. Binnewies M, Pollack JL, Rudolph J, et al.. Targeting TREM2 on tumor-associated macrophages enhances immunotherapy. Cell Rep. 2021;37(3):109844. - PubMed
    1. Chen D, Varanasi SK, Hara T, et al.. CTLA-4 blockade induces CD4(+) T cell IFNgamma-driven microglial phagocytosis and anti-tumor function in glioblastoma. Immunity. 2023;56(9):2086.e8–2104.e8. - PMC - PubMed

Publication types