. 2024 Jul 27;73(2):247-262.
doi: 10.1093/sysbio/syad066.

Convergent Adaptation of True Crabs (Decapoda: Brachyura) to a Gradient of Terrestrial Environments

Affiliations

Convergent Adaptation of True Crabs (Decapoda: Brachyura) to a Gradient of Terrestrial Environments

Joanna M Wolfe et al. Syst Biol. .

Abstract

For much of terrestrial biodiversity, the evolutionary pathways of adaptation from marine ancestors are poorly understood and have usually been viewed as a binary trait. True crabs, the decapod crustacean infraorder Brachyura, comprise over 7600 species representing a striking diversity of morphology and ecology, including repeated adaptation to non-marine habitats. Here, we reconstruct the evolutionary history of Brachyura using new and published sequences of 10 genes for 344 tips spanning 88 of 109 brachyuran families. Using 36 newly vetted fossil calibrations, we infer that brachyurans most likely diverged in the Triassic, with family-level splits in the late Cretaceous and early Paleogene. By contrast, the root age is underestimated with automated sampling of 328 fossil occurrences explicitly incorporated into the tree prior, suggesting such models are a poor fit under heterogeneous fossil preservation. We apply recently defined trait-by-environment associations to classify a gradient of transitions from marine to terrestrial lifestyles. We estimate that crabs left the marine environment at least 7 and up to 17 times convergently, and returned to the sea from non-marine environments at least twice. Although the most highly terrestrial- and many freshwater-adapted crabs are concentrated in Thoracotremata, Bayesian threshold models of ancestral state reconstruction fail to identify shifts to higher terrestrial grades due to the degree of underlying change required. Lineages throughout our tree inhabit intertidal and marginal marine environments, corroborating the inference that the early stages of terrestrial adaptation have a lower threshold to evolve. Our framework and extensive new fossil and natural history datasets will enable future comparisons of non-marine adaptation at the morphological and molecular level. Crabs provide an important window into the early processes of adaptation to novel environments, and different degrees of evolutionary constraint that might help predict these pathways. [Brachyura; convergent evolution; crustaceans; divergence times; fossil calibration; molecular phylogeny; terrestrialization; threshold model.].


Figures

Figure 1.
Figure 1.
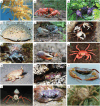
Representative brachyurans displaying different lifestyles and grades of terrestriality. a–e) Fully marine lifestyle, grade 0; f–j) direct marine transition pathway, grades 1–5 bottom to top; k–o) indirect freshwater transition pathway, grades 1–5 bottom to top. a) Portunidae: Portunus sayi (Bermuda); b) Calappidae: Calappa calappa (Kwajalein Atoll, Marshall Islands); c) Epialtidae: Cyclocoeloma tuberculatum (Anilao, Philippines); d) Raninidae: Ranina ranina (Oahu, Hawaii, USA); e) Homolidae: Paromola cuvieri (Gorringe Ridge, Portugal); f) Gecarcinidae: Gecarcoidea natalis (Christmas Island, Australia); g) Gecarcinidae: Cardisoma guanhumi (Fort Lauderdale, Florida, USA); (h) Ocypodidae: Uca heteropleura (Pacific coast, Panama); i) Grapsidae: Leptograpsus variegatus (Tasmania, Australia); j) Eriphiidae: Eriphia sebana (Heron Island, Queensland, Australia); k) Sesarmidae: Geosesarma dennerle (aquarium specimen); l) Deckeniidae: Madagapotamon humberti (Montagne de Français Reserve, Madagascar); m) Gecarcinucidae: Ghatiana botti (Sindhudurg, India); n) Pseudothelphusidae indet. (Santander, Colombia); o) Hymenosomatidae: Hymenosoma orbiculare (Langebaan Lagoon, South Africa). Photo credits: a) Jessica Riederer; b,c) Jeanette and Scott Johnson; d) John Hoover; e) © OCEANA; f) John Tann, license CC-BY; g) Tom Friedel, license CC-BY 3.0; h) Kecia Kerr and Javier Luque; i) Joanna Wolfe; j,n) Javier Luque; k) Henry Wong; l) Sara Ruane; m) Tejas Thackeray; o) Charles Griffiths.
Figure 2.
Figure 2.
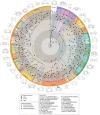
Summary of phylogeny and divergence time estimates for Brachyura (88 brachyuran families, 263 genera, 333 species, 338 individuals plus 6 outgroups). Posterior ages were estimated in BEAST2 using a fixed topology resulting from the concatenated ML analysis in IQ-TREE, 36 vetted node calibrations, a birth–death tree prior, and relaxed lognormal clock model. Shaded circles at nodes represent ultrafast bootstraps. Pie slices are colored by superfamily, with the outermost ring colored by taxonomic section. Line drawings, one representative per superfamily (numbers corresponding to taxa in Supplementary Table S7), by Javier Luque and Harrison Mancke.
Figure 3.
Figure 3.
Sensitivity of divergence time estimates to inference strategy plotted with chronospace, with outgroup taxa removed from these analyses. a) Between-group principal component analysis (bgPCA) separating chronograms by calibration strategy and b) by clock model (note: analyses with the random local clock model did not converge, so individual chains are sampled here with 50% burnin). c) Theoretical topologies representing change in branch lengths from the mean along the major bgPCA axis, discriminating based on calibration strategy. Negative extreme (−1 SD branch length) above, positive extreme (+1 SD) below.
Figure 4.
Figure 4.
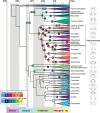
Composite of ancestral state reconstructions for the 2 transition pathways under best-fitting OU models in ancThresh, with fully marine clades (all families that are not labeled) reduced for clarity and outgroups removed. Legend for grades and colors representing each pathway at bottom left: fully marine crabs (grade 0), lower intertidal and estuaries (grade 1), upper intertidal and freshwater (grade 2), beaches and riverbanks (grade 3), and coastal forests and jungles (grades 4–5). Pies at nodes represent the estimated ancestral state with the outer ring indicating the pathway (at some nodes, both pathways are shown; when node is inferred marine, no pie is shown). Tip codings are based on estimates by family (Supplementary Table S6), with the collapsed clades showing the color that represents the largest slice of their prior probabilities (split in the case of equal probabilities for 2 grades). For clades that have a small number of taxa in a grade from the opposite pathway, a small triangle is added. Line drawings at right (numbers corresponding to taxa in Supplementary Table S7), by Javier Luque and Harrison Mancke.

References

    1. Ahyong S.T., Lai J.C.Y., Sharkey D., Colgan D.J., Ng P.K.L. 2007. Phylogenetics of the brachyuran crabs (Crustacea: Decapoda): the status of Podotremata based on small subunit nuclear ribosomal RNA. Mol. Phylogenet. Evol. 45:576–586. - PubMed
    1. Ballesteros J.A., Santibáñez-López C.E., Baker C.M., Benavides L.R., Cunha T.J., Gainett G., Ontano A.Z., Setton E.V.W., Arango C.P., Gavish-Regev E., Harvey M.S., Wheeler W.C., Hormiga G., Giribet G., Sharma P.P. 2022. Comprehensive species sampling and sophisticated algorithmic approaches refute the monophyly of Arachnida. Mol. Biol. Evol. 39:msac021. - PMC - PubMed
    1. Bapst D.W., Wright A.M., Matzke N.J., Lloyd G.T. 2016. Topology, divergence dates, and macroevolutionary inferences vary between different tip-dating approaches applied to fossil theropods (Dinosauria). Biol. Lett. 12:20160237. - PMC - PubMed
    1. Barido-Sottani J., Aguirre-Fernández G., Hopkins M.J., Stadler T., Warnock R.C. 2019. Ignoring stratigraphic age uncertainty leads to erroneous estimates of species divergence times under the fossilized birth-death process. Proc. Biol. Sci. 286:20190685. - PMC - PubMed
    1. Barido-Sottani J., Pohle A., De Baets K., Murdock D., Warnock R.C.M. 2023. Putting the F in FBD analyses: tree constraints or morphological data? Palaeontology. e12679.