. 2024 Mar;59(6):1242-1259.
doi: 10.1111/ejn.16180. Epub 2023 Nov 8.

Inhibition of striatal dopamine release by the L-type calcium channel inhibitor isradipine co-varies with risk factors for Parkinson's

Affiliations

Inhibition of striatal dopamine release by the L-type calcium channel inhibitor isradipine co-varies with risk factors for Parkinson's

Katherine R Brimblecombe et al. Eur J Neurosci. 2024 Mar.

Abstract

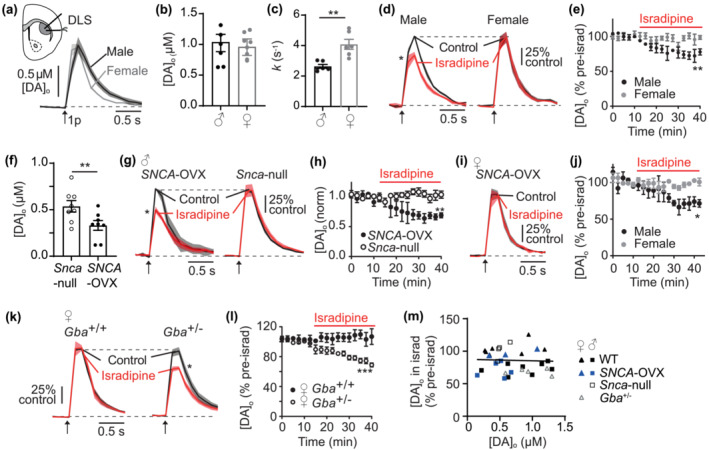
Ca2+ entry into nigrostriatal dopamine (DA) neurons and axons via L-type voltage-gated Ca2+ channels (LTCCs) contributes, respectively, to pacemaker activity and DA release and has long been thought to contribute to vulnerability to degeneration in Parkinson's disease. LTCC function is greater in DA axons and neurons from substantia nigra pars compacta than from ventral tegmental area, but this is not explained by channel expression level. We tested the hypothesis that LTCC control of DA release is governed rather by local mechanisms, focussing on candidate biological factors known to operate differently between types of DA neurons and/or be associated with their differing vulnerability to parkinsonism, including biological sex, α-synuclein, DA transporters (DATs) and calbindin-D28k (Calb1). We detected evoked DA release ex vivo in mouse striatal slices using fast-scan cyclic voltammetry and assessed LTCC support of DA release by detecting the inhibition of DA release by the LTCC inhibitors isradipine or CP8. Using genetic knockouts or pharmacological manipulations, we identified that striatal LTCC support of DA release depended on multiple intersecting factors, in a regionally and sexually divergent manner. LTCC function was promoted by factors associated with Parkinsonian risk, including male sex, α-synuclein, DAT and a dorsolateral co-ordinate, but limited by factors associated with protection, that is, female sex, glucocerebrosidase activity, Calb1 and ventromedial co-ordinate. Together, these data show that LTCC function in DA axons and isradipine effect are locally governed and suggest they vary in a manner that in turn might impact on, or reflect, the cellular stress that leads to parkinsonian degeneration.

Keywords: Calb1; L‐type calcium channel; Parkinson's disease; dopamine D2 receptor; dopamine release; dopamine transporter; sex differences; striatum; synuclein.


Conflict of interest statement

The authors have no conflicts of interest to disclose.

Figures

FIGURE 1
FIGURE 1
Male sex, presence of α‐synuclein and knockdown of Gba promote LTCC support of DA release in DLS. (a) Mean [DA]o ± SEM versus time evoked by a single pulse (1p, arrow) in DLS of male (black) versus female (grey) wild‐type mice. (b) Summary of mean peak evoked [DA]o ± SEM, N = 6 mice per sex. (c) Decay constants of falling phases of mean 1p‐evoked DA transients in DLS. N = 6 mice per sex. (d) Mean transients for [DA]o ± SEM versus time evoked by 1p (arrow) in control conditions (black) versus isradipine (5 μM, red) in male (left) and female (right) normalised to own control. (e) Peak [DA]o ± SEM as % of pre‐isradipine control levels versus time. N = 3 male, 5 female. (f) Summary of peak [DA]o evoked by 1p in DLS from male SNCA‐OVX vs Snca‐null mice. N = 8 mice. (g) Mean [DA]o ± SEM versus time evoked by 1p (arrow) in control versus isradipine in SNCA‐OVX (left) and Snca‐null (right), normalised to control. (h) Peak [DA]o ± SEM as % of pre‐isradipine control levels versus time. N = 4 mice. (i) Mean [DA]o ± SEM versus time evoked by 1p (arrow) in control and isradipine in female SNCA‐OVX mice, normalised to control. N = 3 mice. (j) Peak [DA]o ± SEM as % of pre‐isradipine control levels versus time of female vs male SNCA‐OVX mice. (k) Mean [DA]o ± SEM versus time evoked by 1p (arrow) in DLS in control and isradipine in female wild‐type (Gba +/+) versus Gba‐het (Gba +/−) mice, normalised to control. (l) Peak [DA]o ± SEM as % of pre‐isradipine control levels versus time for female Gba +/+ (N = 3) versus Gba +/− mice (N = 5). (m) Peak [DA]o in isradipine (as % of pre‐isradipine control levels) versus peak [DA]o (μM) in pre‐isradipine control conditions plotted for all data shown in conditions in A‐L. Male = squares; female = triangles; genotypes indicated by colour. *<.05, **<.01, ***<.001.
FIGURE 2
FIGURE 2
Calb1 limits LTCC function in NAc in male mice, and in DLS in female mice. (a, b) Mean [DA]o ± SEM versus time evoked by single pulses (1p, arrow) in control and isradipine (5 μM, red) in (a) CalbWT mice or (b) CalbKD mice, in male DLS (left), male NAc (centre), and female DLS (right) normalised to their own control conditions. ** P < .01 comparison of peak [DA]o. (c) Summary of peak [DA]o remaining after isradipine (% of pre‐isradipine control) in CalbWT and CalbKD striatum. ** P < .01 effect of genotype 2‐way ANOVA. N = 3 pairs DLS male and female N = 4 NAc. (d) Representative examples of Western blots for three males and three females showing actin (42 kDa) and Calb1 (25 kDa). (e) Calbindin‐D28K/β‐actin protein ratios in male and female striatum. Mean ± SEM; colours group technical replicates (i.e., blue points correspond to blot shown in c and are samples from which stats correspond to, N = 3 brains, repeated for three blots, illustrated by red, green and blue).
FIGURE 3
FIGURE 3
LTCC support of DA release is facilitated by DATs. (a) Mean [DA]o ± SEM versus time evoked by single pulses (1p, arrow) in male mice in DLS in control versus isradipine (5 μM, red) alone (left), or in the presence of cocaine (centre), or nomifensine (right). (b) Peak [DA]o ± SEM (normalised to pre‐isradipine level) versus time in control (black), cocaine (unfilled) or nomifensine (grey unfilled). (c) Summary of peak [DA]o remaining after isradipine (% of pre‐isradipine control) in DLS of male mice in control (Ctrl) N = 3, lidocaine (Lido) N = 3, cocaine (Coc) N = 5 or nomifensine (Nom) N = 5. (d) Mean [DA]o ± SEM versus time evoked by 1p (arrow) in DLS in control versus isradipine in SNCA‐null tissue incubated in cholesterol alone (left) versus with cocaine (right). (e) Summary of peak [DA]o remaining after isradipine (% of pre‐isradipine control) in DLS of male Snca‐null mice in control N = 4, cholesterol incubation N = 4 or cholesterol incubation + cocaine. N = 4. (f) Mean [DA]o ± SEM versus time evoked by 1p (arrow) in control and CP8 (10 μM, yellow) in DLS in control conditions (left), in DLS in the prior presence of cocaine (centre) or in NAc in control conditions (right). (g) Peak [DA]o ± SEM (normalised to pre‐CP8 level) versus time in DLS in control (black) versus cocaine (unfilled), N = 4. *P < .05, ** P < .01.
FIGURE 4
FIGURE 4
LTCC support of DA release is silenced by D2R. (a, c) Mean [DA]o ± SEM versus time evoked by single pulses (1p, arrow) in wild‐type male mice in DLS (a) or NAc (c) in control versus isradipine (5 μM, red) alone (left) or in the presence of D2R‐antagonist L‐741,626 (2 μM, right). (b, d) Peak [DA]o ± SEM (normalised to pre‐isradipine level) versus time in control (black) or L‐741,626 (blue) in DLS (B) or NAc (D). (e) Summary of peak [DA]o remaining after isradipine (% of pre‐isradipine control), in NAc and CPu without (red) or with L‐741 (blue) (N = 4). (F) Mean [DA]o ± SEM versus time evoked by 1p (arrow) in DLS in the presence of cocaine + L‐741,626 (blue dashed) alone, or with isradipine (red). (g) Mean [DA]o ± SEM versus time evoked by 1p (arrow) in NAc from CalbKD mice with and without isradipine in the prior presence of either L‐741,626 (left) or cocaine (right). (h) Peak [DA]o ± SEM (% of pre‐isradipine level) versus time during isradipine application in NAc from CalbKD mice in control conditions (black), or the presence of L‐741,626 (blue), or cocaine (unfilled). (i) Summary of peak [DA]o remaining after isradipine (% of pre‐isradipine control) in NAc in CalbWT (N = 3) or CalbKD mice, N = 4 with L‐741 (N = 3) or cocaine (N = 3). *P < .05, ** P < .01.
FIGURE 5
FIGURE 5
Segregation of factors to facilitators or attenuators of LTCC support of DA release. (a) Decision tree segregating experimental conditions of sex, genotype and drug condition using the Gini index. Blue to green background shading shows predictive power of a FALSE (blue) or TRUE (green) outcome, respectively. White area shows high uncertainty. Labels on branches indicate recording condition. Left branches for ‘isradipine decreases DA release’ are FALSE. Labels on final boxes (leaves) indicate outcome: TRUE/FALSE (top), probability of outcome being correct, that is, 0 or 1, indicate all data from that branch has been correctly sorted (middle) and % of datapoints contained within each leaf (bottom). *Cocaine is the presence of cholesterol or L‐741,626. (b) Cartoon illustrating which endogenous factors limit (downward arrows) or promote (upward arrows) LTCC support of DA release.

References

    1. Abel, J. L. , & Rissman, E. F. (2012). Location, location, location: Genetic regulation of neural sex differences. Reviews in Endocrine & Metabolic Disorders, 13, 151–161. 10.1007/s11154-011-9186-0 - DOI - PMC - PubMed
    1. Acevedo‐Rodriguez, A. , Zhang, L. , Zhou, F. , Gong, S. , Gu, H. , de Biasi, M. , Zhou, F.‐M. , & Dani, J. A. (2014). Cocaine inhibition of nicotinic acetylcholine receptors influences dopamine release. Front Synaptic Neurosci, 6, 19. 10.3389/fnsyn.2014.00019 - DOI - PMC - PubMed
    1. Airaksinen, M. S. , Thoenen, H. , & Meyer, M. (1997). Vulnerability of midbrain dopaminergic neurons in Calbindin‐D 28k ‐deficient mice: Lack of evidence for a neuroprotective role of endogenous Calbindin in MPTPtreated and weaver mice. The European Journal of Neuroscience, 9, 120–127. 10.1111/j.1460-9568.1997.tb01360.x - DOI - PubMed
    1. Alegre‐Abarrategui, J. , Brimblecombe, K. R. , Roberts, R. F. , Velentza‐Almpani, E. , Tilley, B. S. , Bengoa‐Vergniory, N. , & Proukakis, C. (2019). Selective vulnerability in α‐synucleinopathies. Acta Neuropathologica, 138, 681–704. 10.1007/s00401-019-02010-2 - DOI - PMC - PubMed
    1. Alix, J. J. P. , Dolphin, A. C. , & Fern, R. (2008). Vesicular apparatus, including functional calcium channels, are present in developing rodent optic nerve axons and are required for normal node of Ranvier formation. The Journal of Physiology, 586, 4069–4089. 10.1113/jphysiol.2008.155077 - DOI - PMC - PubMed