Multicenter Study
. 2023 Oct 23:14:1261070.
doi: 10.3389/fimmu.2023.1261070. eCollection 2023.

Characterization and root cause analysis of immunogenicity to pasotuxizumab (AMG 212), a prostate-specific membrane antigen-targeting bispecific T-cell engager therapy

Affiliations
Multicenter Study

Characterization and root cause analysis of immunogenicity to pasotuxizumab (AMG 212), a prostate-specific membrane antigen-targeting bispecific T-cell engager therapy

Hweixian Leong Penny et al. Front Immunol. .

Abstract

Introduction: In oncology, anti-drug antibody (ADA) development that significantly curtails response durability has not historically risen to a level of concern. The relevance and attention ascribed to ADAs in oncology clinical studies have therefore been limited, and the extant literature on this subject scarce. In recent years, T cell engagers have gained preeminence within the prolific field of cancer immunotherapy. These drugs whose mode of action is expected to potently stimulate anti-tumor immunity, may potentially induce ADAs as an unintended corollary due to an overall augmentation of the immune response. ADA formation is therefore emerging as an important determinant in the successful clinical development of such biologics.

Methods: Here we describe the immunogenicity and its impact observed to pasotuxizumab (AMG 212), a prostate-specific membrane antigen (PSMA)-targeting bispecific T cell engager (BiTE®) molecule in NCT01723475, a first-in-human (FIH), multicenter, dose-escalation study in patients with metastatic castration-resistant prostate cancer (mCRPC). To explain the disparity in ADA incidence observed between the SC and CIV arms of the study, we interrogated other patient and product-specific factors that may have explained the difference beyond the route of administration.

Results: Treatment-emergent ADAs (TE-ADA) developed in all subjects treated with at least 1 cycle of AMG 212 in the subcutaneous (SC) arm. These ADAs were neutralizing and resulted in profound exposure loss that was associated with contemporaneous reversal of initial Prostate Surface Antigen (PSA) responses, curtailing durability of PSA response in patients. Pivoting from SC to a continuous intravenous (CIV) administration route remarkably yielded no subjects developing ADA to AMG 212. Through a series of stepwise functional assays, our investigation revealed that alongside a more historically immunogenic route of administration, non-tolerant T cell epitopes within the AMG 212 amino acid sequence were likely driving the high-titer, sustained ADA response observed in the SC arm.

Discussion: These mechanistic insights into the AMG 212 ADA response underscore the importance of performing preclinical immunogenicity risk evaluation as well as advocate for continuous iteration to better our biologics.

Keywords: ADA; BiTE®; T cell engager; immunogenicity; prostate cancer.


Conflict of interest statement

All authors, except for NT, SW-R, GK, RB, H-DH, WL, CG, and BT, were/are employees of Amgen during the time this study and associated analyses were being conducted. SW-R and GK are employees of Bayer AG. Author WL was employed by Ordensklinikum Linz GmbH. RB is a patent holder for blinatumomab, from which he receives royalty payments, and has consulted for and received honoraria from Amgen, Cellex and Gemoab. H-DH has received travel, accommodations or other expenses from Johnson & Johnson, Boehringer Ingelheim, Amgen Inc. and Bristol Myers Squibb. WL has received honoraria from Accord and Novartis. BT has received a grant, consulting fees, and honoraria from Amgen Inc. NT was an employee of Labcorp Translational Biomarker Solutions at the time of this study and has no conflicts to disclose. The remaining authors declare that the research was conducted in the absence of any commercial or financial relationships that could be construed as a potential conflict of interest. The authors declare that this study received funding from Bayer and Amgen. The funders were involved in the study design, collection, analysis, interpretation of results, the writing of this article and the decision to submit it for publication.

Figures

Figure 1
Figure 1
Binding ADA onset and maximum ADA titer in the SC arm of the AMG 212 first-in-human study. At appropriate timepoints, patient serum samples were collected and screened for binding antibodies to AMG 212 using a fully validated, electrochemiluminescence-based antibody assay. 30 of the 31 subjects enrolled in the SC arm completed at least 1 cycle of AMG 212 SC dosing. All 30 subjects developed binding ADA and are shown in the scatter plots (A, B). Each circle represents a single subject. Each row represents individual cohorts, starting from Cohort 1 (bottom, 0.5 µg/d) to Cohort 10 (top, 172 µg/d + topical glucocorticoid (GC) treatment at the SC injection sites). Subjects were enrolled in single-subject cohorts for the first 3 cohorts and in multiple-subject cohorts thereafter. The scatter plot in (A) shows the range of binding ADA onset in each cohort, plotted as cycle number, day number (CXDX) upon initiation of AMG 212 dosing. FU refers to the 30-day follow-up period after the end of treatment. Error bars depict the mean and standard error of mean (SEM) of the binding ADA onset within each cohort. The red dotted line at Cycle 2 Day 1 (or Day 22) represents the median binding ADA onset across the dose escalation phase in the AMG 212 SC arm. The scatter plot in (B) shows the range of maximum ADA titer in each cohort, plotted as the reciprocal of the maximum ADA titer registered by each subject at any time on study. Error bars depict the mean and SEM of the maximum ADA titer reciprocal within each cohort. The red dotted line at titer reciprocal 218700 represents the median maximum ADA titer across the dose escalation phase in the AMG 212 SC arm.
Figure 2
Figure 2
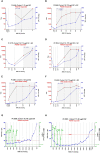
PK, ADA and PSA profiles from select individual subjects in the AMG 212 SC and CIV arm showing temporal correlation between these 3 parameters. The temporal relationship between pharmacokinetics (PK, as represented by drug concentration), ADA magnitude (as represented by titer) and a pharmacodynamic marker of biochemical disease progression (as represented by Prostate Surface Antigen (PSA)), are plotted in line graphs (A–H). CXDX refers to the cycle number and day number upon initiation of AMG 212 dosing. “EOT” refers to End-of-Treatment. FU refers to the 30-day follow-up period after the end of treatment. (A–F) show the profiles of six subjects from the SC arm, which include four PSA 50 responders (A–D) and two PSA stable subjects (E, F). (G, H) show the profiles of two subjects from the CIV arm who were both PSA 50 responders. In the SC arm, AMG 212 PK was not consistently detectable among subjects in the same cohort until Cohort 7, the 72 µg/d dose level. At Cohort 7 and onwards, while PK was detectable initially, the onset of ADAs correlated with an impact to PK, whereby PK fell to below the lower limit of quantitation (LLOQ). The time period at which PK measured <LLOQ is depicted by a gray shaded area on the graphs (A–F). In the CIV arm, ADAs did not develop in all treated subjects, and PK was detectable in all cohorts (no gray shaded areas in (G, H)). In (A–F), ADA titer is shown on the left y-axis, and PSA on the right y-axis. In G-H, PSA is shown on the left y-axis and PK on the right y-axis. In (G, H) the PK trace stops at Cycle 8 Day 8 for both Subject 3506 and Subject 2557, as that was the last PK timepoint collected for these patients on study. The legend for the line graphs is as follows - PK: green triangles formula image, ADA-positive status: red circles formula image, PSA: blue circles formula image; green dotted line at 0.15 ng/ml is the LLOQ of the PK assay; red dotted line represents the PSA value at which 50% reduction from baseline was observed.
Figure 3
Figure 3
Topical glucocorticoid (GC) treatment at AMG 212 SC injection sites implemented at the 144 and 172 µg/d dose levels. To mitigate the ADA observed during dose escalation, a daily topical GC treatment of SC injection sites for the first 3 cycles was introduced mid-study, with the goal of suppressing skin antigen presenting cell (APC) function. The above schema provided instructions on administering the topical GC in patients who injected AMG 212 at 4 regions around the navel. On Cycle 1, Day minus 7 to Cycle 1 Day minus 1, i.e. 1 week to 1 day prior to start of AMG 212, subjects applied a hazelnut-sized amount of clobetasol propionate 0.05% cream in a uniform layer on each of 2 abdominal skin areas for a 7-day daily topical administration. Upon initiation of the AMG 212 SC daily dosing cycle, from Cycle 1 Day 1 to Cycle 1 Day 21, subjects continued applying daily topical GC on the same 2 marked skin areas where SC injections were performed, with methylprednisolone aceponate 0.1% cream. The AMG 212 SC injection was always performed before the administration of the topical GC on the same day. This “7-day clobetasol premedication, 21-day methylprednisolone concomitant medication” topical GC regimen was repeated for Cycle 2 and Cycle 3, on 2 other abdominal skin areas distinct from the injection sites of the previous cycle. A subject stopped administration of topical GC if a local reaction related to the AMG 212 SC injections or a Grade ≥2 local or systemic reaction related to GC treatment occurred. Further daily injections were then performed outside the marked skin areas selected for the ongoing cycle.
Figure 4
Figure 4
Flow cytometric analysis of CD14+ monocyte and CD4+ T cell activation between SC and CIV arms of AMG 212. MHC class II upregulation on CD14+ monocytes, as evaluated by HLA-DR+ counts and HLA-DRhi median fluorescence intensity (MFI) (A, B), and the activation status of CD4+ T cells, as evaluated by CD69+ counts and CD69+ cells as a percentage of CD4+ T cells (C, D), were assessed by flow cytometry in peripheral blood at the time of screening (7 days before cycle 1 day 1). ADA+ subjects in the SC arm were further sub-grouped into those who had a maximum ADA titer corresponding to more than (high titer) or less than (low titer) of 1: 10, 000 at any time on study (E, F). Peripheral CD4+ T cell activation status between the SC and CIV arms was analyzed at predose timepoints through the first cycle (on day 1, 8, 15) and on cycle 2 day 1 (G). Each circle represents an individual subject. Unpaired t tests were used to compare between the SC and CIV subjects. n.s. is not significant. *p-value < 0.05.
Figure 5
Figure 5
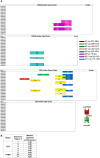
MHC class II-associated peptide proteomics (MAPPS) assay identified sequences within full-length AMG 212 that were naturally processed and presented on the APC surface for presentation to T cells. Immature DCs were loaded with AMG 212 to allow for capture, processing and formation of peptide major histocompatibility complex (pMHC) complexes. Cells were harvested and lysed to immunoprecipitate the pMHC complexes from the DC surface. Peptides were eluted off the presenting MHC class II molecules, and their sequences identified by mass spectrometry, allowing for precise location mapping onto the full-length sequence. (A) This sequence map depicts the full-length AMG 212 sequence, divided into four sub-sections: the PSMA binder, heavy and light chains (top half; top two sub-sections) and the CD3 binder, heavy and light chains (bottom half; bottom two sub-sections). Each row within each sub-section represents a single donor. The different color bars mapped onto each of the rows denote the location and length of the distinct sequence regions #1-5, #8, 8.5 and 11. These sequences ranged from 14 – 20 amino acids long and their amino acid (aa) residue numbers (start and end) are shown alongside their respective bars in the legend. The overlap between sequence region #8 and #8.5, #4 and 5, are depicted by a dotted border. Several donors presented multiple peptides within the same sequence region, but a single color bar is shown to account for all sequences within that region that were detected from that donor. A schematic of the overall structure of AMG 212 is shown next to the sequence maps for reference. VH and VL refer to the single chain variable heavy and single chain variable light regions of the antibody construct respectively. MAPPS was performed on AMG 212 twice, evaluating a total of 20 donors that included a variety of HLA-DRB alleles representing the major subtypes in the human population. The table in (B) shows the aggregate number of donors that presented each sequence region as an incidence of the 20 donors utilized in the MAPPS assays. The HLA allele subtypes of these 20 donors are found in Supplementary Table 1 .
Figure 6
Figure 6
Restimulated T cell line assay on healthy donor PBMCs. A schema of the restimulated T cell assay is shown in (A). To simulate an antigen-experienced memory response, isolated CD4+ T cells were stimulated with multiple rounds of autologous monocyte-derived DCs (moDCs) pulsed with our suspect peptides in a 4-week co-culture. In the week prior to each stimulation, CD14+ cells were isolated from healthy donor PBMC, differentiated into immature DCs with IL-4 and GM-CSF, then separately loaded with 5 µg/mL CEFTA peptide pool or 5 µM PADRE peptide (positive controls), or 5 µM of Peptide Pool #1 or #2 (test peptides) and matured with TNF-α and IL-1β for 48 hours. On Day 7, autologous CD4+ T cells were isolated and seeded at 2 X 10⁵/well and stimulated with peptide-loaded DC weekly for the next 21 days. Freshly-loaded and matured DCs were added to the T cell culture every 7 days, and the culture medium was refreshed every 7 days with IL-2 and IL-7. On Day 21, a fraction (4-5 X 10⁴) of CD4+ T cells were removed from each well and stimulated with peptide pool-loaded DCs in pre-coated Human Interferon-γ ELISPOT plates, visualized and counted for spots after a 48 hr incubation. On Day 28, peptide pool-specific T cell lines identified from ELISPOT #1 were then fractionated and stimulated with individual peptide-loaded DCs in pre-coated Human Interferon-γ ELISPOT plates, visualized and counted for spots 48 hr later as before. The table in (B) shows the aggregate incidence of individual peptide reactivity among the 10 donors tested, after performing this assay 3 times. The bar graphs in (C) show the individual peptide reactivity profile (as determined by ELISPOT #2) of Donor 8945 and Donor 6445. A T cell line was deemed reactive to an individual peptide if the spot counts were 2-fold higher than unloaded DC controls, with a minimal difference of 30 spots (above the cut-off value). The red dotted line represents the cut-off value in each plot for that T cell line, which may be different between wells based on the unloaded DC control. Reactive peptides are denoted with a red asterix *. The HLA allele subtypes of the 10 donors used in this assay are found in Supplementary Table 2 .
Figure 7
Figure 7
Clinical memory recall assay on patient PBMCs obtained at EOT from the AMG 160 FIH trial. Regardless of ADA status, 10 ml of whole blood was collected at the end of treatment (EOT) timepoint from patients enrolled in the AMG 160 First-in-Human (FIH) trial, Study 20180101. Whole blood was sent ambient to the central lab for same-day processing into PBMCs and stored frozen. Freshly thawed patient PBMCs were plated at 2 X 10⁵ cells per well, pulsed with individual peptides at 5 µM for 72 hr, and evaluated for a recall response via IFNγ ELISPOT. 10 ng/ml of GM-CSF was provided in the culture. Peptides # 1, 2, 8, 8.5 and 11 were experimental “suspect” sequences. Peptides #13 and #4 were negative control sequences that did not confer T cell reactivity, which we established previously from the restimulated T cell line assays. PBMC from an AMG 160-naive healthy donor was used as an additional negative control. Phytohemagglutinin (PHA) was used as a non-specific T cell activator and acted as a technical positive control for the ELISPOT assay. TNTC refers to “Too-numerous-to-count”. The ELISPOT image enumerating the IFNγ spot counts in response to ex vivo stimulation from these individual peptides is shown for ADA-positive subject 101 66009 017 and ADA-negative subject 101 66021 002 (A), and depicted as bar plots in (B). The red dotted line in the bar graphs represents the cut-off value calculated as a number with two-fold more spots in the presence of that individual peptide compared to self-tolerant Peptide #13 within the same subject, with a minimal difference of 30 spots. Peptides producing spot counts above the cut-off value were considered able to promote a recall response in these patient PBMCs (denoted by red asterix *). In total, PBMC samples from 9 ADA-positive and 8 ADA-negative patients from the AMG 160 FIH trial were assessed in this assay. The 9 ADA-positive subjects, their binding ADA onset and the magnitude (Signal-to-Noise, S/N) of ADA response at EOT (if found positive at EOT), are shown in the table in (C).
Figure 8
Figure 8
Stepwise approach used to identify sequence-based T cell epitopes driving AMG 212 immunogenicity. Starting at the level of APC recognition and presentation, MHC class II-associated peptide proteomics (MAPPS) was used to parse out sequence regions that were naturally processed and presented by HLA class II on the APC surface (A). To further narrow down suspect sequences, peptides representing the MAPPS-identified sequence regions and all other CDR regions were synthesized and tested for individual peptide reactivity in a restimulated T cell line assay, which recapitulates an antigen-specific memory response in healthy donors (B). Peptides that conferred T cell reactivity through this assay were then tested in a clinical memory recall assay, to confirm the peptide’s ability to produce a recall response in patients who have developed a robust anti-drug antibody response in the clinic (C).

References

    1. Baker M, Reynolds HM, Lumicisi B, Bryson CJ. Immunogenicity of protein therapeutics: The key causes, consequences and challenges. Self/Nonself (2010) 1(4):314–22. doi: 10.4161/self.1.4.13904 - DOI - PMC - PubMed
    1. Harding FA, Stickler MM, Razo J, DuBridge R. The immunogenicity of humanized and fully human antibodies. mAbs (2010) 2(3):256–65. doi: 10.4161/mabs.2.3.11641 - DOI - PMC - PubMed
    1. Jawa V, Terry F, Gokemeijer J, Mitra-Kaushik S, Roberts BJ, Tourdot S, et al. T-cell dependent immunogenicity of protein therapeutics pre-clinical assessment and mitigation–updated consensus and review. Front Immunol (2020) 2020:11. doi: 10.3389/fimmu.2020.01301 - DOI - PMC - PubMed
    1. Boehncke W-H, Brembilla NC. Immunogenicity of biologic therapies: causes and consequences. Expert Rev Clin Immunol (2018) 14(6):513–23. doi: 10.1080/1744666X.2018.1468753 - DOI - PubMed
    1. Bray-French K, Hartman K, Steiner G, Marban-Doran C, Bessa J, Campbell N, et al. Managing the impact of immunogenicity in an era of immunotherapy: from bench to bedside. J Pharm Sci (2021) 110(7):2575–84. doi: 10.1016/j.xphs.2021.03.027 - DOI - PubMed

Publication types

Associated data