. 2023 Oct 24:23:100842.
doi: 10.1016/j.mtbio.2023.100842. eCollection 2023 Dec.

Fibroblasts alter the physical properties of dermal ECM-derived hydrogels to create a pro-angiogenic microenvironment

Affiliations

Fibroblasts alter the physical properties of dermal ECM-derived hydrogels to create a pro-angiogenic microenvironment

Meng Zhang et al. Mater Today Bio. .

Abstract

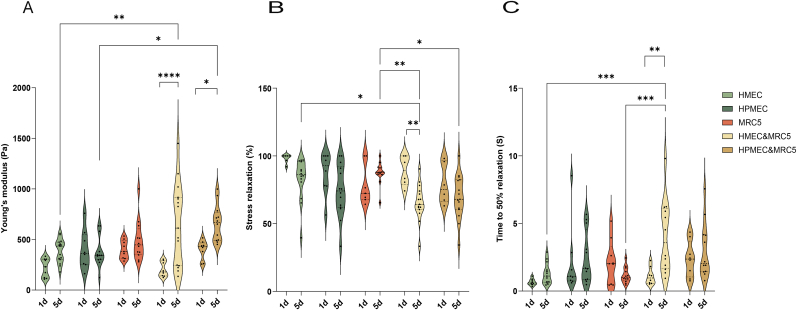
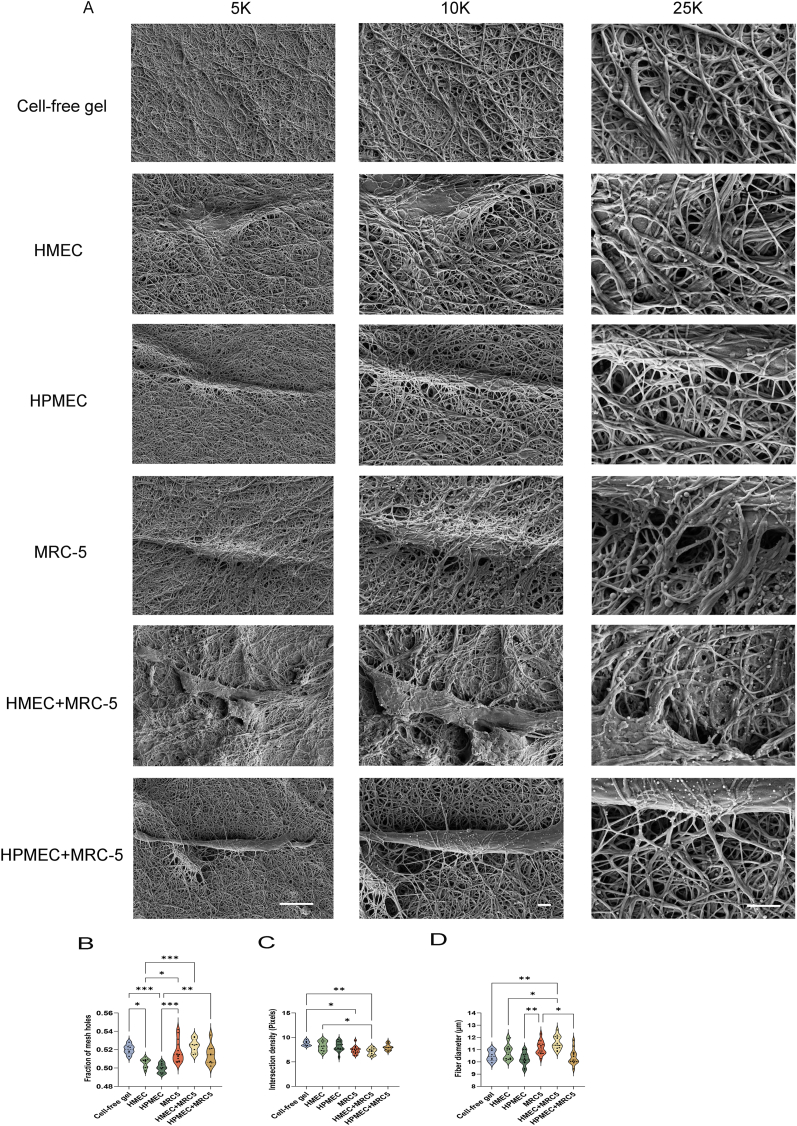
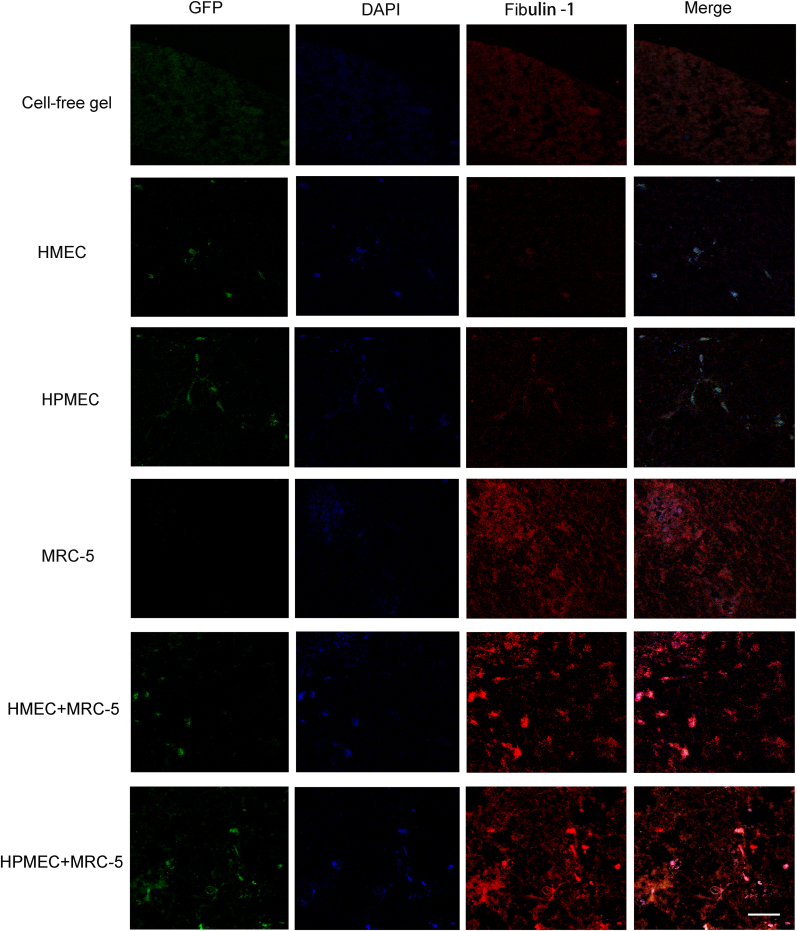
This study aimed to investigate the impact of fibroblasts (MRC-5) on the extracellular matrix (ECM) microenvironment of endothelial cells (ECs) during the vascularization of skin-derived ECM hydrogel in vitro. Two types of ECs were studied: human dermal microvascular endothelial cells (HMEC) and human pulmonary microvascular endothelial cells (HPMEC). Results showed that the presence of MRC-5 fibroblasts increased the stiffness of the hydrogel and led to larger fiber diameters and increased porosity. Extensive collagen fiber remodeling occurred in the ECM hydrogel with MRC-5 fibroblasts. Additionally, higher levels of fibulin-1 and fibronectin were deposited in the hydrogel when co-cultured with MRC-5 fibroblasts. These findings suggest that MRC-5 fibroblasts play a role in modifying the ECM microenvironment, promoting vascularization through dynamic ECM remodeling.

Keywords: Biomechanics; Collagen; ECM hydrogel; Endothelial cells; Extracellular matrix; Fibronectin; Vascularization.


Conflict of interest statement

The authors declare that they have no known competing financial interests or personal relationships that could have appeared to influence the work reported in this paper.

Figures

Image 1
Graphical abstract
Fig. 1
Fig. 1
Vascular network formation (VNF) by endothelial cells (ECs) in a 3D culture system either alone or in co-culture with MRC-5 cells. (A) The EGFP-expressing human dermal microvascular endothelial cells (HMECs) or human pulmonary microvascular endothelial cells (HPMEC) (green) and dTomato-expressing MRC-5 fibroblasts (red) were cultured in 48-well plates for five days. Scale bar - 400 μm. (B) Comparison of the number of master junctions based on Fiji quantification of VNF by ECs either alone or in co-culture with MRC-5 in skin extracellular matrix (ECM) hydrogels. (C) Comparison of the number of branches of VNF by ECs either alone or in co-culture in skin ECM hydrogels. (D) Comparison of total branching length based on Fiji quantification of VNF by ECs either alone or in co-culture with MRC-5 in skin ECM hydrogels. The data are from 7 independent experiments, while 3 different randomized regions were measured for every sample, each dot represents a measurement of a randomized region. Statistical testing by one-way ANOVA, *p < 0.05,** p < 0.01,**** p < 0.0001. (For interpretation of the references to color in this figure legend, the reader is referred to the Web version of this article.)
Fig. 2
Fig. 2
Comparison of physical characteristics of skin ECM hydrogel loaded with ECs either alone or in co-culture with MRC-5 cells after one- and five-days culture. (A) Stiffness of skin ECM hydrogel loaded with ECs either alone or in co-culture with MRC-5 cells on days one and five. Skin ECM hydrogels were tested using low-load compression tester (LLCT) with a fixed 20 % strain ratio. (B) Total stress relaxation of skin ECM hydrogel loaded with ECs either alone or in co-culture with MRC-5 cells on days one and five. After compressing the skin ECM hydrogel using LLCT with a fixed 20 % strain ratio, the stress relaxation was recorded in 100s. (C) Time to 50 % relaxation of skin ECM hydrogel loaded with ECs either alone or in co-culture with MRC-5 cells on day 1 and day 5. The data are from resp. three and five independent experiments for days one and five while three randomly selected spots on the hydrogel were measured for every single sample, and each dot represents a measurement. Statistical testing by two-way ANOVA, *p < 0.05, **p < 0.01,*** p < 0.001,**** p < 0.0001.
Fig. 3
Fig. 3
Remodeling of skin ECM hydrogels during VNF is augmented by fibroblasts. (A) Collagen fibers were detected by second harmonic generation (SHG) microscopy (scale bar - 50 μm). (B) Endpoints per 1000 μm total length. (C) Branching points per 1000 μm total length. (D) Percentage High-Density Matrix (HDM). (E) Fiber alignment. (F – I) Curvatures of resp. 40, 50, 60 and 70 arbitrary units. The data are generated from five independent experiments while each dot represents a measurement on one SHG micrograph. Statistical testing by one-way ANOVA, *p < 0.05, **p < 0.01.***p < 0.001.
Fig. 4
Fig. 4
Ultrastructure of the extracellular matrix and analyses of the microstructure of the fibers and pores. (A) Fibers of the matrix were visualized by scanning electron microscopy (SEM) at three different magnifications: 5000 (5k), 10,000 (10k), and 25,000 (25k). Scale bars represent 10 μm in 5k micrographs and 2 μm in both 10k and 25k micrographs. (B) Mesh hole analysis of the fibers at 25k magnification. Percentage of porosity is the total number of holes pixels divided by the total image resolution. (C) Intersection density of the fibers at 25k magnification defined as [10,000 x (number of fiber overlaps)/(Total number of pixels in the micrograph)]. (D) Mean fiber diameter (μm). The data were generated from three independent experiments while three randomly selected regions were measured for every single sample, each dot represents a measurement of a randomized region. Statistical testing by one-way ANOVA comparing gel, *p < 0.05, **p < 0.01.***p < 0.001.
Fig. 5
Fig. 5
Fluoromicrographs of fibronectin-staining. Representative images of fibronectin staining of 4 μm sections of paraffin-embedded hydrogels. Merged images: green – GPF-labeled HMEC and HPMEC, red – fibronectin, blue – nuclei (DAPI). Scale bar: 58 μm. (For interpretation of the references to color in this figure legend, the reader is referred to the Web version of this article.)
Fig. 6
Fig. 6
Fluoromicrographs of fibulin-1 staining. Representative images of fibulin-1 staining of 4 μm sections of paraffin-embedded hydrogels. Merged images: green – GPF-labeled HMEC and HPMEC, red – fibronectin, blue – nuclei (DAPI). Scale bar: 58 μm. (For interpretation of the references to color in this figure legend, the reader is referred to the Web version of this article.)

References

    1. Brem H., Stojadinovic O., Diegelmann R.F., Entero H., Lee B., Pastar I., Golinko M., Rosenberg H., Tomic-Canic M. Molecular markers in patients with chronic wounds to guide surgical debridement. Mol. Med. 2007;13(1–2):30–39. - PMC - PubMed
    1. Han G., Ceilley R. Chronic wound healing: a review of current management and treatments. Adv. Ther. 2017;34(3):599–610. - PMC - PubMed
    1. Guo S., Dipietro L.A. Factors affecting wound healing. J. Dent. Res. 2010;89(3):219–229. - PMC - PubMed
    1. Gosain A., DiPietro L.A. Aging and wound healing. World J. Surg. 2004;28(3):321–326. - PubMed
    1. Carmeliet P. Angiogenesis in health and disease. Nat. Med. 2003;9(6):653–660. - PubMed

LinkOut - more resources