. 2023 Dec;15(2):2274124.
doi: 10.1080/19490976.2023.2274124. Epub 2023 Nov 9.

Gut microbiota regulates postprandial GLP-1 response via ileal bile acid-TGR5 signaling

Affiliations

Gut microbiota regulates postprandial GLP-1 response via ileal bile acid-TGR5 signaling

Qiaoling Wang et al. Gut Microbes. 2023 Dec.

Abstract

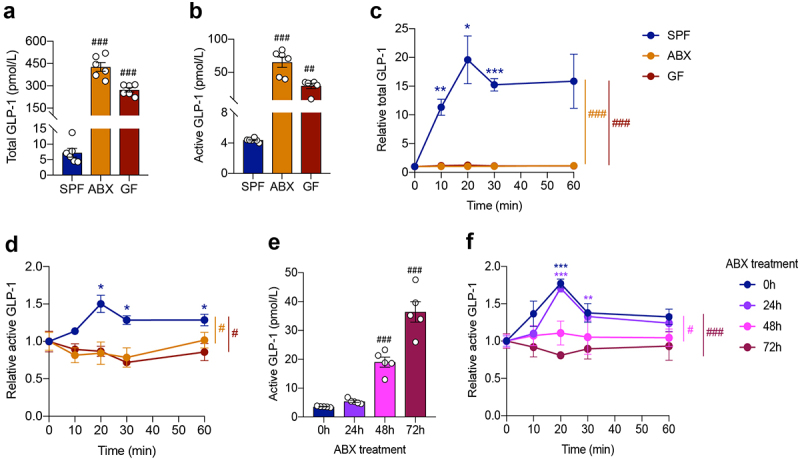
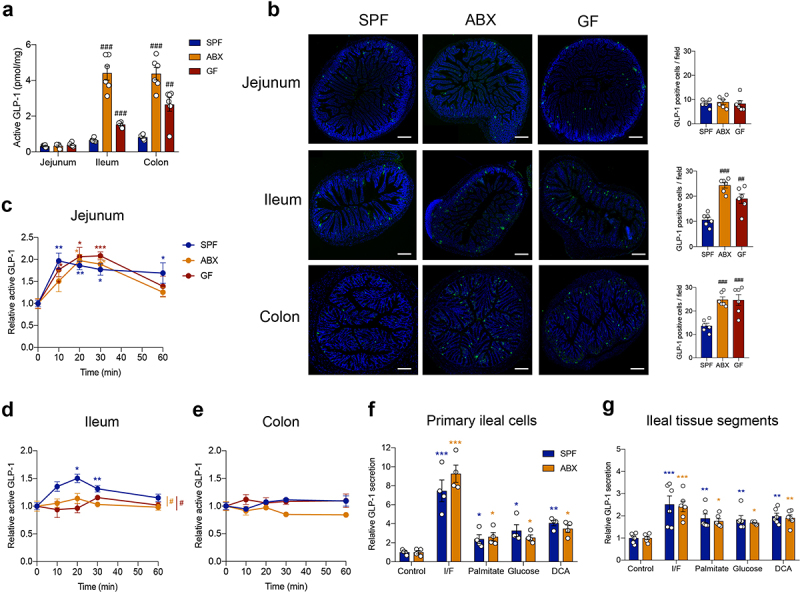
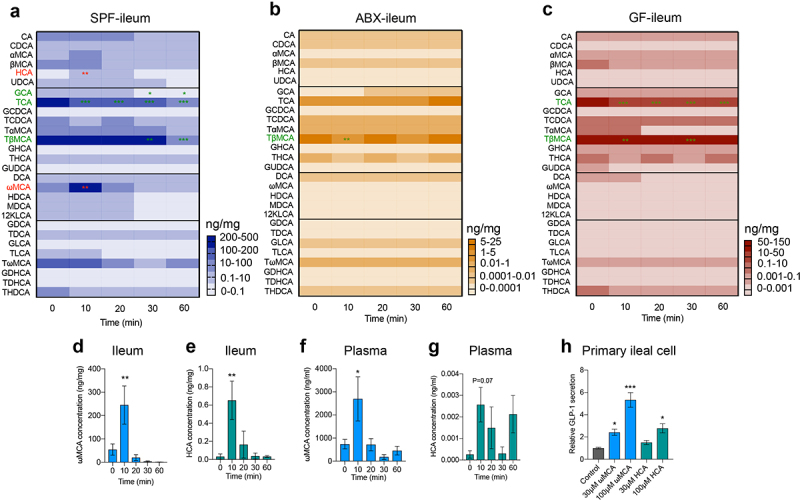
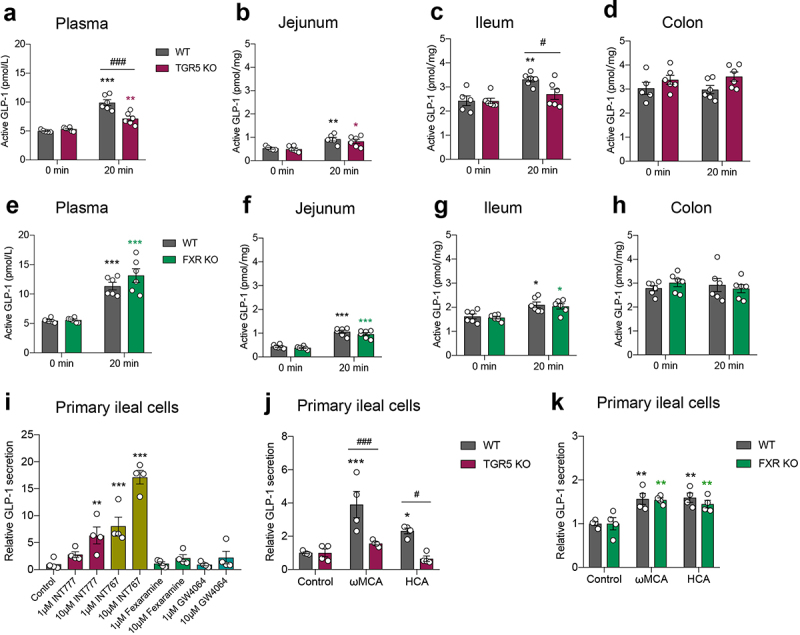
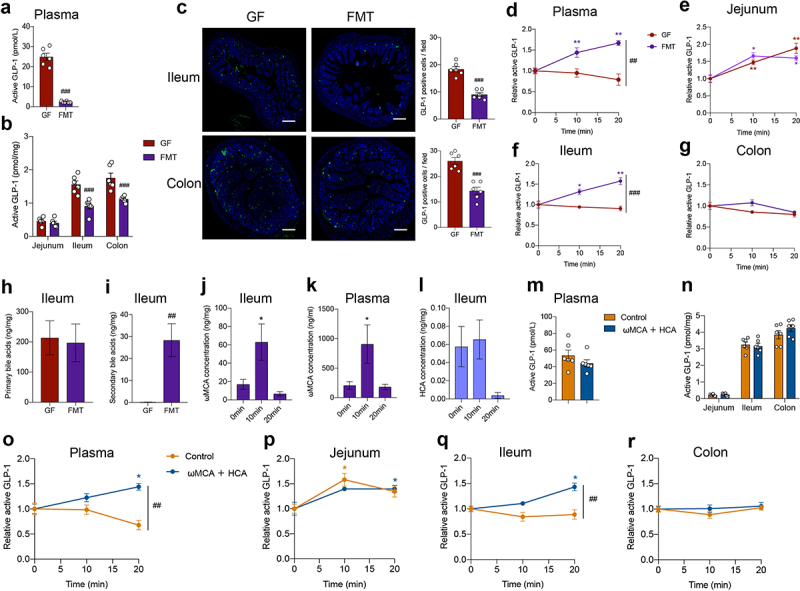
The gut microbiota interacts with intestinal epithelial cells through microbial metabolites to regulate the release of gut hormones. We investigated whether the gut microbiota affects the postprandial glucagon-like peptide-1 (GLP-1) response using antibiotic-treated mice and germ-free mice. Gut microbiome depletion completely abolished postprandial GLP-1 response in the circulation and ileum in a lipid tolerance test. Microbiome depletion did not influence the GLP-1 secretory function of primary ileal cells in response to stimulators in vitro, but dramatically changed the postprandial dynamics of endogenous bile acids, particularly ω-muricholic acid (ωMCA) and hyocholic acid (HCA). The bile acid receptor Takeda G protein-coupled receptor 5 (TGR5) but not farnesoid X receptor (FXR), participated in the regulation of postprandial GLP-1 response in the circulation and ileum, and ωMCA or HCA stimulated GLP-1 secretion via TGR5. Finally, fecal microbiota transplantation or ωMCA and HCA supplementation restored postprandial GLP-1 response. In conclusion, gut microbiota is indispensable for maintaining the postprandial GLP-1 response specifically in the ileum, and bile acid (ωMCA and HCA)-TGR5 signaling is involved in this process. This study helps to understand the essential interplay between the gut microbiota and host in regulating postprandial GLP-1 response and opens the foundation for new therapeutic targets.

Keywords: GLP-1; Microbiome; TGR5; bile acid; diabetes; ileum.


Conflict of interest statement

No potential conflict of interest was reported by the author(s).

Figures

Figure 1.
Figure 1.
Gut microbiome depletion increases fasting plasma GLP-1 level and completely abolishes postprandial GLP-1 response. (a, b) Comparison of fasting levels of total GLP-1 (a) and active GLP-1 (b) in the plasma of control SPF mice and gut microbiome-depleted (ABX and GF) mice (n = 6 per group). (c, d) Total GLP-1 response (c) and active GLP-1 response (d) after olive oil gavage in the plasma of SPF, ABX and GF mice (n = 6/time point/group). (e, f) Fasting active GLP-1 levels (e) and active GLP-1 response after olive oil gavage (f) in the plasma from mice treated with antibiotics for 0 h, 24 h, 48 h, 72 h, respectively (n = 5 per group). Data are shown as mean ± SEM. *P < .05, **P < .01, ***P < .001, vs. 0 min; #P < .05, ##P < .01, ###P < .001, vs. SPF mice or 0 h. Statistical significance was determined by (a, b, e) one-way ANOVA with the Dunnett’s posttest or (c, d, f) two-way ANOVA with the Dunnett’s posttest.
Figure 2.
Figure 2.
Gut microbiome depletion abolishes postprandial GLP-1 response particularly in the ileum. (a) Comparison of fasting active GLP-1 level in the intestinal tissue from SPF, ABX and GF mice (n = 6 per group). (b) Representative immunofluorescence staining for GLP-1 (green) and quantification of GLP-1 positive cells in the jejunum, ileum and colon of SPF, ABX and GF mice (n = 6 fields of 3 mice per group with each mice containing 2 fields). Nuclei were stained by DAPI (blue). Scale bars, 200 μm. (c-e) GLP-1 response after olive oil gavage in the jejunum (c), ileum (d), and colon (e) of SPF, ABX and GF mice (n = 6/time point/group). (f, g) The effect of known GLP-1 secretagogues (Ibmx/forskolin (I/F), palmitate, glucose and deoxycholic acid (DCA)) on GLP-1 secretion in primary ileal cells (n = 4 per group) (f) and in fresh ileal tissue segments (n = 6 per group) (g) isolated from SPF and ABX mice. Data are shown as mean ± SEM. *P < .05, **P < .01, ***P < .001, vs. 0 min or control; #P < .05, ##P < .01, ###P < .001, vs. SPF mice. Statistical significance was determined by (a, b) one-way ANOVA with the Dunnett’s posttest or (c-g) two-way ANOVA with the Dunnett’s posttest.
Figure 3.
Figure 3.
Gut microbiome depletion eliminates the changes of specific bile acids in response to olive oil. (a-c) Heatmap showing the changes in 28 bile acids after olive oil gavage in the ileum of SPF (a), ABX (b) and GF (c) mice (n = 5-6/time point/group). (d-g) Changes in ωMCA and HCA after olive oil gavage in the ileum (d, e), and plasma (f, g) of SPF mice (n = 5-6 per time point). (h) The effect of ωMCA and HCA on GLP-1 secretion in primary ileal cells isolated from SPF mice (n = 3 per group). Data are shown as mean ± SEM. *P < .05, **P < .01, ***P < .001, vs. 0 min or control. Statistical significance was determined by one-way ANOVA with the Dunnett’s posttest. Abbreviations: ωMCA: ω-muricholic acid; HCA: hyocholic acid.
Figure 4.
Figure 4.
Bile acid receptor TGR5 but not FXR mediates postprandial GLP-1 response in the circulation and ileum. (a-d) GLP-1 response after olive oil gavage in the plasma (a) and intestinal tissue (b-d) of wild-type (WT) and TGR5 KO mice (n = 5–6/time point/group). (e-h) GLP-1 response after olive oil gavage in the plasma (e) and intestinal tissue (f-h) of WT and FXR KO mice (n = 6/time point/group). (i) The effect of TGR5 or FXR agonists on GLP-1 secretion in primary ileal cells isolated from SPF mice (n = 4 per group). (j, k) The effect of ωMCA and HCA on GLP-1 secretion in primary ileal cells isolated from WT vs. TGR5 KO mice (j) and WT vs. FXR KO mice (k) (n = 4 per group). Data are shown as mean ± SEM. *P < .05, **P < .01, ***P < .001, vs. 0 min or control; #P < .05, ###P < .001, vs. WT mice. Statistical significance was determined by (a-h, j, k) two-way ANOVA with the Dunnett’s posttest or (i) one-way ANOVA with the Dunnett’s posttest.
Figure 5.
Figure 5.
FMT or bile acid treatment recovers postprandial GLP-1 response in microbiome- depleted mice. (a, b) Comparison of fasting GLP-1 levels in the plasma (a) and intestinal tissue (b) of GF mice and GF mice colonized with fecal microbiota (FMT) (n = 6 per group). (c) Representative immunofluorescence staining for GLP-1 (green) and quantification of GLP-1 positive cells in the ileum and colon from GF and FMT mice (n = 6 fields of 3 mice per group with each mice containing 2 fields). Nuclei were stained by DAPI (blue). Scale bars, 200 μm. (d-g) GLP-1 response after olive oil gavage in the plasma (d) and intestinal tissue (e-g) of GF and FMT mice (n = 6/time point/group). (h, i) Concentration of fasting primary bile acids (h) and secondary bile acids (i) in the ileum of GF and FMT mice (n = 6/group). (j, k) Changes in ωMCA after olive oil gavage in the ileum (j) and plasma (k) of FMT mice (n = 6 per time point). (l) Changes in HCA after olive oil gavage in the ileum of FMT mice (n = 6 per time point). (m, n) Comparison of fasting GLP-1 levels in the plasma (m) and intestinal tissue (n) of control or ωMCA + HCA treated ABX mice (n = 6 per group). (o-r) GLP-1 response after olive oil gavage in the plasma (o) and intestinal tissue (p-r) of control or ωMCA + HCA treated ABX mice (n = 6/time point/group). Data are shown as mean ± SEM. *P < .05, **P < .01, vs. 0 min; ##P < .01, ###P < .001, vs. GF mice or control group. Statistical significance was determined by (a-c, h and i, m and n) unpaired Student’s t-test, (d-g, o-r) two-way ANOVA with the Dunnett’s posttest, or (j-l) one-way ANOVA with the Dunnett’s posttest. Abbreviations: ωMCA: ω-muricholic acid; HCA: hyocholic acid.

References

    1. Drucker DJ. The biology of incretin hormones. Cell Metab. 2006;3(3):153–16. doi:10.1016/j.cmet.2006.01.004. - DOI - PubMed
    1. Finan B, Ma T, Ottaway N, Muller TD, Habegger KM, Heppner KM, Kirchner H, Holland J, Hembree J, Raver C, et al. Unimolecular dual incretins maximize metabolic benefits in rodents, monkeys, and humans. Sci Transl Med. 2013;5(209):209ra151. doi:10.1126/scitranslmed.3007218. - DOI - PubMed
    1. Finan B, Yang B, Ottaway N, Smiley DL, Ma T, Clemmensen C, Chabenne J, Zhang L, Habegger KM, Fischer K, et al. A rationally designed monomeric peptide triagonist corrects obesity and diabetes in rodents. Nat Med. 2015;21(1):27–36. doi:10.1038/nm.3761. - DOI - PubMed
    1. Herrmann C, Goke R, Richter G, Fehmann HC, Arnold R, Goke B. Glucagon-like peptide-1 and glucose-dependent insulin-releasing polypeptide plasma levels in response to nutrients. Digestion. 1995;56(2):117–126. doi:10.1159/000201231. - DOI - PubMed
    1. Chia CW, Egan JM. Incretins in obesity and diabetes. Ann N Y Acad Sci. 2020;1461(1):104–126. doi:10.1111/nyas.14211. - DOI - PMC - PubMed

Publication types

Substances

LinkOut - more resources