. 2023 Dec 1;16(12):dmm050342.
doi: 10.1242/dmm.050342. Epub 2023 Dec 1.

Ascorbate protects human kidney organoids from damage induced by cell-free hemoglobin

Affiliations

Ascorbate protects human kidney organoids from damage induced by cell-free hemoglobin

Julie Bejoy et al. Dis Model Mech. .

Abstract

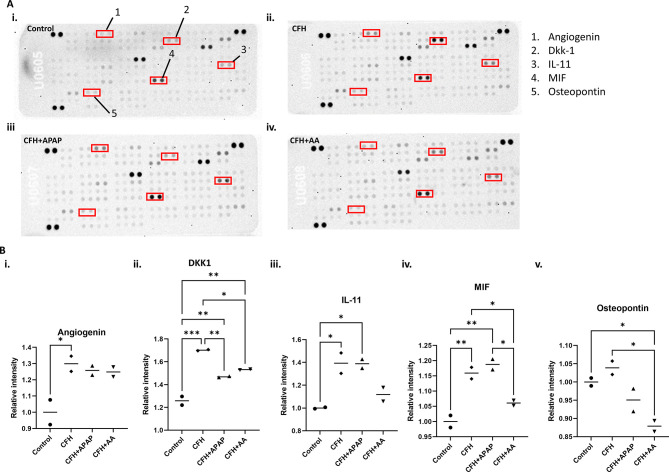
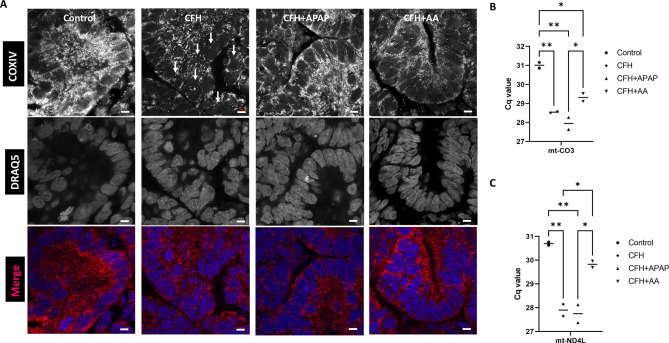
Sepsis-associated acute kidney injury is associated with high morbidity and mortality in critically ill patients. Cell-free hemoglobin (CFH) is released into the circulation of patients with severe sepsis and the levels of CFH are independently associated with mortality. CFH treatment increased cytotoxicity in the human tubular epithelial cell line HK-2. To better model the intact kidney, we cultured human kidney organoids derived from induced pluripotent stem cells. We treated human kidney organoids grown using both three-dimensional and transwell protocols with CFH for 48 h. We found evidence for increased tubular toxicity, oxidative stress, mitochondrial fragmentation, endothelial cell injury and injury-associated transcripts compared to those of the untreated control group. To evaluate the protective effect of clinically available small molecules, we co-treated CFH-injured organoids with ascorbate (vitamin C) or acetaminophen for 48 h. We found significantly decreased toxicity, preservation of endothelial cells and reduced mitochondrial fragmentation in the group receiving ascorbate following CFH treatment. This study provides direct evidence that ascorbate or ascorbic acid protects human kidney cells from CFH-induced damage such as that in sepsis-associated acute kidney injury.

Keywords: Acute kidney injury; Cell-free hemoglobin; Induced pluripotent stem cells; Kidney; Organoids; Sepsis.


Conflict of interest statement

Competing interests The authors declare no competing or financial interests.

Figures

Fig. 1.
Fig. 1.
CFH increases cytotoxicity and reduces viability of cells within transwell kidney organoids via ROS. (A) Schematic outline of the protocol for differentiating iPSCs into kidney organoids on transwell dishes and a brightfield image of the whole kidney organoids at day 25 (i), with a high-magnification image showing S-shaped bodies (arrows) (ii). Scale bar: 50 µm (ii). Created with BioRender.com and PowerPoint. (B) Immunostaining of the resulting organoid shows positive staining for markers of the distal tubule (CDH1), proximal tubule (LTL), and podocytes (MAFB) (n=10 organoids from more than three independent experiments). Scale bars: 100 µm. (C) The brightfield images of the whole organoids treated with either cisplatin (CIS) or cell-free hemoglobin (CFH) with lost tubule segments (white arrows); the outlined regions represent the differentiated areas (n=3 organoids from three independent experiments). Scale bars: 50 µm. (D) The impact of CFH on the viability as measured by MTT activity (i) and cytotoxicity as measured by LDH activity (ii) of cells within kidney organoids (n=5 independent experiments; data shown are from one experiment). O.D., optical density. (E) Quantification of the amount of KIM-1 released into the medium for the CFH-treated organoids compared to that for the control group as measured by ELISA. (F) Co-staining for ROS (red), DAPI to mark nuclei (blue) and the proximal tubule marker LTL (green) in human kidney organoids (n=3 organoids from three independent experiments). Scale bars: 50 µm. (G) Malondialdehyde (MDA) assay in untreated organoids versus kidney organoids receiving the CFH treatment. (H) Superoxide dismutase (SOD) assay for the control and CFH-treated organoid groups (n=3). Bars show median values. ns, not significant; *P<0.05; **P<0.01; ****P≤0.0001 (one-way ANOVA with Tukey's multiple comparisons for D,E, unpaired two tailed t-test for G,H).
Fig. 2.
Fig. 2.
CFH increases cytotoxicity and reduces viability of cells within 3D human kidney organoids via ROS. (A) Schematic of human kidney organoid differentiation growth according to the 3D bioreactor protocol. Created with BioRender.com and PowerPoint. (B) The 3D kidney organoids stained for markers of various nephron segments including the distal tubule (CDH1, red), proximal tubule (LTL, green) and glomerular podocytes (MAFB, red); nuclei are stained with DAPI (blue). Scale bars: 20 µm (n=10 organoids from more than three independent experiments). (C) Brightfield images of organoids treated with CFH and the positive control, the nephrotoxicant cisplatin (CIS) (n=3 organoids from three independent experiments). Arrows indicate injured organoids losing the integrity of cell membrane. Scale bars: 100 µm. (D) Cell viability as measured by MTT activity (i) and cytotoxicity as measured by LDH activity (ii) in the 3D human kidney organoids (n=3). (E) ELISA for KIM-1 release in the medium. (F) Intracellular ROS production was measured with CellROX fluorescence to indicate ROS levels (red); nuclei were stained with DAPI (blue). Scale bars: 100 µm. (G) Quantification of CellROX. Bars show median values. *P<0.05; **P<0.01; ***P<0.001 (one-way ANOVA with Tukey's multiple comparisons for D,E,G).
Fig. 3.
Fig. 3.
Kidney organoids treated with CFH have endothelial cell atrophy, loss of tubular cell-cell junctions and swollen mitochondria. (A) Representative transmission electron microscopy images of endothelial cells (i), tubules (ii) and mitochondria (iii) in human kidney organoids treated with or without CFH. Endothelial-like cells (ECs; red arrows) near the basement membrane (BM, blue arrows), lipid drops (white arrow) and tubule-like cells (black arrows) with microvilli (mv, green arrows) and mitochondria (purple arrows) are indicated. Images are representative of two organoids from one experiment. Scale bars: 1 µm. (B) Quantification of mitochondrial length (i) and lipid droplets (ii) in the CFH-treated organoids compared to those in control. Bars show median values. ns, not significant; ****P≤0.0001 (unpaired two-tailed t-test).
Fig. 4.
Fig. 4.
Bulk RNA sequencing reveals increase in cytokine- and fibrosis-related genes as well as upregulation of inflammatory pathways in CFH-treated organoids. (A) Volcano plot showing the differential expression of genes associated with injury in CFH-treated organoids compared to that in control. The right side of the plot indicates upregulated transcripts and the left side shows downregulated transcripts in the CFH group compared to the control group. Green dots indicate the statistically significantly regulated genes that had a fold change of 2 (positive or negative) with P-value <0.05. Red dots indicate the genes with the greatest fold change that had log10P≥5 and log2(fold change or FC)>2. ROBO2, IGFBP5, TMC4 and ERICH3 were the top enriched genes. NS, not significant (gray dots). (B) Top enriched gene sets in each cluster with functions in biological processes showing the upregulation of genes involved in pathways including inflammatory response, TNFα signaling, IL6-JAK-STAT3 signaling, as well as the epithelial to mesenchymal transition in the CFH group. n=3 samples per group.
Fig. 5.
Fig. 5.
Ascorbate improves viability and reduces apoptosis triggered by CFH treatment in kidney organoids. (A) Transwell organoids were treated at day 19 for 48 h with either CFH (1 mg/ml), CFH and acetaminophen (APAP; 1000 nM), or CFH and ascorbate (AA; 200 nM). (B) Brightfield images of the corresponding organoids show preserved nephron segments in white and dying areas of the organoids in black. Scale bars: 50 µm. (n=10 organoids from ten independent experiments) (C) Co-treatment with either APAP or AA analyzed for toxicity using LDH assay at 48 h (n=3 organoids from three independent experiments). (D) Viability was determined by MTT assay in the co-treated groups at 48 h in comparison to that of control and CFH-alone groups (n=3 organoids from three independent experiments). (E) Human kidney organoids were untreated (control), treated with CFH (CFH), treated with CFH and APAP (CFH+APAP), or treated with CFH and AA (CFH+AA) and co-stained for cleaved caspase-3 (red, stains cells undergoing apoptosis), the proximal tubule marker LTL (green) and nuclei with DAPI (blue). Scale bars: 100 µm (n=3 organoids from three independent experiments). Bars show median values. ns, not significant; *P<0.05; **P<0.01; ***P<0.001; ****P≤0.0001 (one-way ANOVA with Tukey's multiple comparisons for C,D).
Fig. 6.
Fig. 6.
CFH treatment induces cytokine release that was altered after co-treatment with APAP and AA. (A) Cytokine array analysis of culture media collected from dishes containing human kidney organoids from the following 48 h treatment groups: (i) untreated control, (ii) CFH, (iii) CFH and APAP (CFH+APAP), and (iv) CFH and AA (CFH+AA). Factors that appeared to change between groups are marked in the red boxes. (B) Quantification of cytokine levels in ImageJ software for: (i) angiogenin, (ii) DKK1, (iii) IL-11, (iv) MIF and (v) osteopontin. Bars show median values. *P<0.05; **P<0.01; ***P<0.001 (one-way ANOVA with Tukey's multiple comparisons).
Fig. 7.
Fig. 7.
AA reduces mitochondrial damage in CFH-treated human kidney organoids. (A) Immunostaining with mitochondrial marker COX-IV (red) showing segmented mitochondria (white arrows) within a tubule segment of CFH-treated transwell organoids co-stained with DRAQ5 to mark the nuclei (blue; n=3 organoids from three independent experiments). Scale bars: 5 μm. (B,C) The levels of mitochondrial DNA released to the cell culture medium due to segmentation were evaluated with real-time quantitative PCR analysis of (B) MT-CO3 and (C) MT-ND4L. Bars show median values. *P<0.05; **P<0.01 (one-way ANOVA with Tukey's multiple comparisons for B,C).
Fig. 8.
Fig. 8.
AA improves endothelial cell marker expression in CFH-treated human kidney organoids. (A) Immunostaining of the endothelial cell marker CDH5 (red) and the proximal tubule marker LTL (green). Scale bars: 300 μm. (B) Quantification of the images for CDH5-positive areas compared to total organoid area (DRAQ5), measured using ImageJ software (n>3 organoids from two independent experiments). Bars show the mean±s.d. *P<0.05 (one-way ANOVA with Tukey's multiple comparisons).

References

    1. Adamzik, M., Hamburger, T., Petrat, F., Peters, J., De Groot, H. and Hartmann, M. (2012). Free hemoglobin concentration in severe sepsis: methods of measurement and prediction of outcome. Crit. Care 16, R125. 10.1186/cc11425 - DOI - PMC - PubMed
    1. Afonso, V., Champy, R., Mitrovic, D., Collin, P. and Lomri, A. (2007). Reactive oxygen species and superoxide dismutases: role in joint diseases. Joint Bone Spine 74, 324-329. 10.1016/j.jbspin.2007.02.002 - DOI - PubMed
    1. Agyemang, A. A., Kvist, S. V., Brinkman, N., Gentinetta, T., Illa, M., Ortenlöf, N., Holmqvist, B., Ley, D. and Gram, M. (2021). Cell-free oxidized hemoglobin drives reactive oxygen species production and pro-inflammation in an immature primary rat mixed glial cell culture. J. Neuroinflammation 18, 42. 10.1186/s12974-020-02052-4 - DOI - PMC - PubMed
    1. Barber, B. E., Grigg, M. J., Piera, K. A., William, T., Cooper, D. J., Plewes, K., Dondorp, A. M., Yeo, T. W. and Anstey, N. M. (2018). Intravascular haemolysis in severe Plasmodium knowlesi malaria: association with endothelial activation, microvascular dysfunction, and acute kidney injury. Emerg. Microbes Infect. 7, 1-10. 10.1038/s41426-018-0105-2 - DOI - PMC - PubMed
    1. Bejoy, J., Qian, E. S. and Woodard, L. E. (2022). Tissue culture models of AKI: from tubule cells to human kidney organoids. J. Am. Soc. Nephrol. 33, 487-501. 10.1681/ASN.2021050693 - DOI - PMC - PubMed

Publication types