. 2024 Apr;20(4):792-808.
doi: 10.1080/15548627.2023.2269028. Epub 2023 Nov 9.

A conserved requirement for RME-8/DNAJC13 in neuronal autophagic lysosome reformation

Affiliations

A conserved requirement for RME-8/DNAJC13 in neuronal autophagic lysosome reformation

Sierra B Swords et al. Autophagy. 2024 Apr.

Abstract

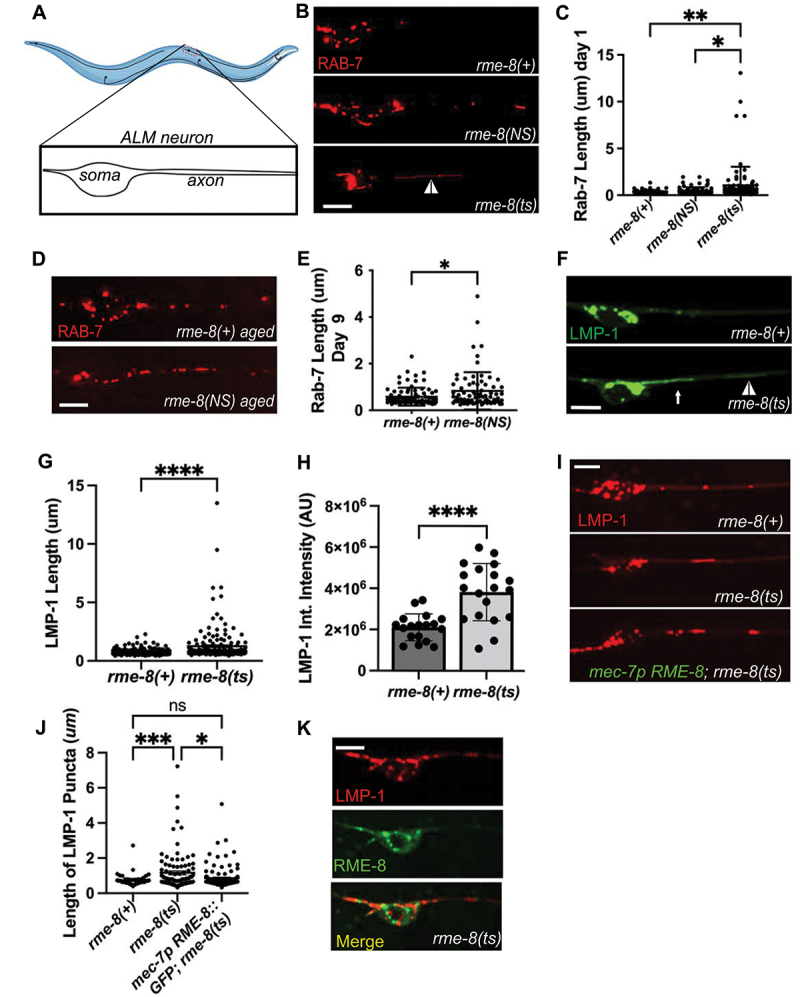
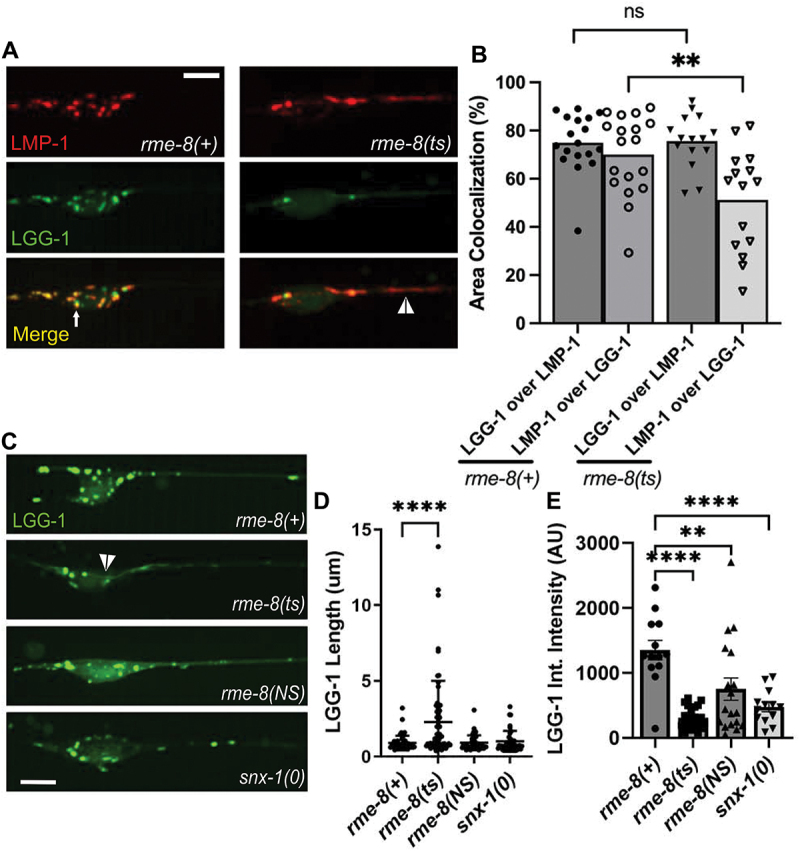
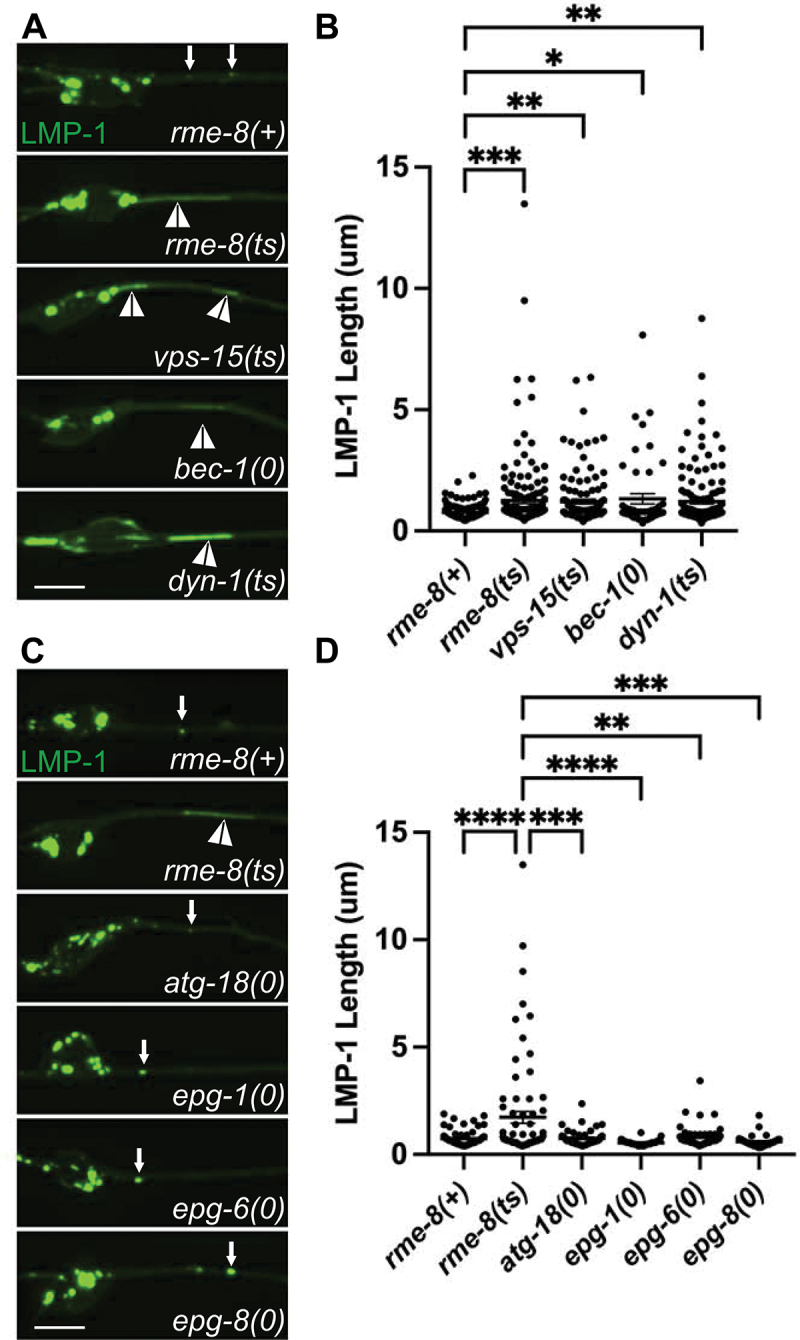
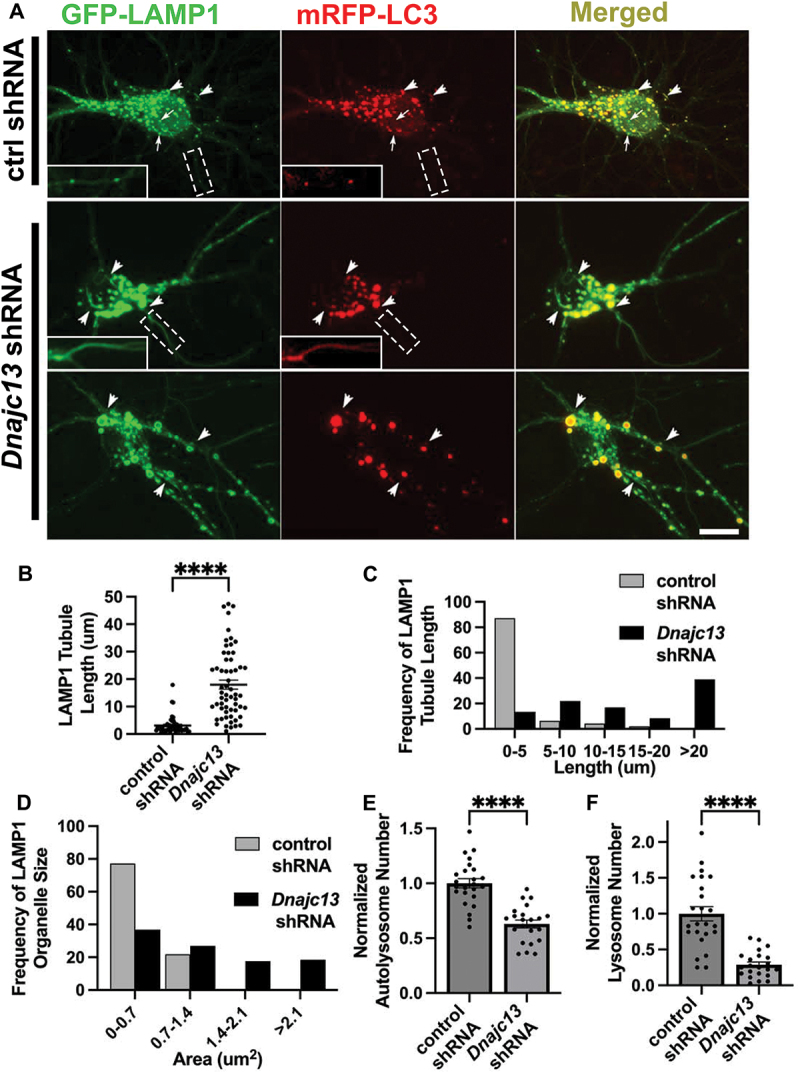
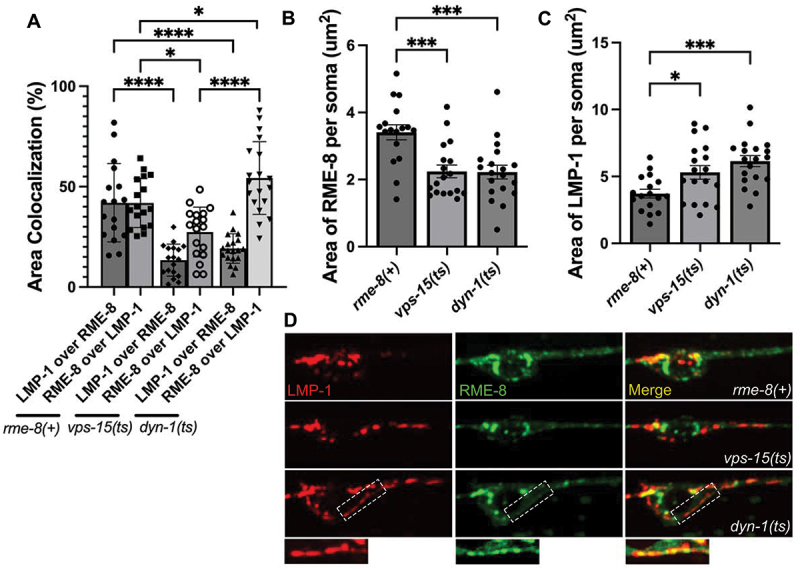
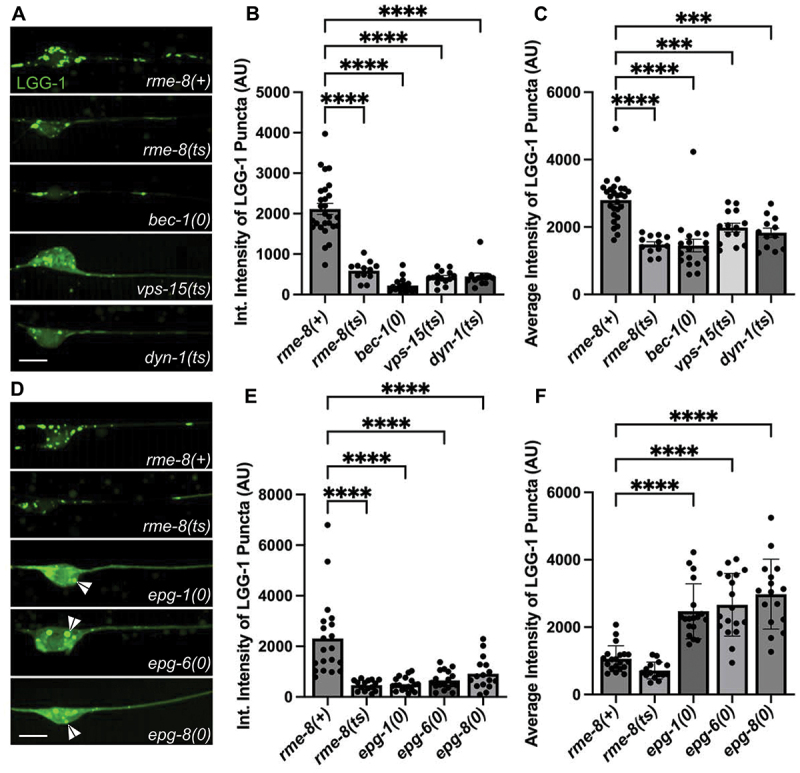
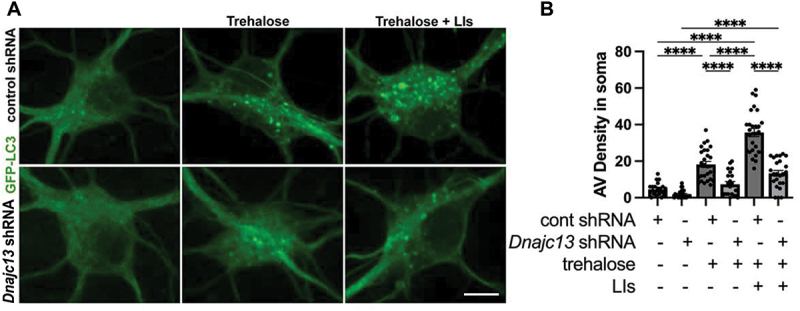
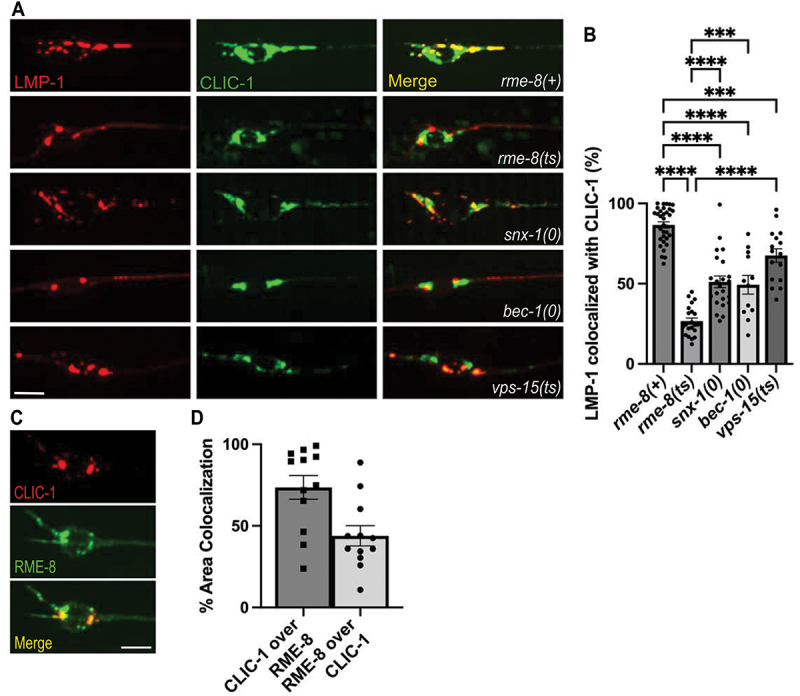
Autophagosomes fuse with lysosomes, forming autolysosomes that degrade engulfed cargo. To maintain lysosomal capacity, autophagic lysosome reformation (ALR) must regenerate lysosomes from autolysosomes using a membrane tubule-based process. Maintaining lysosomal capacity is required to maintain cellular health, especially in neurons where lysosomal dysfunction has been repeatedly implicated in neurodegenerative disease. The DNA-J domain HSC70 co-chaperone RME-8/DNAJC13 has been linked to endosomal coat protein regulation and to neurological disease. We report new analysis of the requirements for the RME-8/DNAJC13 protein in neurons, focusing on intact C. elegans mechanosensory neurons, and primary mouse cortical neurons in culture. Loss of RME-8/DNAJC13 in both systems results in accumulation of grossly elongated autolysosomal tubules. Further C. elegans analysis revealed a similar autolysosome tubule accumulation defect in mutants known to be required for ALR in mammals, including mutants lacking bec-1/BECN1/Beclin1 and vps-15/PIK3R4/p150 that regulate the class III phosphatidylinositol 3-kinase (PtdIns3K) VPS-34, and dyn-1/dynamin that severs ALR tubules. Clathrin is also an important ALR regulator implicated in autolysosome tubule formation and release. In C. elegans we found that loss of RME-8 causes severe depletion of clathrin from neuronal autolysosomes, a phenotype shared with bec-1 and vps-15 mutants. We conclude that RME-8/DNAJC13 plays a previously unrecognized role in ALR, likely affecting autolysosome tubule severing. Additionally, in both systems, loss of RME-8/DNAJC13 reduced macroautophagic/autophagic flux, suggesting feedback regulation from ALR to autophagy. Our results connecting RME-8/DNAJC13 to ALR and autophagy provide a potential mechanism by which RME-8/DNAJC13 could influence neuronal health and the progression of neurodegenerative disease.Abbreviation: ALR, autophagic lysosome reformation; ATG-13/EPG-1, AuTophaGy (yeast Atg homolog)-13; ATG-18, AuTophaGy (yeast Atg homolog)-18; AV, autophagic vacuole; CLIC-1, Clathrin Light Chain-1; EPG-3, Ectopic P Granules-3; EPG-6, Ectopic P Granules-6; LGG-1, LC3, GABARAP and GATE-16 family-1; MAP1LC3/LC3, microtubule-associated protein 1 light chain 3; PD, Parkinson disease; PtdIns3P, phosphatidylinositol-3-phosphate; PtdIns(4,5)P2, phosphatidylinositol-4,5-bisphosphate; RME-8, Receptor Mediated Endocytosis-8; SNX-1, Sorting NeXin-1; VPS-34, related to yeast Vacuolar Protein Sorting factor-34.

Keywords: Autophagy; clathrin; endocytosis; lysosomes; neurodegeneration; trafficking.


Conflict of interest statement

No potential conflict of interest was reported by the authors.

Figures

Figure 1.
Figure 1.
Loss of RME-8 results in accumulation of elongated lysosomal tubules.(A) Representative drawing of ALM neurons in C. elegans. One of two ALM neurons is shown (other is located laterally opposite). Red dashed box represents the approximate area that is shown in example micrographs. (B) fluorescent micrographs showing mec-7p promoter-driven mScarlet::RAB-7 labeled (late endosome/lysosome marker) puncta in soma (left) and proximal axon (right) in ALM neurons in rme-8(+), rme-8(N861S), and rme-8(ts) day 1 adult backgrounds. White arrowhead indicates grossly elongated tubule. (C) length of RAB-7 puncta/tubule in the proximal axon in rme-8(+), rme-8(N861S) and rme-8(ts) is graphed in day 1 adult animals. Each data point represents an individual puncta/tubule. A minimum of 15 animals were analyzed per strain. (D) mec-7 promoter-driven mScarlet::RAB-7 labeled puncta in rme-8(+) and rme-8(N861S) backgrounds in day 9 adult. (E) length of RAB-7 puncta/tubule in the proximal axon in rme-8(+), and rme-8(N861S) is graphed in day 9 adults. Each data point represents an individual puncta/tubule. (F) mec-7p LMP-1::mNeonGreen (NG) labeled (lysosome marker) puncta. A severely elongated LMP-1-positive tubule can be seen emanating into the axon from puncta in the soma (white arrow), and another dimmer tubule can be seen further out in the axon (white arrowhead). (G) quantification of LMP-1::mNG axonal puncta/tubule length seen in conditions shown in (F). Each data point represents an individual puncta/tubule. A minimum of 15 animals were analyzed per strain. (H) graph depicting LMP-1::mNG Integrated intensity (arbitrary Units; AU) for the same experiment as (F) and (G). Each data point represents the integrated intensity of all thresholded puncta in one soma in one animal. (I) micrographs of mec-7p RME-8::GFP rescue of LMP-1::mScarlet length in rme-8(ts) background. (J) graph quantifying elongation of LMP-1::mScarlet in rme-8(+), rme-8(ts), and mec-7p RME-8::GFP; rme-8(ts). (K) Example image showing localization of mec-7p RME-8::GFP and mec-7p LMP-1::mScarlet in rme-8(ts) background. Scale bars: 5 µm. Abbreviations: rme-8(NS)= rme-8(pw22[N861S]); rme-8(ts)= rme-8(b1023ts). (C) and (J): one-way ANOVA followed with Tukey’s multiple comparisons test. (E), (G), (H): Student’s unpaired t-test. *P < 0.05, **P < 0.01, ***P < 0.001, ****P < 0.0001.
Figure 2.
Figure 2.
rme-8 mutants accumulate abnormal autolysosomes. (A) micrographs are shown for single channels as well as merged images in double-labeled LMP-1::mScarlet (lysosome marker); mNg::LGG-1 (autophagosome marker) in rme-8(+) and rme-8(ts) backgrounds in ALM somata and proximal axons. White arrow labels mNg::LGG-1+/LMP-1::msc- puncta. White arrowhead labels tubules labeled by LMP-1 and dimly labeled by LGG-1 in the rme-8(ts) background. (B) graphs quantifying the colocalization of LMP-1::mSc and mNg::LGG-1, measured by % area colocalization. Each data point represents average % area colocalization for one animal. *P < 0.01, ns > 0.05 by two-tailed unpaired t-test. (C) micrograph showing mec-7p::mNG::LGG-1 in neurons of rme-8(+), rme-8(ts), rme-8(N861S), and snx-1(0) backgrounds. Scale bar: 5 µm. (D) graph quantifying elongation of mNG::LGG-1 in rme-8(+), rme-8(ts), and rme-8(N861S); snx-1(0) backgrounds. Each data point represents an individual puncta/tubule. (E) graph depicting mNg::LGG-1 integrated intensity (arbitrary Units; AU) for the same experiment as 2C and 2D. Each data point represents the integrated intensity of all thresholded puncta in one soma in one animal. (D), (E): **P < 0.0001, ***P <.01 by one-way ANOVA followed with Tukey’s multiple comparisons test.
Figure 3.
Figure 3.
Loss of RME-8 phenocopies autophagic lysosome reformation mutants. (A) micrographs are shown of mec-7p LMP-1::mNG in ALM neurons in rme-8(+), rme-8(ts), vps-15(ts), bec-1(0), and dyn-1(ts) backgrounds. (B) quantification of LMP-1 tubule length (um) in ALM proximal axons in the genetic backgrounds shown in A). Each data point represents an individual puncta/tubule. (C) micrographs are shown of mec-7p LMP-1::mNG in ALM neurons in rme-8(+), rme-8(ts), atg-18(0), epg-1(0), epg-6(0), epg-8(0), backgrounds. Example images and graphs are separate from A) and B) because data was obtained during separate experiments. (D) quantification of LMP-1 tubule length (µm) in ALM proximal axons in the genetic backgrounds shown in (C). Each data point represents an individual puncta/tubule. (B), (D): *P < 0.001, **P < 0.01, ***P < 0.05, ns > 0.05 by one-way ANOVA followed with Tukey’s multiple comparisons test.
Figure 4.
Figure 4.
DNAJC13/RME-8 knockdown in mouse cortical neurons causes elongated autolysosomal tubules and enlarged autolysosomes. (A) micrographs of double-labeled GFP-LAMP1, mRFP-LC3 in primary mouse cortical neurons transfected with control (top panel) or Dnajc13 (bottom two panels) shRNA. Images are shown for single channel labeling and merged. Arrows (top panel, control shRNA) indicate lysosomes (GFP-LAMP1 positive; mRFP-LC3 negative), arrowheads indicate autolysosomes (GFP-LAMP1 positive; mRFP-LC3 positive). Insets in white boxes depict magnified portions of axonal processes (boxes with dotted white lines) scaled to better show presence of axonal puncta or tubules in both channels. Scale bars: 10 µm. (B) the average LAMP1 tubules length of each soma is quantified in control and Dnajc13 shRNA conditions. Each puncta represents the average length in one neuron. (C) frequency distribution of average tubule length per soma in control and Dnajc13 shRNA. (D) frequency distribution of LAMP1 positive (lysosomes and autolysosomes) vesicle area per soma in control and Dnajc13 shRNA. (E) autolysosome number in soma, defined as LAMP1 positive, LC3 positive puncta, normalized to control shRNA conditions, in control shRNA conditions and Dnajc13 shRNA conditions. (F) lysosome number in soma, defined as LAMP1 positive, LC3 negative puncta, normalized to control shRNA conditions, in control shRNA conditions and Dnajc13 shRNA conditions. (B), (E), (F) Student’s unpaired t-test. ****P < 0.0001.
Figure 5.
Figure 5.
Colocalization of RME-8 with lysosomes. (A) quantification of % area colocalization of double labeled strains LMP-1::mScarlet; RME-8::GFP in rme-8(+), vps-15(ts), and dyn-1(ts) backgrounds. (B) quantification of thresholded area of RME-8 in the somas of rme-8(+), vps-15(ts), and dyn-1(ts) strains. (C) quantification of thresholded area of LMP-1 in the somas of rme-8(+), vps-15(ts), and dyn-1(ts) strains. (D) fluorescent single channel and merged micrographs of double labeled strains quantified in (A). Scale bars: 5 µm. *P < 0.05, **P < 0.01, ***P < 0.001, ****P < 0.0001 by one-way ANOVA followed with Tukey’s multiple comparisons test.
Figure 6.
Figure 6.
Loss of RME-8 causes decreased autophagosome levels similar to known ALR mutants. (A), (D) micrographs of mec-7p LGG-1::mNG in C. elegans ALM neurons. Area shown includes soma (left) and proximal axon (right). Example images and graphs are separate due to data being obtained during separate experiments. Scale bars: 5 µm. (B), (E) quantification of integrated intensity of mNG::LGG-1 puncta in backgrounds shown in (A) and (D) (AU; arbitrary units). (C), (F) average intensity of LGG-1 positive puncta in axons and somata of backgrounds shown in (A) and (D). *P < 0.001, **P < 0.0001 by one-way ANOVA followed with Tukey’s multiple comparisons test.
Figure 7.
Figure 7.
DNAJC13 knockdown in mouse cortical neurons reduces autophagic flux. (A) micrographs are shown of in vitro mouse cortical neurons transfected with GFP-LC3. A 2 × 3 factorial design was used. Conditions shown: basal autophagy, trehalose treatment, and trehalose + lysosome inhibitors (LIs) (pepstatin A and E64d) when cells were treated with either control shRNA or Dnajc13 shRNA. Scale bars: 10 µm. (B) autophagic vacuole (AV) density is quantified in the soma of neurons for the 2 × 3 factorial design shown in (A). ****P < 0.0001 by one-way ANOVA followed with Tukey’s multiple comparisons test.
Figure 8.
Figure 8.
RME-8 is required for efficient clathrin recruitment to lysosomes. (a) single-channel and merge images of double-labeled LMP-1::mSc and CLIC-1::mNG in C. elegans’ ALM neurons. (b) quantification of the percent of LMP-1::mSc thresholded area that has CLIC-1::mNG present on it. One-way ANOVA followed with Tukey’s multiple comparisons test. *P < 0.05, **P < 0.01, ***P < 0.001, ****P < 0.0001. (c) fluorescent single channel and merged micrographs of double labeled strains CLIC-1::mScarlet; RME-8::GFP wild-type background. (d) quantification of colocalization between strains shown in (C) using % area colocalization. Scale bars: 5 µm.

Update of

References

    1. Yu L, McPhee CK, Zheng L, et al. Termination of autophagy and reformation of lysosomes regulated by mTOR. Nature. 2010;465(7300):942–946. doi: 10.1038/nature09076 - DOI - PMC - PubMed
    1. Rong Y, Liu M, Ma L, et al. Clathrin and phosphatidylinositol-4,5-bisphosphate regulate autophagic lysosome reformation. Nat Cell Biol. 2012;14(9):924–934. doi: 10.1038/ncb2557 - DOI - PubMed
    1. Schulze RJ, Weller SG, Schroeder B, et al. Lipid droplet breakdown requires dynamin 2 for vesiculation of autolysosomal tubules in hepatocytes. J Cell Bio. 2013;203(2):315–326. doi: 10.1083/jcb.201306140 - DOI - PMC - PubMed
    1. Du W, Su Q, Chen Y, et al. Kinesin 1 drives autolysosome tubulation. Dev Cell. 2016;37(4):326–336. doi: 10.1016/j.devcel.2016.04.014 - DOI - PubMed
    1. Eramo MJ, Gurung R, Mitchell CA, et al. Bidirectional interconversion between PtdIns4P and PtdIns(4,5)P2 is required for autophagic lysosome reformation and protection from skeletal muscle disease. Autophagy. 2021;17(5):1287–1289. doi: 10.1080/15548627.2021.1916195 - DOI - PMC - PubMed

Publication types