. 2023 Oct;22(19):2172-2193.
doi: 10.1080/15384101.2023.2278945. Epub 2023 Dec 5.

Targeting ribosome biogenesis reinforces ERK-dependent senescence in pancreatic cancer

Affiliations

Targeting ribosome biogenesis reinforces ERK-dependent senescence in pancreatic cancer

M C Rowell et al. Cell Cycle. 2023 Oct.

Abstract

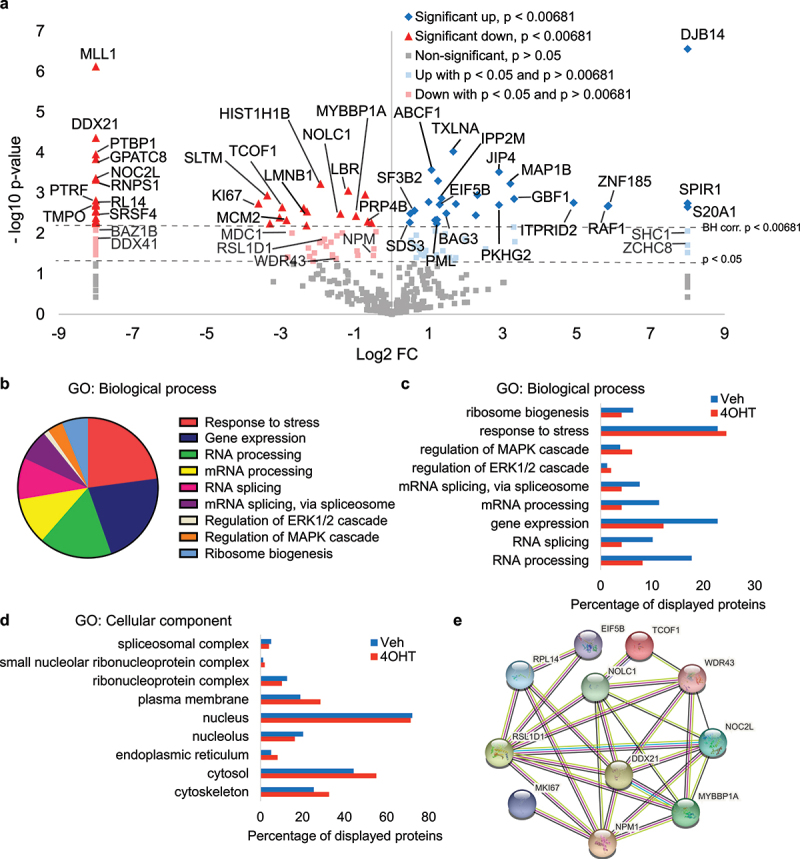
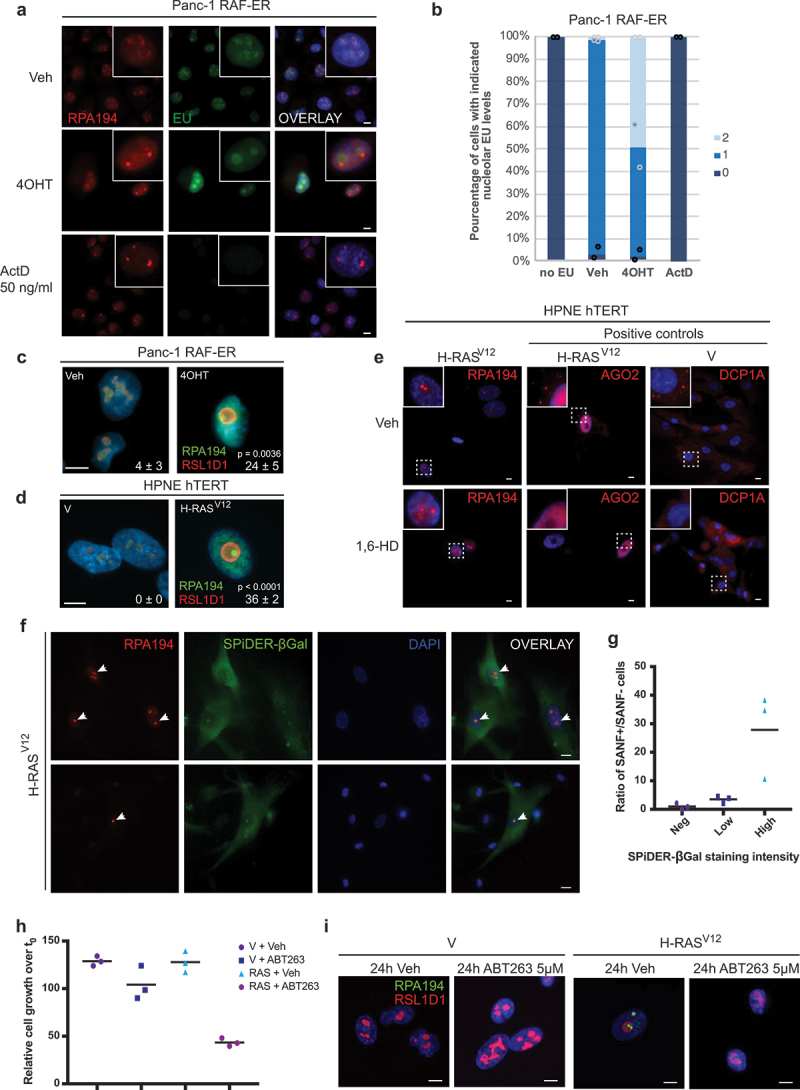
Pancreatic adenocarcinomas (PDAC) often possess mutations in K-Ras that stimulate the ERK pathway. Aberrantly high ERK activation triggers oncogene-induced senescence, which halts tumor progression. Here we report that low-grade pancreatic intraepithelial neoplasia displays very high levels of phospho-ERK consistent with a senescence response. However, advanced lesions that have circumvented the senescence barrier exhibit lower phospho-ERK levels. Restoring ERK hyperactivation in PDAC using activated RAF leads to ERK-dependent growth arrest with senescence biomarkers. ERK-dependent senescence in PDAC was characterized by a nucleolar stress response including a selective depletion of nucleolar phosphoproteins and intranucleolar foci containing RNA polymerase I designated as senescence-associated nucleolar foci (SANF). Accordingly, combining ribosome biogenesis inhibitors with ERK hyperactivation reinforced the senescence response in PDAC cells. Notably, comparable mechanisms were observed upon treatment with the platinum-based chemotherapy regimen FOLFIRINOX, currently a first-line treatment option for PDAC. We thus suggest that drugs targeting ribosome biogenesis can improve the senescence anticancer response in pancreatic cancer.

Keywords: MAP kinase; folfirinox; nucleolus; pancreatic cancer; ribosome biogenesis; therapy-induced senescence.


Conflict of interest statement

No potential conflict of interest was reported by the author(s).

Figures

Figure 1.
Figure 1.
Decreased p-ERK levels correlate with the progression of human pancreatic cancer. (a), immunohistochemistry of p-ERK and KI-67 of human adjacent pancreas and different grades of pancreatic neoplasms. Insets: ADM, acinar-to-ductal metaplasia; PanIN-1 to 3 (P1–3), pancreatic intraepithelial lesions (grades 1 to 3); PDAC, pancreatic ductal adenocarcinoma; H&E, hematoxylin, and eosin; BV, blood vessel; AC, acinar cells; D, normal duct; A, ADM. Black arrows, adjacent ducts; white arrows, acinar cells; scale bars = 100 µm. (b) staining as in (a), but fields showing two different types of pancreatic lesions. (c) quantification of KI-67-positive epithelial cells in (a). Data are presented as the average percentage of positive cells ± SD, n = 16 patients; two-tailed Student t-test. (d) quantification of p-ERK staining of epithelial cells in (a) according to four intensities of staining (none, 0; low, 1; moderate, 2; high, 3). The average percentage of cells for each staining intensity is shown. Patients as in (c); PanIN-1 vs ADM P < 0.0001, PanIN-3 vs PanIN-2 P = 0.0201, PanIN-3 vs PanIN-1 P < 0.0001, PDAC vs PanIN-1 P < 0.0001, two-tailed Student t-test. See also supplemental Figure S1.
Figure 2.
Figure 2.
Decreased p-ERK levels correlate with tumor initiation in a KRas-driven mouse model of pancreatic cancer. (a) immunohistochemistry of p-Erk and Ki-67 of pancreatic tissues from Pdx1-Cre;LSL-KRasG12D mice. Normal pancreatic tissues, pancreatic intraepithelial lesions (PanIN; grades 1 to 3), and PDAC are shown. Insets: higher magnification of representative regions. PC, pancreatic cancer; black arrows, normal ducts; white arrows, acinar cells; scale bars = 100 µm. (b) quantification of Ki-67-positive epithelial cells in (a). Data are presented as the average percentage of positive cells ± SD, n = 14 mice; P compared to PanIN-1, two-tailed Student t-test. (c) quantification of p-Erk staining of epithelial cells in (a) according to four intensities of staining (none, 0; low, 1; moderate, 2; high, 3). The average percentage of cells for each staining intensity is shown. Mice as in b; PanIN-1 vs ADM P < 0.0001, PanIN-2 vs PanIN-1 P = 0.0106, PanIN-3 vs PanIN-1 P = 0.0022, PDAC vs PanIN-1 P < 0.0001, two-tailed Student t-test. (d) Immunoblots for the indicated proteins in cell lines established from the Pdx1-Cre; LSL-KRasG12D mouse model in (a): PanIN-1 (1497 to 1499) vs PDAC (AH375). The NB508 PDAC cell line was established from the Pdx1-Cre; LSL-KrasG12D;p53Lox/+;p16± mouse model. P-c-raf, c-raf phosphoserine 338; p-Mek1/2, Mek1/2 phosphoserine 217/221; p-Erk1/2, Erk 1 (p44, upper band) and 2 (p42, lower band) phosphothreonine 202 and phosphotyrosine 204, n = 3. (e-f) RNA from 1499 and AH375 cells were collected for microarray gene expression analysis (GEO accession number: GSE57566). Gene set enrichment analysis (GSEA) revealed a gene expression signature of (e) RAF activation in 1499 cells (RAF_UP.V1_UP; M2728) and (f) MEK activation in 1499 cells (MEK_UP.V1_UP; M2725), n = 3 biological replicates. See also supplemental Figure S1b-S2.
Figure 3.
Figure 3.
Reactivation of ERK signaling in PDAC induces a senescent-like phenotype in an ERK-dependent manner. (a) immunoblots for the indicated proteins in Panc-1 human pancreatic cancer cells expressing ΔRAF1-ER (RAF-ER) or ER control vector (ER) following a 48 h treatment with indicated drugs. 4OHT, 4-hydroxytamoxifen; SCH, ERK inhibitor SCH772984. p-MEK1/2, MEK1/2 phosphoserines 217/221; p-ERK1/2, ERK 1 (p44, upper band) and 2 (p42, lower band) phosphorylated on threonine 202 and tyrosine 204. (b) proliferation of Panc-1 cells expressing the RAF-ER vector, measured by MTT assay. The relative proliferation represents the fold of OD at 570 nm over 48 h of treatment with indicated drugs. Each bar represents the mean of three replicates ± SD. (c) phenotype of colonies as revealed by crystal violet staining 10 days post-seeding at low density with a single 48 h treatment of 4OHT and/or two treatments with SCH772984 every day for two days. Fresh drug-free media was used 48 hours after treatment. (d) quantification of colonies from (c). Each bar represents the mean number of colonies relative to colonies from vehicle-treated cells from three replicates ± SD.Co-treatment with ERK inhibitor SCH772984 rescues the growth defect caused by 4OHT-induced RAF activation. e SA-β-gal assay on cells as in (b). Each bar indicates the mean percentage of SA-β-gal-positive cells from three ≥ 100 cell counts ± SD. (f-g) quantitative RT-PCR (qPCR) for the indicated genes on cells as in (b). Each bar represents the mean fold-change (2−ΔΔCq) over the vehicle-treated condition from three replicates ± SD. (h) immunoblots for the indicated proteins on cells as in (b). p-RB S780, retinoblastoma protein phosphorylated on serine 780; p-H3 S10, Histone 3 phosphorylated on serine 10. (i) tumor volume, starting at day 0 of treatment, 1 month after subcutaneous injection of 1 × 10[6] Panc-1 cells expressing the RAF-ER construct into hsd: athymic Nude-Foxn1nu mice. Mice were treated every 48 h intraperitoneally with tamoxifen (Tam) or vehicle (Veh) starting when mean tumor volume reached ≥50 mm3. Data are shown as mean volume + SEM. Veh, n = 8 tumors from 4 mice; Tam, n = 10 tumors from 5 mice. (j) Immunohistochemistry of p-ERK and KI-67 of tissue sections from tumors harvested at the endpoint of (i). Scale bars = 50 µm. (k-l) quantification of p-ERK-positive cells and KI-67-positive cells from (j). Data are presented as the mean percentage of positive cells, from ≥ two fields with ≥ 100 cells for each tumor, ± SEM. Veh, n = 20 fields; Tam, n = 22 fields. For panels b, d-g, i, k-l, two-tailed Student t-test. Experiments a-h were performed independently at least twice in Panc-1 cells and were repeated with similar results in three additional pancreatic cancer cell lines. Experiments i-l were repeated with similar results in one additional pancreatic cancer cell line. See supplemental Figures S3-S4.
Figure 4.
Figure 4.
Phosphoproteomics of Panc-1 cells under high ERK signaling reveal changes associated with nucleolar stress. (a) Volcano plot summarizing phosphoproteomic changes in Panc-1 ΔRAF1-ERT (RAF-ER) cells treated for 48 h with 4OHT relative to vehicle-treated cells. Proteins whose phosphopeptides are enriched following RAF activation are shown in blue, whereas proteins whose phosphopeptides are downregulated are shown in red. Significance was assessed by t-test with Benjamini-Hochberg correction for multiple testing, BH P < 0.00681, n = 3 biological replicates. (b) Gene ontology for biological processes, using scaffold 4 Proteomics Software, of proteins whose phosphopeptides are significantly up- or downregulated following RAF pathway activation as in (a). (c) percentage of proteins from each condition (Veh or 4OHT) that are associated with GO terms of biological processes from (b). (d) percentage of proteins from each condition (Veh or 4OHT) that are associated with GO terms of cellular components. (e) STRING network representation of hits from (a) that are linked to nucleolar functions, ribosome biogenesis, and translation.
Figure 5.
Figure 5.
ERK-induced senescence is linked to nucleolar stress and senescence-associated nucleolar foci (SANF) formation. (a) 5-ethynyl uridine (EU) incorporation RPA194 in Panc-1 RAF-ER cells treated for 72 h with either vehicle or 4OHT, or for 18 h with actinomycin D (ActD) 50 ng/ml. Nuclei are counterstained with DAPI. Scale bar = 10 µm, n = 2. (b) quantification of EU incorporation by a semiquantitative scoring system (no staining = 0, moderate staining = 1 and strong staining = 2). One hundred cells were scored in six different images from two biological replicas. (c) immunofluorescence for RPA194 and RSL1D1 of Panc-1 RAF-ER cells treated for 48 h with vehicle, Veh or 4-hydroxytamoxifen, 4OHT. Quantification of cells harboring senescence-associated nucleolar foci (SANF) is shown in the bottom right corner. Data represent the mean percentage of cells ± SD from three counts of ≥ 100 cells, two-tailed Student t-test. Scale bar = 10 µm, n = 3. (d) immunofluorescence for RPA194 and RSL1D1 of HPNE hTERT cells expressing H-RASV12 or control vector (V), 12 days post-infection. Quantification was performed as in (c), two-tailed Student t-test, scale bar = 10 µm, n = 3. (e) immunofluorescence for RPA194, or AGO2 and DCP1A as positive controls, on cells as in (d) treated for 1 h with 1% 1,6-hexanediol or vehicle before fixation. SANF are not dissolved by hexanediol whereas P-bodies containing AGO2 or DCP1A are. Scale bar = 10 µm, n = 3. (f) SPiDER-βGal assay on H-RASV12-expressing HPNE hTERT cells and immunofluorescence using anti-RPA194 antibodies showing the presence of SANF (white arrows) in SPiDER-βGalHigh cells compared to surrounding SPiDER-βGalLow or negative cells. Scale bar = 20 µm, n = 2. (g) Quantification of the ratio of SANF-positive cells over negative cells among the indicated categories of SPiDER-βGal staining intensities from cells in (f). Data represent the mean ratio of cells from three counts of ≥ 60 cells ± SD, one-way ANOVA with Tukey HSD. (h) the senolytic ABT263 kills preferentially SANF-positive senescent cells. The graph shows the relative percentage of cell proliferation after a 24 h treatment with 5 µM ABT263 of cells as in (d), R means H-RASV12 expression. Data represent the mean of triplicates ± SD, as measured by crystal violet staining and quantification of OD at 590 nm relative to time 0, two-tailed Student t-test, n = 2. (i) immunofluorescence using antibodies against RPA194 and RSL1D1 on cells from (h), showing the phenotype of nucleoli and loss of SANF in cells remaining after senolysis. Scale bar = 10 µm, n = 2.
Figure 6.
Figure 6.
Nucleolar stressors and ERK activation cooperate to arrest the proliferation of pancreatic cancer cells and to promote structural changes in the nucleolus. (a) immunoblots for the indicated proteins on cell extracts from Panc-1 RAF-ER cells treated for 72 h with vehicle, 4OHT, oxaliplatin (L-OHP, 2 µM), or a combination of both drugs. p-RB S795, retinoblastoma protein phosphorylated on serine 795; p-H3 S10, Histone 3 phosphorylated on serine 10, F.L. CASP3, full-length caspase 3; c-CASP3, cleaved caspase 3, n = 3. (b) relative proliferation over 7 days of cells as in (a) as measured by the fold of OD at 590 nm from a crystal violet assay. Data represent the mean percentage of proliferation from triplicates ± SD, n = 3. (c) immunoblots for the indicated proteins on cell extracts from Panc-1 RAF-ER cells treated for 72 h with vehicle, 4OHT, BMH-21 (75 nM) or a combination of both drugs, n = 3. (d) relative proliferation over 7 days of cells as in (c) as measured by the fold of OD at 590 nm from a crystal violet assay. Data represent the mean percentage of proliferation from triplicates ± SD, n = 3. (e) immunofluorescence for RPA194 and RSL1D1 of Panc-1 RAF-ER cells treated with indicated drugs for 5 days at the concentrations described in (a) and (c). Scale bar = 10 µm, n = 3. For panels b and d, two-tailed Student t-test.
Figure 7.
Figure 7.
FOLFIRINOX efficiently restores high ERK signaling and features of senescence to promote tumor suppression in PDAC cells. (a) proliferation of Panc-1 cells treated every 3 days with FOLFIRINOX (5-FU 5 µM, SN38 10 nM, oxaliplatin 1 µM) or vehicle (Veh, DMSO) as measured by crystal violet assay. Data represent the relative fold change of OD at 590 nm. Each point represents the mean of triplicates ± SD, n = 3. (b) SA-β-gal assay at day 6 on cells as in (a). F, FOLFIRINOX. Each bar indicates the mean percentage of SA-β-gal-positive cells from three ≥ 100-cell counts ± SD, n = 3. (c) immunoblots of indicated proteins on cells as in (b). p-ERK1/2, extracellular-signal regulated kinases 1 (p44, upper band) and 2 (p42, lower band) phosphorylated on threonine 202 and tyrosine 204; p-RB S795, retinoblastoma protein phosphorylated on serine 795; p-H3 S10, Histone 3 phosphorylated on serine 10, c-CASP3, cleaved caspase 3, n = 3. (d) fluorescence imaging of cells as is (b) stained with Congo Red or control vehicle (CTL). Scale bar = 20 µm, n = 3. (e) violin plot showing quantification of Congo Red intensity in nucleoli from cells in (e). Each dot represents an assessment of intensity in a different cell from 20 cells assessed per replicate, dashed lines show the median and quartiles, outer line shows the distribution, n = 3. (f) RTqPCR on cells as in (b) with primers targeting the 18S, 5.8S, or 28S portion of both precursor and mature rRNAs, relative to HMBS and TBP housekeeping genes. Data represent the mean of triplicates ± SD., p = 0.0725, n = 3. (g) model describing the involvement of both p-ERK activation, nucleolar stress, and ribosome biogenesis inhibition in the senescence phenotype of FOLFIRINOX-treated pancreatic cancer cells. For panels a-b, e, and f, two-tailed Student t-test.

References

    1. Deschenes-Simard X, Kottakis F, Meloche S, et al. Erks in cancer: friends or foes? Cancer Res. 2014;74(2):412–419. doi: 10.1158/0008-5472.CAN-13-2381 - DOI - PubMed
    1. Deng Q, Liao R, Wu BL, et al. High intensity ras signaling induces premature senescence by activating p38 pathway in primary human fibroblasts. J Biol Chem. 2004;279(2):1050–1059. doi: 10.1074/jbc.M308644200 - DOI - PubMed
    1. Deschenes-Simard X, Gaumont-Leclerc MF, Bourdeau V, et al. Tumor suppressor activity of the ERK/MAPK pathway by promoting selective protein degradation. Genes Dev. 2013;27(8):900–915. doi: 10.1101/gad.203984.112 - DOI - PMC - PubMed
    1. Rahmouni S, Cerignoli F, Alonso A, et al. Loss of the VHR dual-specific phosphatase causes cell-cycle arrest and senescence. Nat Cell Biol. 2006;8(5):524–531. doi: 10.1038/ncb1398 - DOI - PubMed
    1. Zhu B, Ferry CH, Blazanin N, et al. PPARβ/δ promotes HRAS-induced senescence and tumor suppression by potentiating p-ERK and repressing p-AKT signaling. Oncogene. 2014;33(46):5348–5359. doi: 10.1038/onc.2013.477 - DOI - PMC - PubMed

Publication types

MeSH terms