. 2023 Nov 29;89(11):e0098723.
doi: 10.1128/aem.00987-23. Epub 2023 Nov 9.

The effect of hydrostatic pressure on the activity and community composition of hydrocarbon-degrading bacteria in Arctic seawater

Affiliations

The effect of hydrostatic pressure on the activity and community composition of hydrocarbon-degrading bacteria in Arctic seawater

Angeliki Marietou et al. Appl Environ Microbiol. .

Abstract

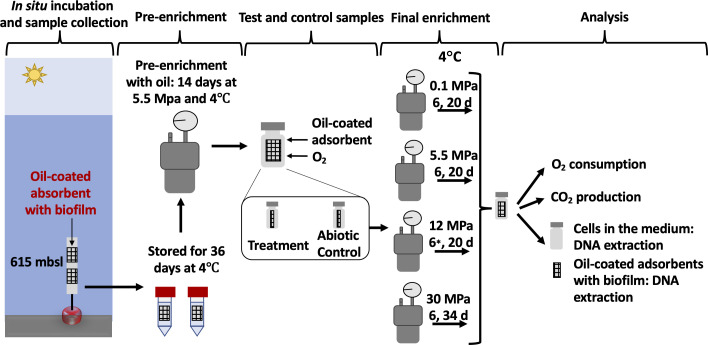
Increased ship traffic in the Arctic region raises the risk of oil spills. With an average sea depth of 1,000 m, there is a growing concern over the potential release of oil sinking in the form of marine oil snow into deep Arctic waters. At increasing depth, the oil-degrading community is exposed to increasing hydrostatic pressure, which can reduce microbial activity. However, microbes thriving in polar regions may adapt to low temperature by modulation of membrane fluidity, which is also a well-known adaptation to high hydrostatic pressure. At mild hydrostatic pressures up to 8-12 MPa, we did not observe an altered microbial activity or community composition, whereas comparable studies using deep-sea or sub-Arctic microbial communities with in situ temperatures of 4-5°C showed pressure-induced effects at 10-15 MPa. Our results suggest that the psychrophilic nature of the underwater microbial communities in the Arctic may be featured by specific traits that enhance their fitness at increasing hydrostatic pressure.

Keywords: Arctic; hydrocarbon biodegradation; hydrostatic pressure; microbial community; psychrophilic bacteria.


Conflict of interest statement

The authors declare no conflict of interest.

Figures

Fig 1
Fig 1
Schematic overview of the experimental design: Oil-degrading biofilms were collected in a Greenland fjord and used as inoculum for ex situ enrichment microcosms. After a pre-enrichment of 14 days at 5.5 MPa, test and control microcosms were inoculated and incubated at hydrostatic pressures between 0.1 and 30 MPa. The enrichment vials with 4.4 mL artificial seawater medium containing an oil-coated adsorbent of 40 × 7 mm2 were incubated inside the pressure vessels. Samples from the test and control microcosms were collected after 6–34 days for analysis of CO2 production, 16S rRNA gene quantification by qPCR, and 16S rRNA gene amplicon sequencing. *The pressure in the pressure vessel at 12 MPa decreased to 8 MPa after 6 days.
Fig 2
Fig 2
CO2 production (A) and average 16S rRNA gene-specific CO2 production rate (B) in the enrichments after 6, 20, and 34 days of incubation at hydrostatic pressure of 0.1, 5.5, 8, 12, and 30 MPa (n = 3). The average 16S rRNA gene-specific CO2 production rate was estimated using the ratio of the CO2 production rate in the enrichment vials to the average suspended and biofilm-associated 16S rRNA gene concentration measured by qPCR.
Fig 3
Fig 3
16S rRNA gene copy numbers in the enrichments over time in (A) the medium of the enrichments and (B) extracted from the biofilms on the oil-coated adsorbents in the enrichments. (C) The fraction of 16S rRNA gene copy numbers associated with the biofilms on the oil-coated adsorbents relative to the total copy number measured in the biofilms and the surrounding medium of the enrichments (n = 3). At the different time points (0, 6, 20, and 34 days), bacterial DNA was extracted directly from the oil-coated adsorbents with oil-associated biofilm (A), while the cells in the medium (B) were collected by centrifugation before DNA extraction.
Fig 4
Fig 4
Mean (n = 3) relative abundances of bacterial 16S rRNA genes as a function of time and hydrostatic pressure in field biofilms (A) and in the medium and biofilm of laboratory enrichments (B), and taxa that had a significantly higher (C) and lower (D) relative abundance at 30 MPa as compared to the lower pressures. The plots were constructed as follows: first, taxa classified down to the species level having a relative abundance higher than a cutoff value in at least one of the treatments were plotted. The cutoff was 13%, 13%, 0%, and 5% for subplots (A), (B), (C), and (D), respectively. The same procedure was subsequently repeated at the taxonomic levels of genus, family, order, class, and phylum using the same cutoff value. Finally, relative abundances of the remaining taxa for which the relative abundance at the phylum level was lower than the cutoff value were summed up and denoted “other bacteria.” The number of ASVs for each taxon is indicated between brackets.
Fig 5
Fig 5
Score plot of the PCA (A) and variance partitioning of the RDA (B) on the microbial community composition determined by 16S rRNA gene sequencing in the enrichments at 0, 6, 20, and 34 days and hydrostatic pressures of 0.1, 5.5, 8, 12, and 30 MPa. The factor matrix with levels Biofilm and Medium refers to the DNA extracted from the biofilms on the oil-coated adsorbents and the cells collected from the medium of the enrichments, respectively.
Fig 6
Fig 6
Mean effect size (logit difference, black) and mean relative gene abundance (±standard deviation) of ASVs that had significantly higher (logit difference >0) and lower (logit difference <0) relative abundance in the biofilms and medium of the enrichments at 30 MPa (red) after 34 days (n = 6) as compared to the lower pressures (0.1–12 MPa, blue) after 20 days (n = 18).
Fig 7
Fig 7
Phylogenetic relationships among the high-pressure-surviving isolates, closely related isolates, and selected piezophiles. The phylogenetic tree was constructed using the RAxML software (maximum likelihood), using a nucleotide substitution model with a gamma distribution of various positions (GTR + Γ). The red asterisk denotes known piezophiles.

References

    1. Barnhart KR, Miller CR, Overeem I, Kay JE. 2016. Mapping the future expansion of Arctic open water. Nat Clim Change 6:280–285. doi: 10.1038/nclimate2848 - DOI
    1. Smith LC, Stephenson SR. 2013. New Trans-Arctic shipping routes navigable by midcentury. Proc Natl Acad Sci U S A 110:E1191–E1195. doi: 10.1073/pnas.1214212110 - DOI - PMC - PubMed
    1. Gautier DL, Bird KJ, Charpentier RR, Grantz A, Houseknecht DW, Klett TR, Moore TE, Pitman JK, Schenk CJ, Schuenemeyer JH, Sørensen K, Tennyson ME, Valin ZC, Wandrey CJ. 2009. Assessment of undiscovered oil and gas in the Arctic. Science 324:1175–1179. doi: 10.1126/science.1169467 - DOI - PubMed
    1. Brooijmans RJW, Pastink MI, Siezen RJ. 2009. Hydrocarbon-degrading bacteria: the oil-spill clean-up crew. Microb Biotechnol 2:587–594. doi: 10.1111/j.1751-7915.2009.00151.x - DOI - PMC - PubMed
    1. Wolfe DA, Hameedi MJ, Galt JA, Watabayashi G, Short J, O’Claire C, Rice S, Michel J, Payne JR, Braddock J, Hanna S, Sale D. 1994. The fate of the oil spilled from the Exxon Valdez. Environ Sci Technol 28:560A–568A. doi: 10.1021/es00062a712 - DOI - PubMed

Publication types