. 2023 Nov 21;95(46):17028-17036.
doi: 10.1021/acs.analchem.3c03719. Epub 2023 Nov 9.

High-Throughput Liquid Chromatographic Analysis Using a Segmented Flow Injector with a 1 s Cycle Time

Affiliations

High-Throughput Liquid Chromatographic Analysis Using a Segmented Flow Injector with a 1 s Cycle Time

Devin M Makey et al. Anal Chem. .

Abstract

High-throughput screening (HTS) workflows are revolutionizing many fields, including drug discovery, reaction discovery and optimization, diagnostics, sensing, and enzyme engineering. Liquid chromatography (LC) is commonly deployed during HTS to reduce matrix effects, distinguish isomers, and preconcentrate prior to detection, but LC separation time often limits throughput. Although subsecond LC separations have been demonstrated, they are rarely utilized during HTS due to limitations associated with the speed of common autosamplers. In this work, these limits are overcome by utilizing droplet microfluidics for sample introduction. In the method, a train of samples segmented by air are continuously pumped into the inlet of an LC injection valve that is actuated once each sample fills the sample loop. Coupled with 2.1 mm diameter × 5 mm long columns packed with 2.7 μm superficially porous C18 particles operated at 5 mL/min, the injector enabled separation of 3 components at 1 s/sample and analysis of a 96-well plate in 1.6 min with <2% peak area relative standard deviation. Analyte-dependent carryover was minimized by including wash droplets composed of organic solvent in between sample droplets. High-throughput LC coupled with mass spectrometric detection using the segmented flow injector was applied to a screen of inhibitors of a cytochrome P450-catalyzed hydroxylation reaction. Measurements of the reaction substrate and product concentrations made using fast LC with the segmented flow injector correlated well with measurements made using a more conventional, 3 min LC method. These results demonstrate the potential for droplet microfluidics to be used for sample introduction during high-throughput LC analysis.


Figures
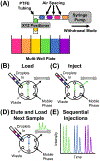
Figure 1.
Figure 1.
Overview of high-throughput LC using a segmented flow injector. Droplets are formed in a capillary tube from a multiwell plate using a syringe pump in withdrawal mode (A). Air was used as the carrier fluid between individual sample plugs. The resulting train of samples was infused into a standard six-port injection valve using a syringe pump in infusion mode. Once a droplet had filled the sample loop (B), the valve was switched to the inject position (C). The valve was immediately switched back to the initial position so the next sample plug could fill the loop while the previous sample eluted from the column (D). The process was repeated for the remaining sample plugs and discrete separations were observed for each injection (E).
Figure 2.
Figure 2.
High-throughput LC analysis of standard three-component mixtures. 96 droplets containing a mixture of thiourea, acetophenone, and propiophenone were generated from a well plate, infused into the valve, and injected every (A) 1.6 s and (B) 1.0 s. Injections were highly repeatable, as the RSDs of peak area measurements were between 0.5 and 1.0% in panel (A) and 1.1 and 1.2% in panel (B). The same mixture of thiourea, acetophenone, and propiophenone was diluted at four levels and deposited into a well plate. 96 droplets with varying analyte concentrations were generated from the plate, infused into the valve, and injected every (C) 1.6 s and (D) 1.0 s. The mobile phase was 35/65 ACN/H2O with 0.1% FA at 3 mL/min in panels (A) and (C) and 40/60 ACN/H2O with 0.1% FA at 5 mL/min in panels (B) and (D). The column temperature was 70 °C. Detection was performed by monitoring absorbance at 254 nm.
Figure 3.
Figure 3.
Assessing sample carryover. (A) Alternating injections of a mixture of thiourea, propiophenone, and acetophenone and an H2O blank. (B) Zoomed-in view of panel (A). (C) Alternating injections of a mixture of thiourea, propiophenone, and acetophenone, with an ACN wash droplet (not injected) when an ACN wash droplet was placed between each sample or blank. (D) Alternating injections of a mixture of acetaminophen, caffeine, and acetylsalicylic acid and an H2O blank. (E) Zoomed-in view of panel (D). (F) Alternating injections of a mixture of acetaminophen, caffeine, and acetylsalicylic acid when an ACN wash droplet was placed in between each sample or blank. Timing of sample injections, blank injections, and wash droplets was as follows: S, Sample injection; B, H2O blank injection; W, ACN wash (no injection). Detection was performed by monitoring absorbance at 210 nm for panels (A–C) and 254 nm for panels (D–F).
Figure 4.
Figure 4.
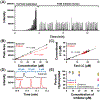
Screening inhibitors of cytochrome P450-catalyzed bentazon hydroxylation. (A) Total ion chromatogram showing signals resulting from the screening experiment. (B) 10-Point calibration curves for bentazon and 6-hydroxybentazon ranging from 0.1 to 50 μM in concentration. (C) Correlation between concentrations measured using fast (6 s per sample) and conventional (3 min per sample) LC. (D) Extracted ion chromatograms demonstrating the inhibition of bentazon hydroxylation in the presence of inhibitor A at concentrations indicated in blue. (E) Comparing the inhibitory activity of four inhibitors determined using fast and conventional LC. Conditions for fast LC were as follows: mobile phase, 25/75 ACN/H2O with 0.1% FA; flow rate, 1.5 mL/min; column temperature, 50 °C. Conditions for conventional LC: mobile phase A, H2O with 0.1% FA; mobile phase B, ACN with 0.1% FA; solvent gradient, 5–50–90–90–5–5% B from 0–1–1.01–1.5–1.51–2 min; flow rate, 1.5 mL/min; column temperature, 50 °C; detection, multiple reaction monitoring.
Scheme 1.
Scheme 1.
Cytochrome P450-Catalyzed Conversion of Bentazon to 6-Hydroxybentazon

References

    1. Mennen SM; Alhambra C; Allen CL; Barberis M; Berritt S; Brandt TA; Campbell AD; Castañón J; Cherney AH; Christensen M; et al. Org. Process Res. Dev 2019, 23 (6), 1213–1242.
    1. Blay V; Tolani B; Ho SP; Arkin MR Drug Discovery Today 2020, 25 (10), 1807–1821. - PubMed
    1. Grainger R; Whibley S Org. Process Res. Dev 2021, 25 (3), 354–364.
    1. Santanilla AB; Regalado EL; Pereira T; Shevlin M; Bateman K; Campeau L-C; Schneeweis J; Berritt S; Shi Z-C; Nantermet P; et al. Science 2015, 347 (6217), 49–53. - PubMed
    1. Taylor CJ; Pomberger A; Felton KC; Grainger R; Barecka M; Chamberlain TW; Bourne RA; Johnson CN; Lapkin AA Chem. Rev 2023, 123 (6), 3089–3126. - PMC - PubMed

Publication types

MeSH terms

LinkOut - more resources