. 2023 Dec 22;8(24):e156850.
doi: 10.1172/jci.insight.156850.

FGF23 directly inhibits osteoprogenitor differentiation in Dmp1-knockout mice

Affiliations

FGF23 directly inhibits osteoprogenitor differentiation in Dmp1-knockout mice

Guillaume Courbon et al. JCI Insight. .

Abstract

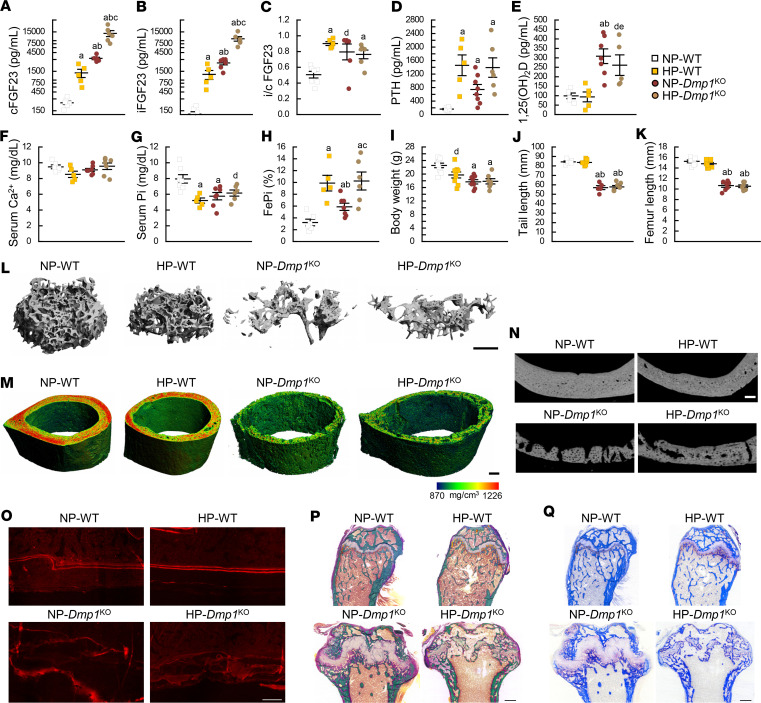
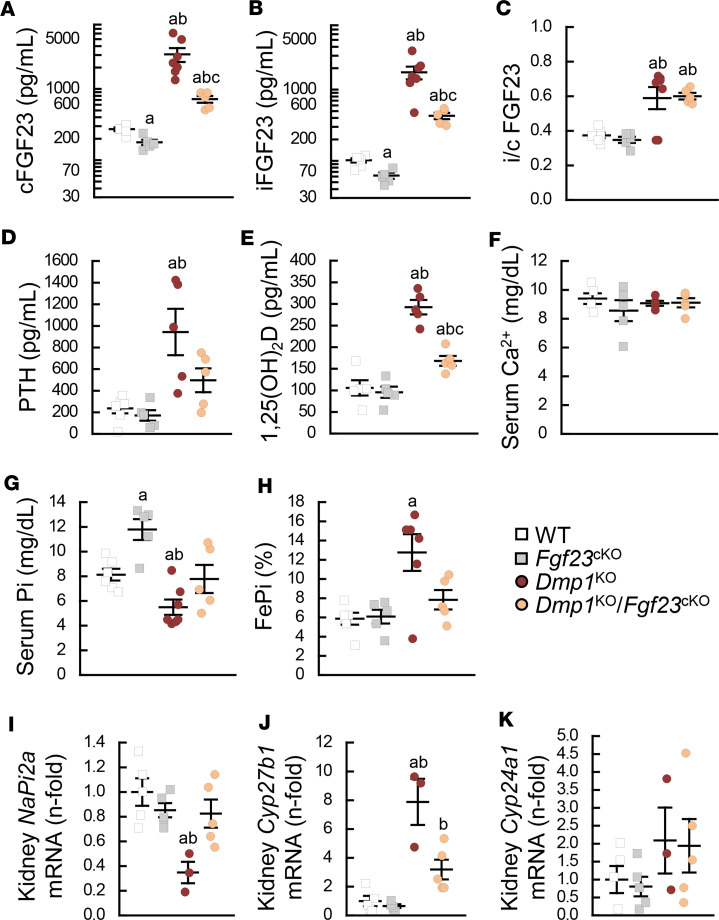
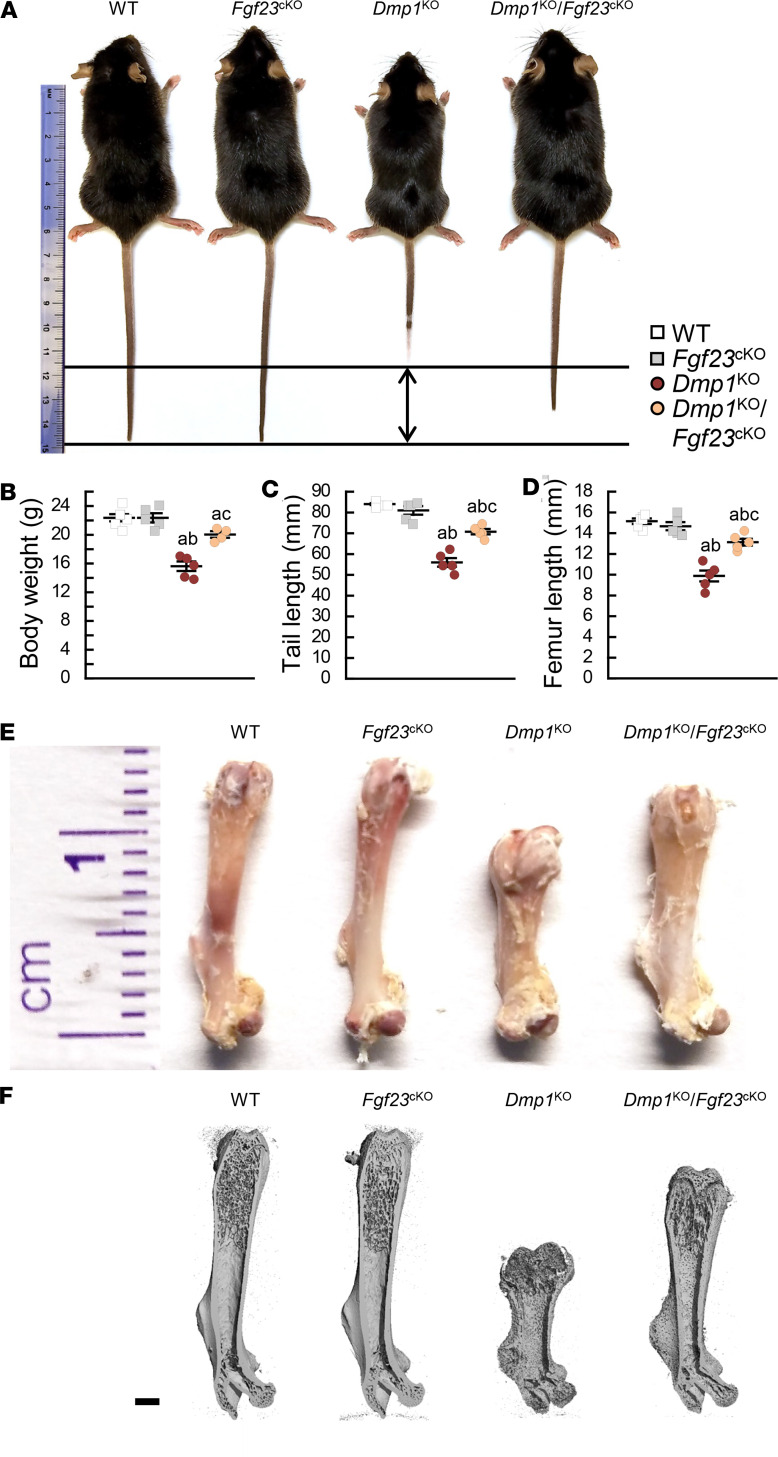
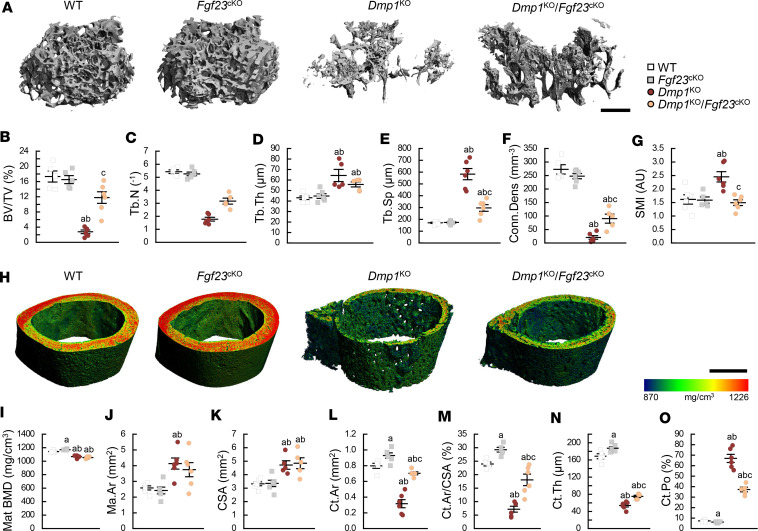
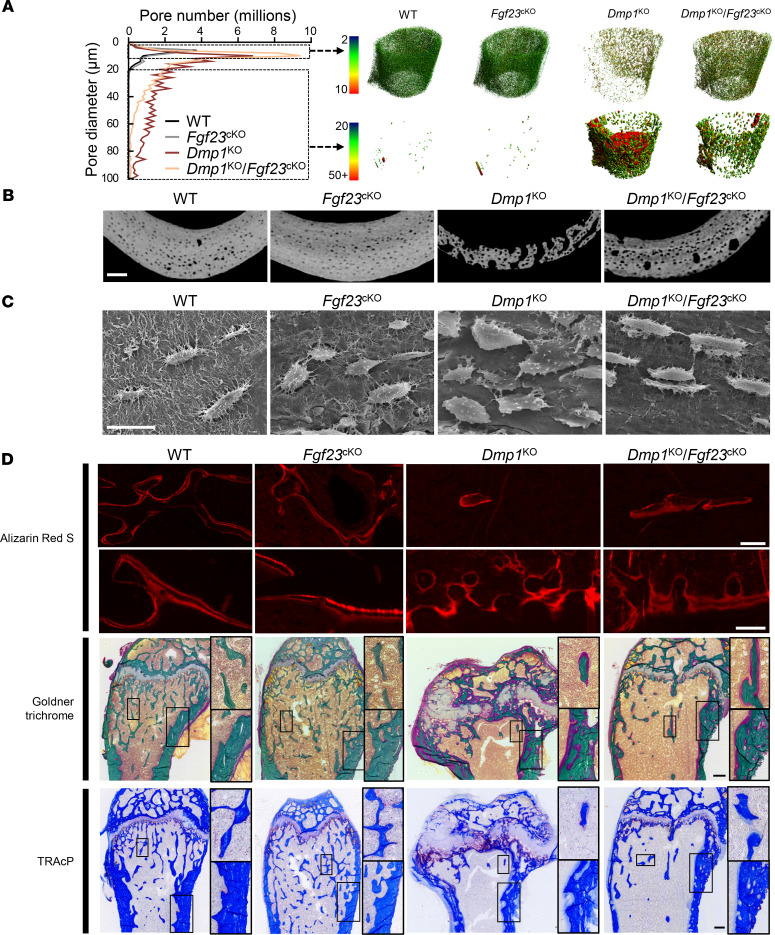
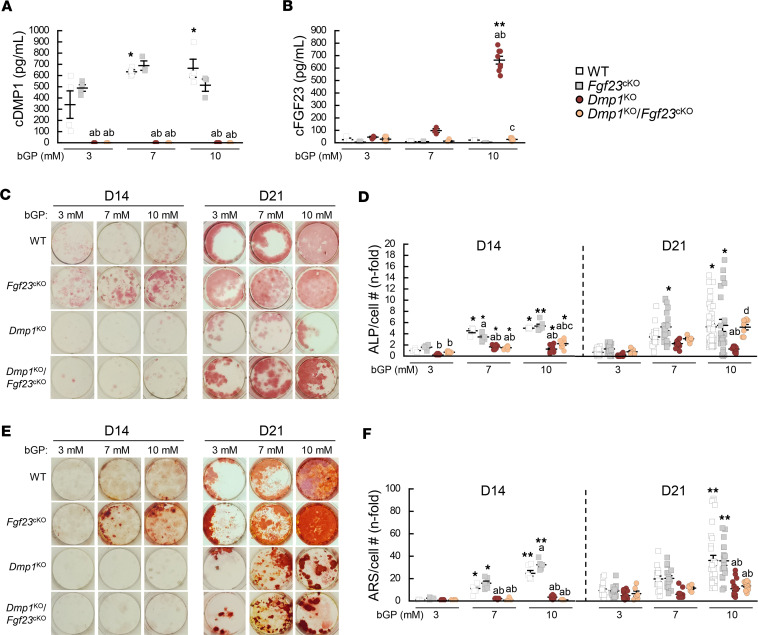
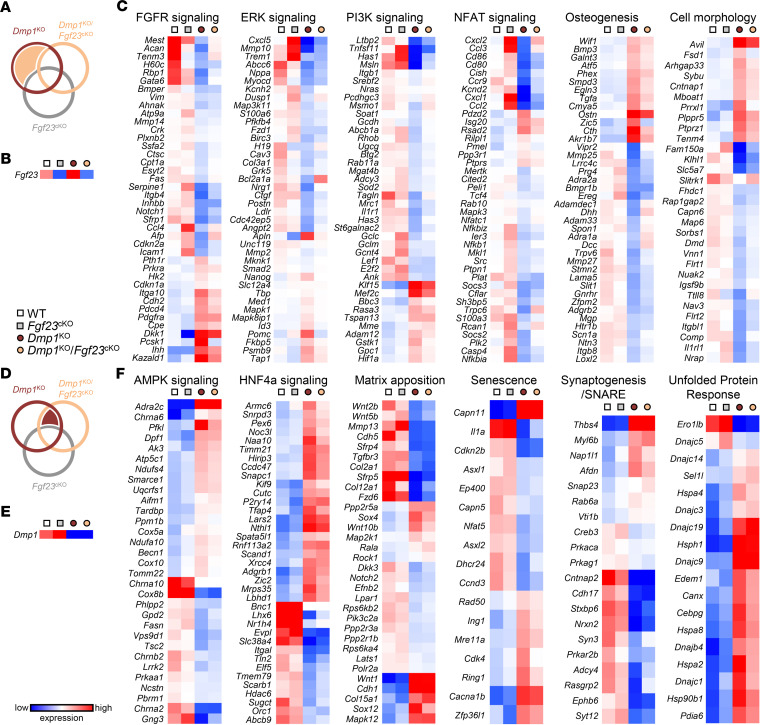
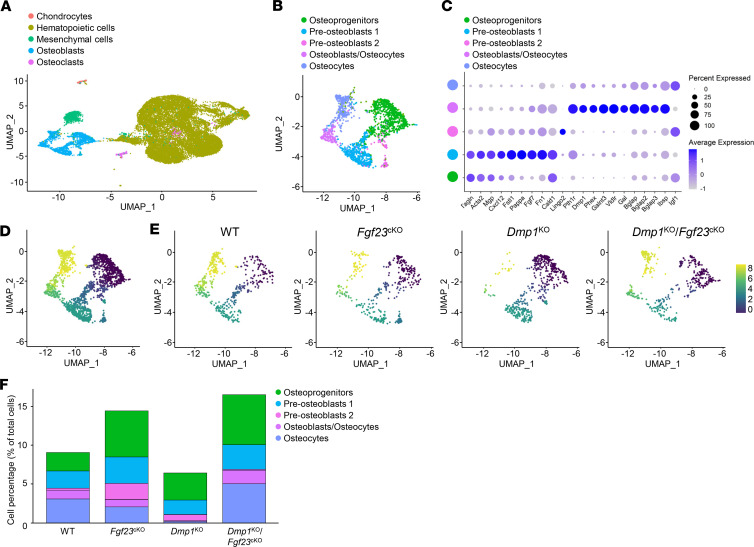
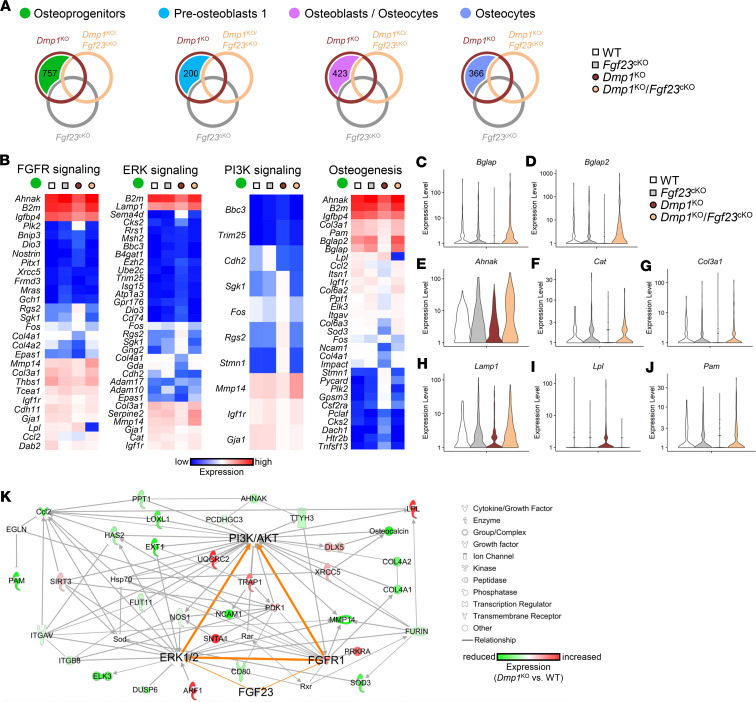
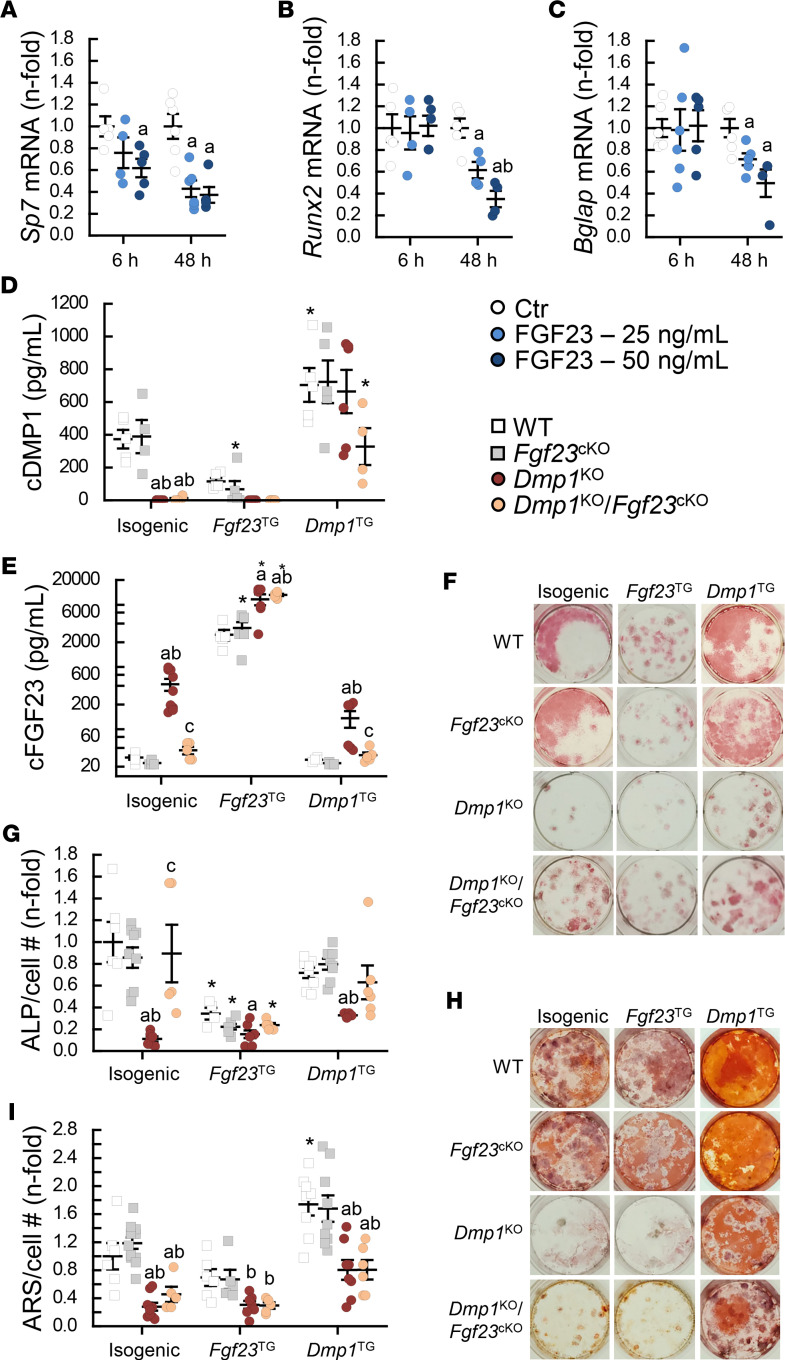
Fibroblast growth factor 23 (FGF23) is a phosphate-regulating (Pi-regulating) hormone produced by bone. Hereditary hypophosphatemic disorders are associated with FGF23 excess, impaired skeletal growth, and osteomalacia. Blocking FGF23 became an effective therapeutic strategy in X-linked hypophosphatemia, but testing remains limited in autosomal recessive hypophosphatemic rickets (ARHR). This study investigates the effects of Pi repletion and bone-specific deletion of Fgf23 on bone and mineral metabolism in the dentin matrix protein 1-knockout (Dmp1KO) mouse model of ARHR. At 12 weeks, Dmp1KO mice showed increased serum FGF23 and parathyroid hormone levels, hypophosphatemia, impaired growth, rickets, and osteomalacia. Six weeks of dietary Pi supplementation exacerbated FGF23 production, hyperparathyroidism, renal Pi excretion, and osteomalacia. In contrast, osteocyte-specific deletion of Fgf23 resulted in a partial correction of FGF23 excess, which was sufficient to fully restore serum Pi levels but only partially corrected the bone phenotype. In vitro, we show that FGF23 directly impaired osteoprogenitors' differentiation and that DMP1 deficiency contributed to impaired mineralization independent of FGF23 or Pi levels. In conclusion, FGF23-induced hypophosphatemia is only partially responsible for the bone defects observed in Dmp1KO mice. Our data suggest that combined DMP1 repletion and FGF23 blockade could effectively correct ARHR-associated mineral and bone disorders.

Keywords: Bone Biology; Bone disease; Genetic diseases; Metabolism; Osteoclast/osteoblast biology.


Figures

Figure 1
Figure 1. Dietary phosphate supplementation aggravates FGF23 excess and bone microarchitecture in Dmp1KO mice.
Serum levels of (A) total FGF23 (cFGF23), (B) intact FGF23 (iFGF23), (C) intact to total FGF23 ratio (i/c FGF23), (D) parathyroid hormone (PTH), (E) 1,25-dihydroxyvitamin D [1,25(OH)2D], (F) calcium (Ca2+), and (G) phosphate (Pi); (H) fractional excretion of Pi (FePi); (I) body weight, (J) tail length, and (K) femur length; 3D-μCT scan reconstruction of (L) distal femur trabecular metaphysis (scale bar = 200 μm); (M) midshaft femur cortical diaphysis (scale bar = 500 μm); (N) 2D μCT analysis of cortical bone porosity (scale bar = 100 μm); (O) red fluorescence microscopy imaging of alizarin red S–stained (ARS-stained) mineralization fronts; (P) bright-field microscopy imaging of modified trichrome Goldner staining; and (Q) tartrate-resistant acidic phosphatase (TRAcP) staining of longitudinal histology sections of distal femur (scale bar = 100 μm for ARS, 500 μm for Goldner and TRAcP). All analyses were performed in 12-week-old WT (n ≥ 5) and Dmp1KO (n ≥ 5) mice fed a diet containing 0.7% Pi (normal Pi, NP) or 2% Pi (high Pi, HP) from 6 to 12 weeks of age. Values are expressed as mean ± SEM; P < 0.05 vs. aNP-WT, bHP-WT, cNP-Dmp1KO; P < 0.1 vs. dNP-WT, eHP-WT. Statistical tests were ANOVA test followed by post hoc t tests and multiple-testing correction using Holm-Bonferroni method.
Figure 2
Figure 2. Osteocyte-specific deletion of Fgf23 fully corrects hypophosphatemia in Dmp1KO mice.
Serum levels of (A) total FGF23 (cFGF23), (B) intact FGF23 (iFGF23), (C) intact to total FGF23 ratio (i/c FGF23), (D) parathyroid hormone (PTH), (E) 1,25-dihydroxyvitamin D [1,25(OH)2D], (F) calcium (Ca2+), and (G) phosphate (Pi); (H) fractional excretion of Pi (FePi); and kidney mRNA expression of (I) NaPi2a, (J) Cyp27b1, and (K) Cyp24a1 in 12-week-old WT (n ≥ 5), Fgf23Dmp1-cKO (n ≥ 5), Dmp1KO (n ≥ 3), and Dmp1KO Fgf23Dmp1-cKO (n ≥ 5) mice. Values are expressed as mean ± SEM; P < 0.05 vs. aWT, bFgf23cKO, cDmp1KO. Statistical tests were ANOVA test followed by post hoc t tests and multiple-testing correction using Holm-Bonferroni method.
Figure 3
Figure 3. Osteocyte-specific deletion of Fgf23 partially corrects bone growth in Dmp1KO mice.
(A) Mouse gross appearance, (B) body weight, (C) tail length, (D) femur length, (E) femur gross appearance, and (F) 3D μCT representation of total femur in sagittal plane (scale bar = 1 mm) in 12-week-old WT (n ≥ 6), Fgf23Dmp1-cKO (n ≥ 5), Dmp1KO (n ≥ 5), and Dmp1KO Fgf23Dmp1-cKO (n ≥ 4) mice. Values are expressed as mean ± SEM; P < 0.05 vs. aWT, bFgf23cKO, cDmp1KO. Statistical tests were performed using ANOVA test followed by post hoc t tests and multiple-testing correction using Holm-Bonferroni method.
Figure 4
Figure 4. Osteocyte-specific deletion of Fgf23 partially restores bone microarchitecture in Dmp1KO mice.
3D μCT (A) scan reconstruction of distal femur trabecular metaphysis (scale bar = 500 μm) and (BG) parameters of trabecular bone microarchitecture; (H) scan reconstruction of midshaft femur cortical diaphysis (scale bar = 500 μm) and (IO) parameters of cortical bone microarchitecture. All analyses were performed in 12-week-old WT (n ≥ 5), Fgf23Dmp1-cKO (n ≥ 5), Dmp1KO (n ≥ 5), and Dmp1KO Fgf23Dmp1-cKO (n ≥ 5) mice. Values are expressed as mean ± SEM; P < 0.05 vs. aWT, bFgf23cKO, cDmp1KO. Statistical tests were ANOVA test followed by post hoc t tests and multiple-testing correction using Holm-Bonferroni method. BV/TV, bone volume to tissue volume ratio; Tb.N, trabecular number; Tb.Th, trabecular thickness; Tb.Sp, trabecular separation; Conn.Dens, connectivity density; SMI, structural model index; mat BMD, material bone mineral density; Ma.Ar, marrow area; CSA, cross-sectional area; Ct.Ar, cortical area; Ct.Th, cortical thickness; Ct.Po, cortical porosity.
Figure 5
Figure 5. Osteocyte-specific deletion of Fgf23 partially restores mineralization and lacuno-canalicular network in Dmp1KO mice.
(A and B) High-resolution μCT analysis of cortical bone porosity (scale bar = 100 μm), (C) acid-etched scanning electron microscopy of femur cortical bone (scale bar = 20 μm), (D) red fluorescence microscopy imaging of ARS-stained mineralization fronts (top), and bright-field microscopy imaging of modified trichrome Goldner staining (middle) and tartrate-resistant acidic phosphatase (TRAcP) staining (bottom) of longitudinal histology sections of distal femur (scale bar = 100 μm for ARS, 250 μm for Goldner and TRAcP). For each staining, top (×3.5 original magnification) and bottom (×1.8 original magnification) zoom-in panels represent regions of interest in trabecular and in cortical bone, respectively. All analyses were performed in 12-week-old WT (n ≥ 5), Fgf23Dmp1-cKO (n ≥ 5), Dmp1KO (n ≥ 5), and Dmp1KO Fgf23Dmp1-cKO (n ≥ 5) mice.
Figure 6
Figure 6. Osteocyte-specific deletion of Fgf23 restores osteoblast differentiation but does not restore impaired mineralization in Dmp1KO primary osteoblast cultures.
Bone marrow stromal cells were isolated from 12-week-old WT (n ≥ 3), Fgf23Dmp1-cKO (n ≥ 3), Dmp1KO (n ≥ 3), and Dmp1KO Fgf23Dmp1-cKO (n ≥ 4) mice, then cultured for 14 (D14) and 21 (D21) days in osteoblast differentiation medium containing 3, 7, or 10 mM of beta-glycerophosphate (bGP). Levels of (A) total DMP1 (cDMP1) and (B) total FGF23 (cFGF23) in conditioned media collected at D21. (C and D) Alkaline phosphatase (ALP) staining and quantification and (E and F) alizarin red S (ARS) staining and quantification. Values are expressed as mean ± SEM; P < 0.05 vs. bGP treatment–matched aWT, bFgf23cKO, cDmp1KO, and genotype-matched *3 mM and **7 mM within each time point. dP = 0.1 vs. 10 mM Dmp1KO. Statistical tests were ANOVA test followed by Bonferroni post hoc tests.
Figure 7
Figure 7. Canonical pathways altered in Dmp1KO osteoblasts are differentially regulated by FGF23 and by DMP1.
Bulk RNA-sequencing analysis was performed on bone marrow stromal cells isolated from 12-week-old WT (n = 3), Fgf23Dmp1-cKO (n = 3), Dmp1KO (n = 3), and Dmp1KO Fgf23Dmp1-cKO (n = 3) mice and cultured for 21 days in osteoblast differentiation medium containing 10 mM of beta-glycerophosphate. (A) Venn diagram identifies genes showing altered expression in Dmp1KO but not in Dmp1KO Fgf23cKO osteoblasts (tan area). Heatmaps represent the expression of (B) Fgf23 and (C) genes identified in A and used in Ingenuity Pathway Analysis (IPA; QIAGEN) to define the most represented canonical pathways regulated by FGF23. (D) Venn diagram identifies genes showing altered expression in Dmp1KO and in Dmp1KO Fgf23cKO osteoblasts (burgundy area). Heatmaps represent the expression of (E) Dmp1 and (F) genes identified in D and used in IPA to define the most represented canonical pathways regulated by DMP1. Statistical tests were unpaired t test and corrected by the false discovery rate (P < 0.1).
Figure 8
Figure 8. Osteocyte-specific deletion of Fgf23 restores osteoblast differentiation in Dmp1KO at the single-cell level.
Single-cell RNA-sequencing analysis was performed on bone marrow stromal cells isolated from 12-week-old WT (n = 3), Fgf23Dmp1-cKO (n = 3), Dmp1KO (n = 3), and Dmp1KO Fgf23Dmp1-cKO (n = 3) mice and cultured for 21 days in osteoblast differentiation medium containing 10 mM of beta-glycerophosphate. Uniform manifold approximation and projection (UMAP) plot of (A) total isolated cells and (B) osteoblast lineage cells only. (C) Dot plot of cluster-enriched markers in osteoblastic cells segregated by clusters of differentiation. Pseudotime analysis of osteoblastic cluster from (D) all groups combined and (E) segregated by group. (F) Percentage of osteoblast-like cells in the total number of isolated cells segregated by cluster of differentiation and by group.
Figure 9
Figure 9. FGF23 targets osteoprogenitors via FGFR/ERK/PI3K signaling.
Single-cell RNA-sequencing analysis was performed on bone marrow stromal cells isolated from 12-week-old WT (n = 3), Fgf23Dmp1-cKO (n = 3), Dmp1KO (n = 3), and Dmp1KO Fgf23Dmp1-cKO (n = 3) mice and cultured for 21 days in osteoblast differentiation medium containing 10 mM of beta-glycerophosphate. (A) Venn diagram identifies genes showing altered expression in Dmp1KO but not in Dmp1KO Fgf23cKO osteoblasts (colored area) in each cluster of differentiation. (B) Heatmaps represent the expression of genes identified in A in the osteoprogenitor cluster (green dot) and used in Ingenuity Pathway Analysis (IPA) to define the most represented canonical pathways regulated by FGF23. (CJ) Violin plots representing the expression of most regulated target genes in Dmp1KO and corrected in Dmp1KO Fgf23cKO osteoprogenitors. (K) IPA gene network analysis showing most connected gene targets in the osteoprogenitor cluster and identifying FGF receptor 1 (FGFR1), ERK1/2, and PI3K/AKT as common regulators of these targets. Statistical tests were Mann-Whitney’s U test and corrected by the false discovery rate (P < 0.1).
Figure 10
Figure 10. FGF23 directly inhibits osteoblast differentiation.
(AC) mRNA expression of markers of osteoblast differentiation in MC3T3-E1 osteoblasts cultured for 21 days and treated with recombinant FGF23 (0, 25, and 50 ng/mL) for the last 6 and 48 hours of culture (n ≥ 4). Levels of (D) total DMP1 (cDMP1) and (E) total FGF23 (cFGF23) measured by ELISA in conditioned culture media from bone marrow stromal cells (BMSCs) isolated from 12-week-old WT (n ≥ 4), Fgf23Dmp1-cKO (n ≥ 5), Dmp1KO (n ≥ 5), and Dmp1KO Fgf23Dmp1-cKO (n ≥ 5) mice, then cocultured for 21 days with BMSCs isolated from the same group (isogenic), or immortalized BMSCs displaying genetic overexpression of Fgf23 (Fgf23TG) or Dmp1 (Dmp1TG). (F and G) Alkaline phosphatase (ALP) staining and quantification and (H and I) alizarin red S (ARS) staining and quantification. Values are expressed as mean ± SEM; P < 0.05 vs. (AC) time point–matched aCtr, bFGF23 25 ng/mL, (DI) culture-matched aWT, bFgf23cKO, cDmp1KO, and *genotype-matched isogenic. Statistical tests were ANOVA test followed by post hoc t tests and multiple-testing correction using Holm-Bonferroni method (AC) and by Bonferroni’s post hoc tests (DI).

References

    1. Liu S, et al. Fibroblast growth factor 23 is a counter-regulatory phosphaturic hormone for vitamin D. J Am Soc Nephrol. 2006;17(5):1305–1315. doi: 10.1681/ASN.2005111185. - DOI - PubMed
    1. Shimada T, et al. FGF-23 is a potent regulator of vitamin D metabolism and phosphate homeostasis. J Bone Miner Res. 2004;19(3):429–435. doi: 10.1359/JBMR.0301264. - DOI - PubMed
    1. ADHR Consortium. Autosomal dominant hypophosphataemic rickets is associated with mutations in FGF23. Nat Genet. 2000;26(3):345–348. doi: 10.1038/81664. - DOI - PubMed
    1. Jonsson KB, et al. Fibroblast growth factor 23 in oncogenic osteomalacia and X-linked hypophosphatemia. N Engl J Med. 2003;348(17):1656–1663. doi: 10.1056/NEJMoa020881. - DOI - PubMed
    1. Feng JQ, et al. Loss of DMP1 causes rickets and osteomalacia and identifies a role for osteocytes in mineral metabolism. Nat Genet. 2006;38(11):1310–1315. doi: 10.1038/ng1905. - DOI - PMC - PubMed

Publication types

Supplementary concepts