. 2023 Nov 10;382(6671):eadf0966.
doi: 10.1126/science.adf0966. Epub 2023 Nov 10.

Aster-dependent nonvesicular transport facilitates dietary cholesterol uptake

Affiliations

Aster-dependent nonvesicular transport facilitates dietary cholesterol uptake

Alessandra Ferrari et al. Science. .

Abstract

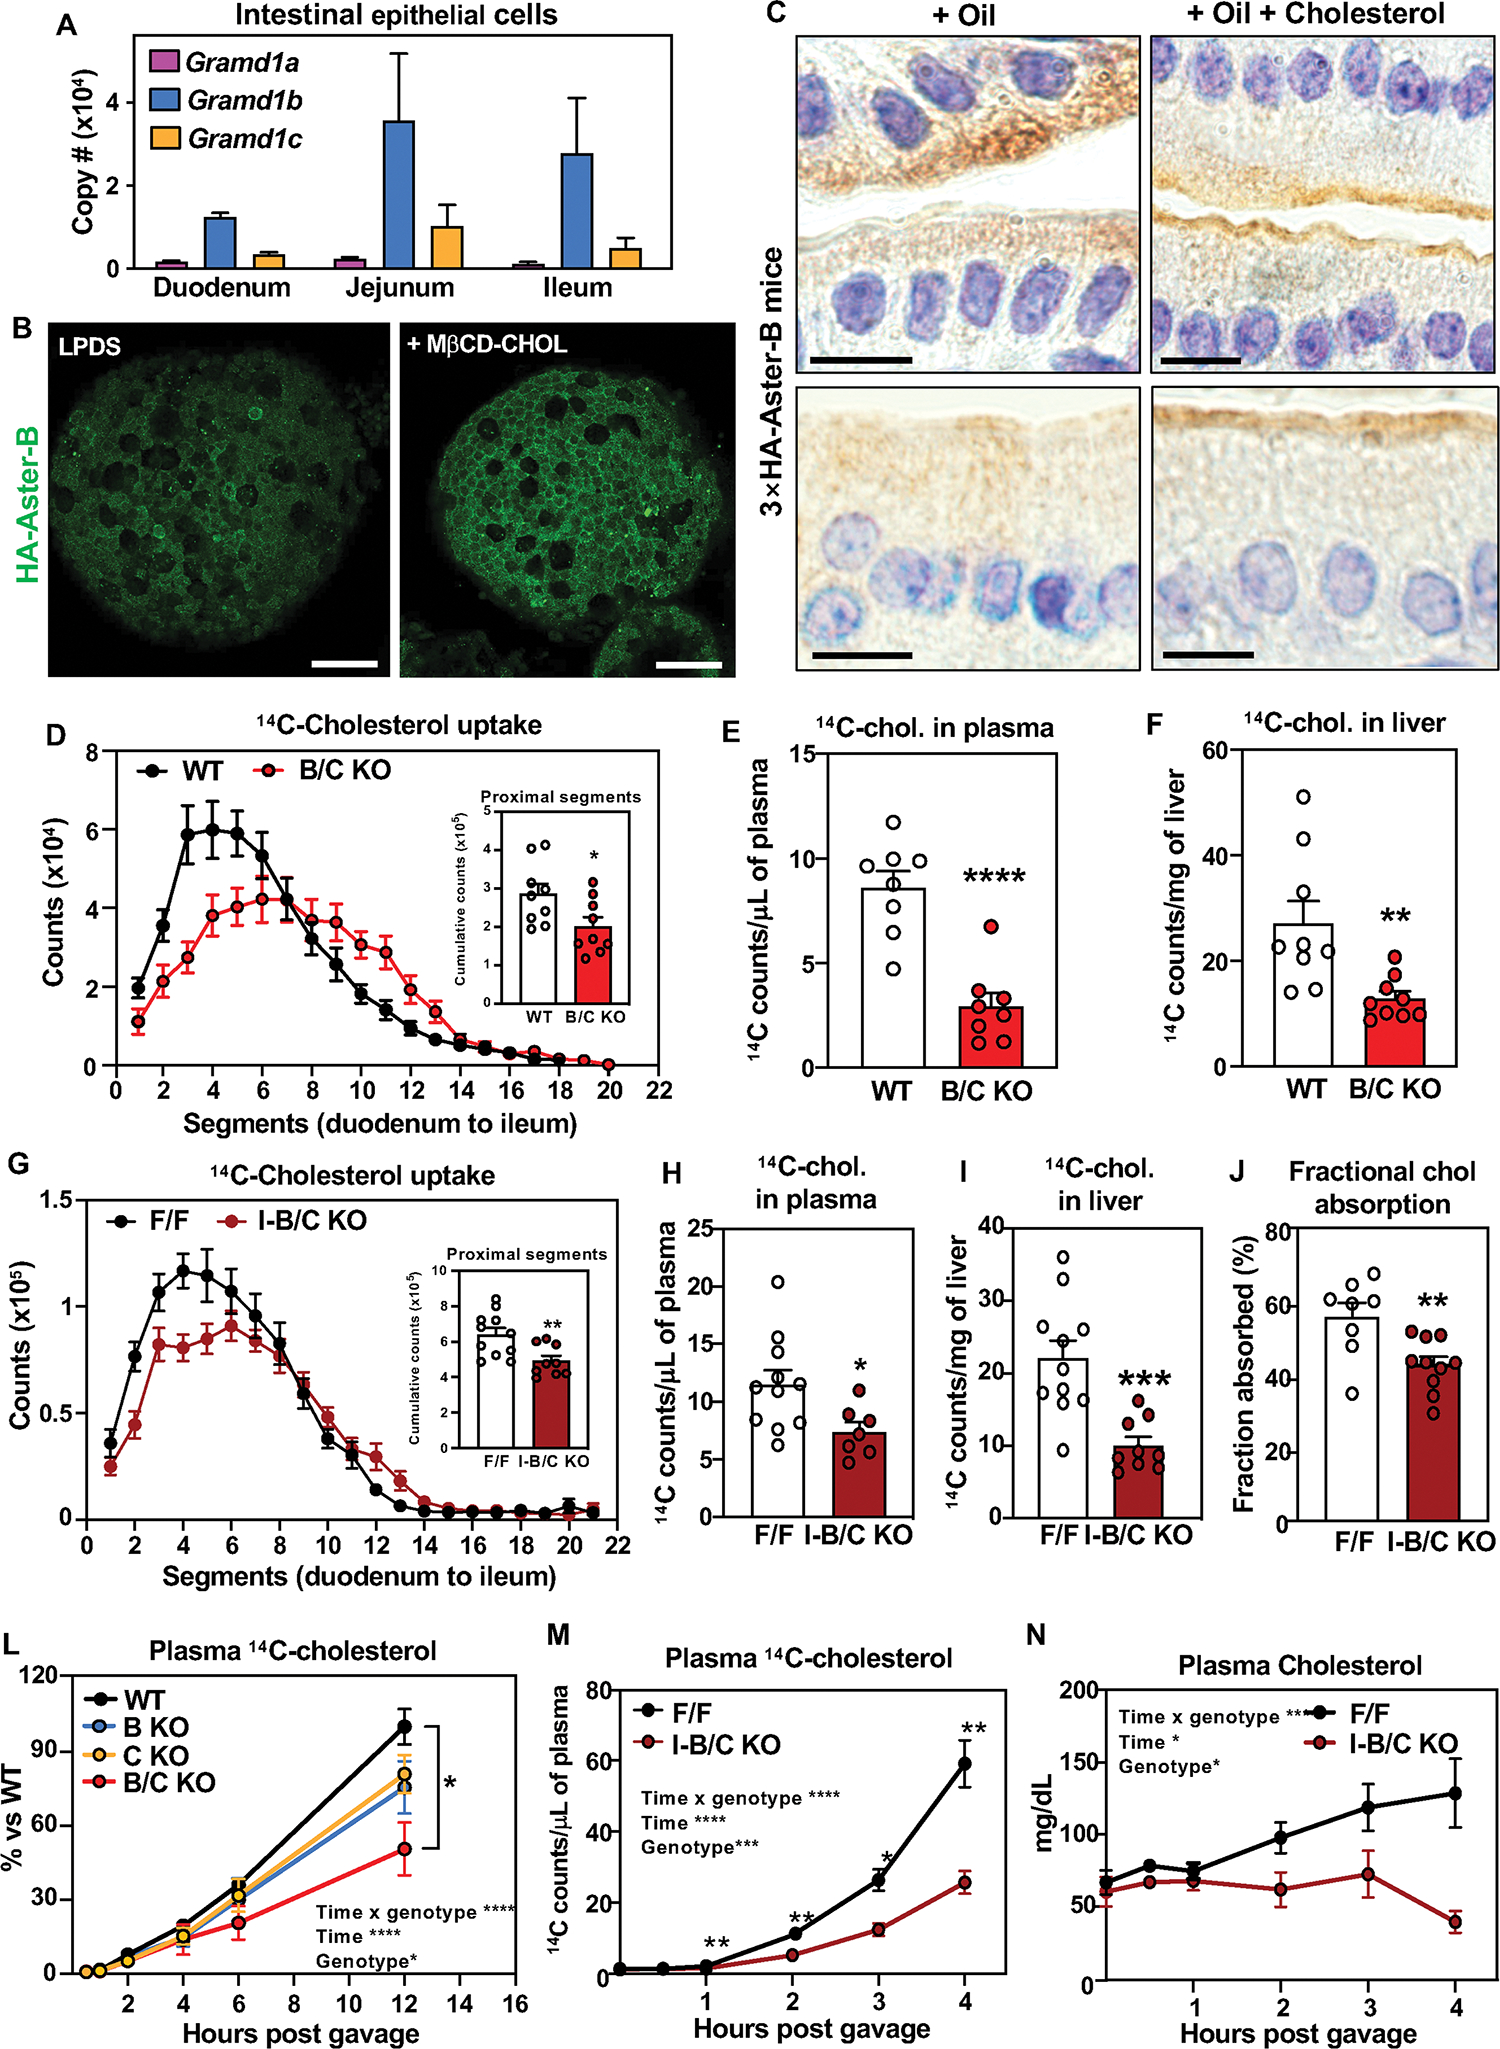
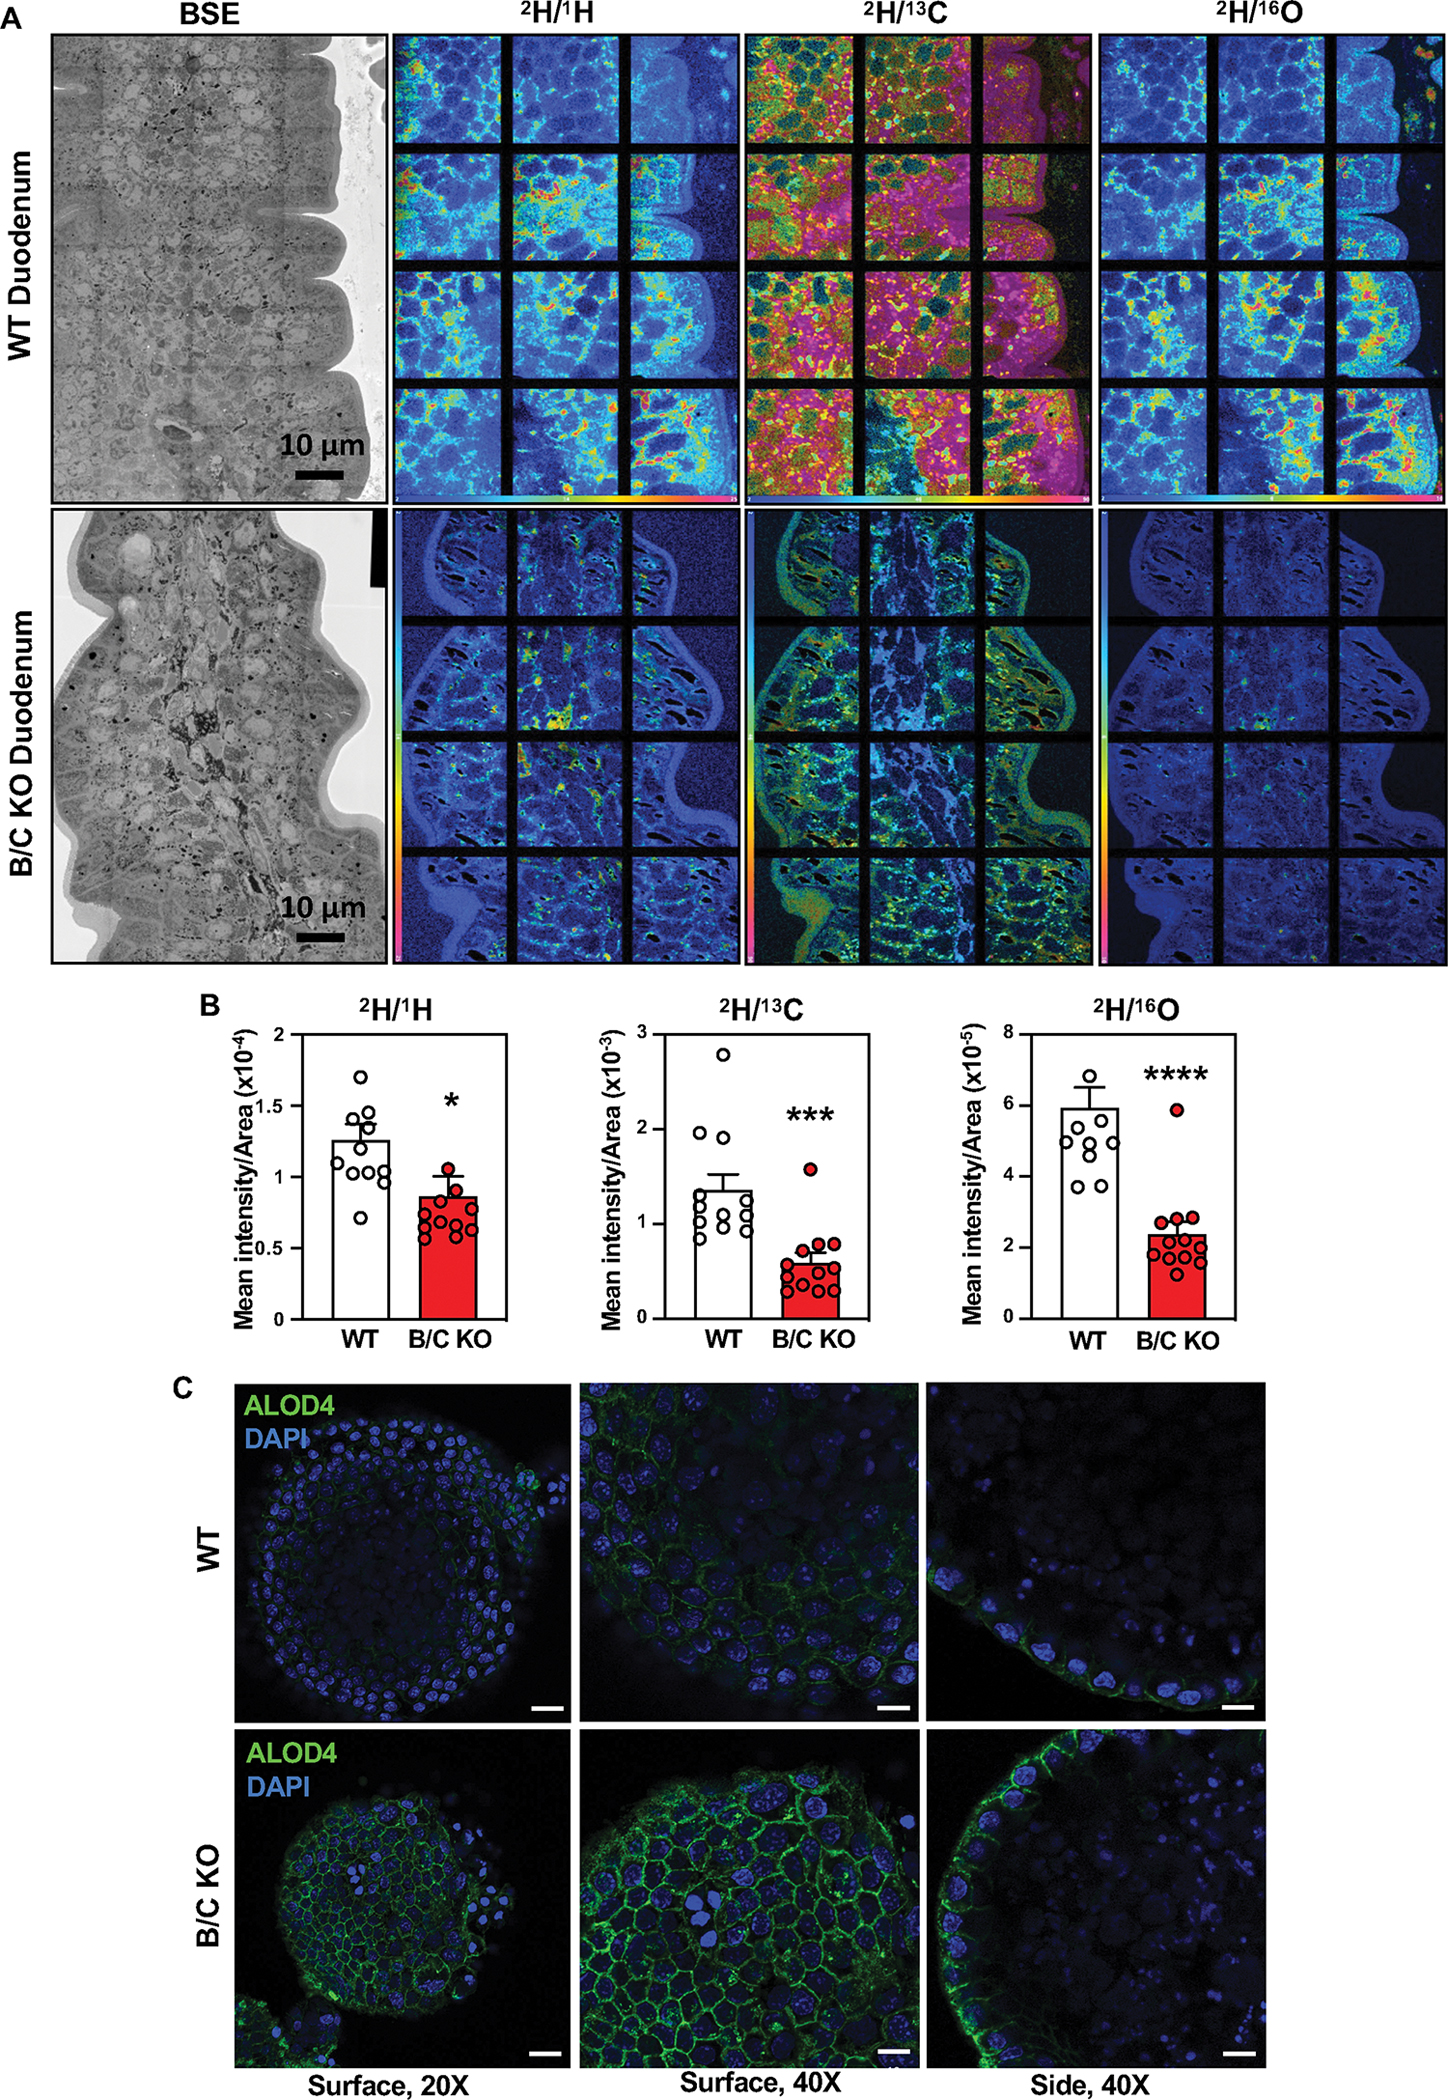
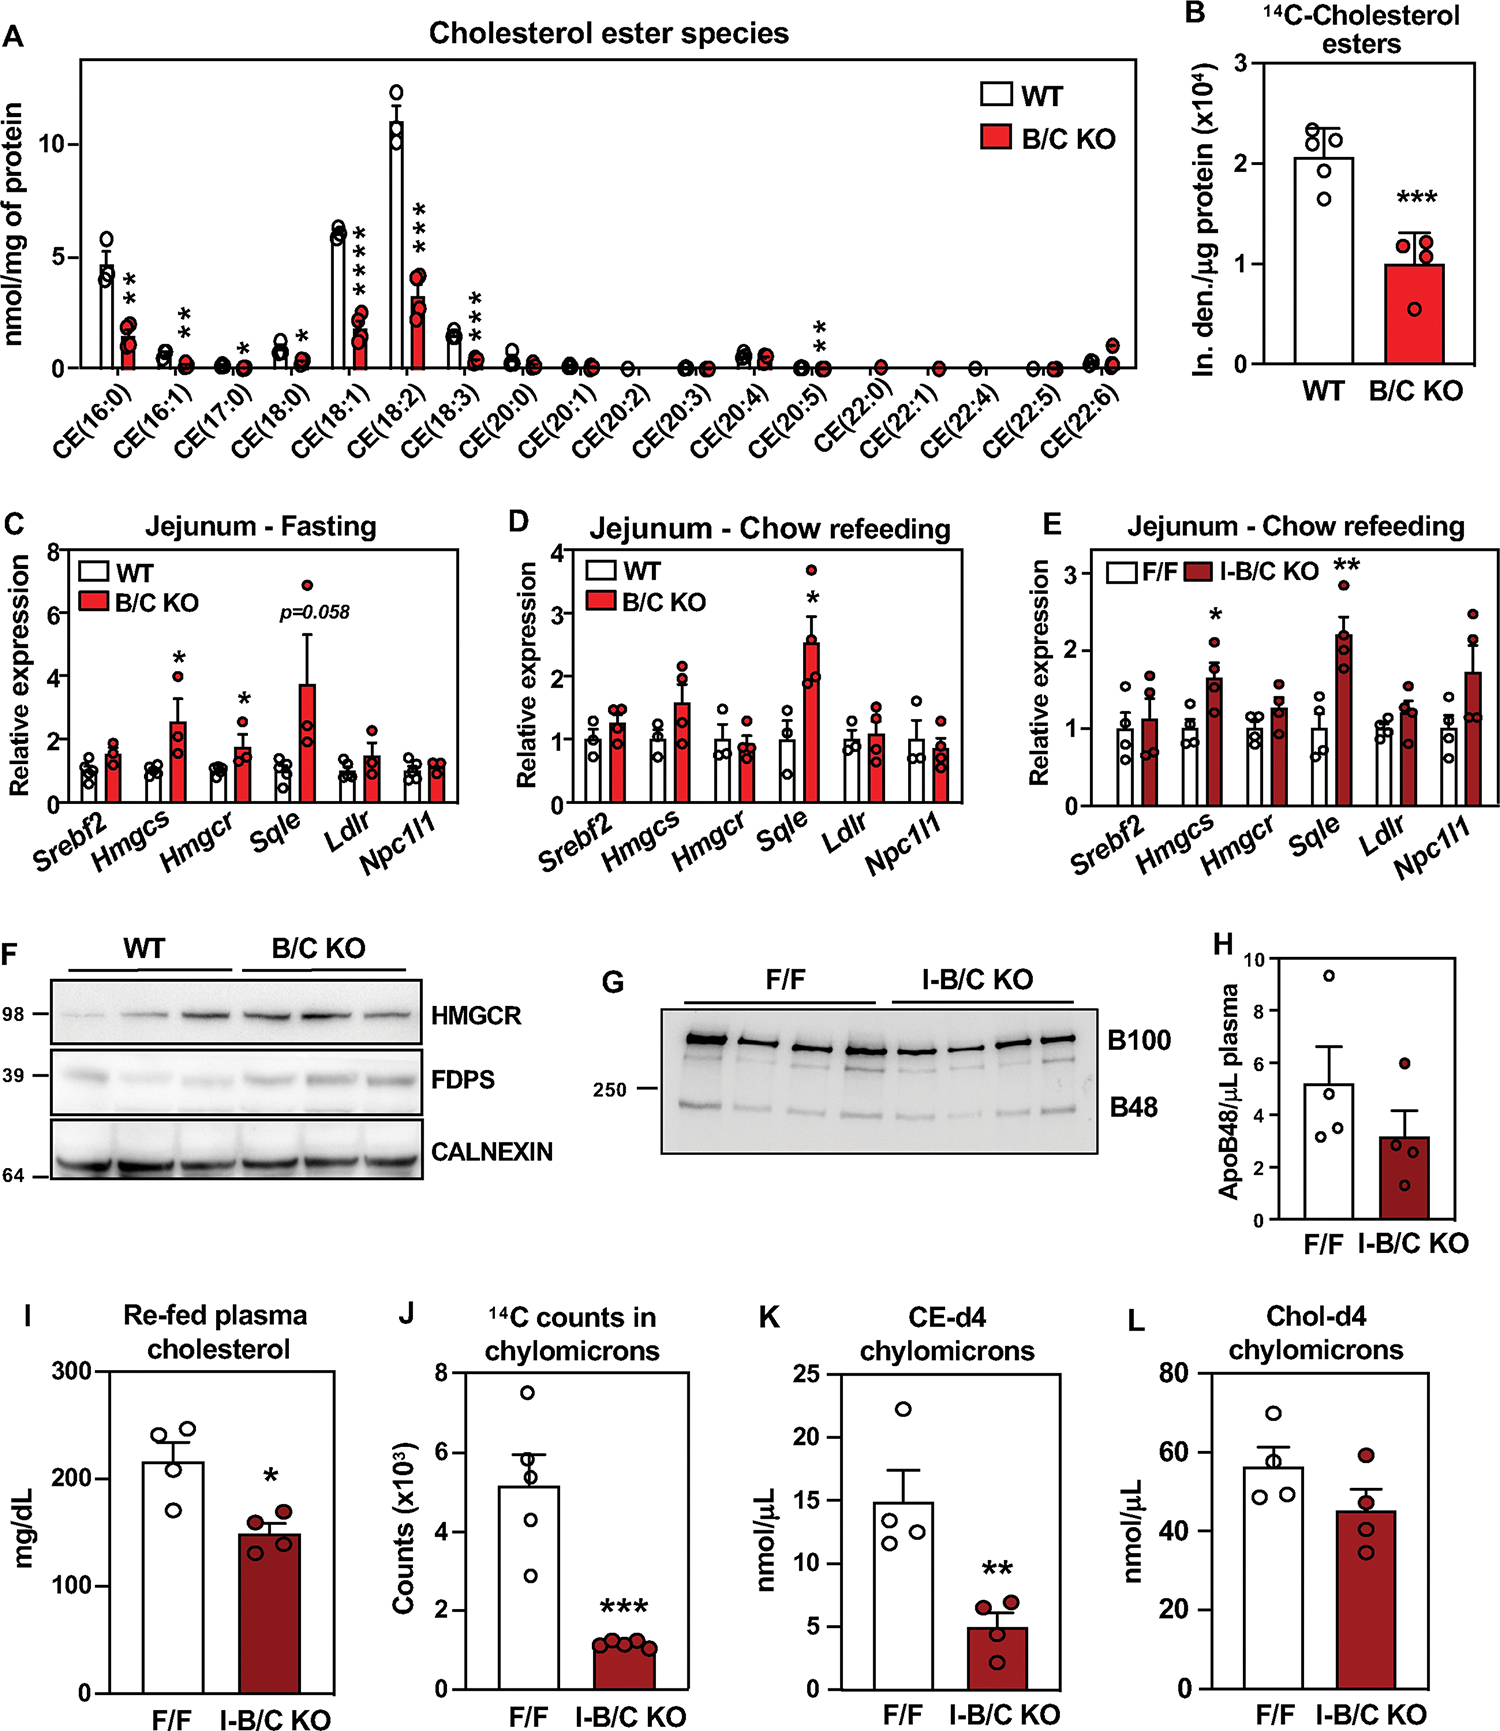
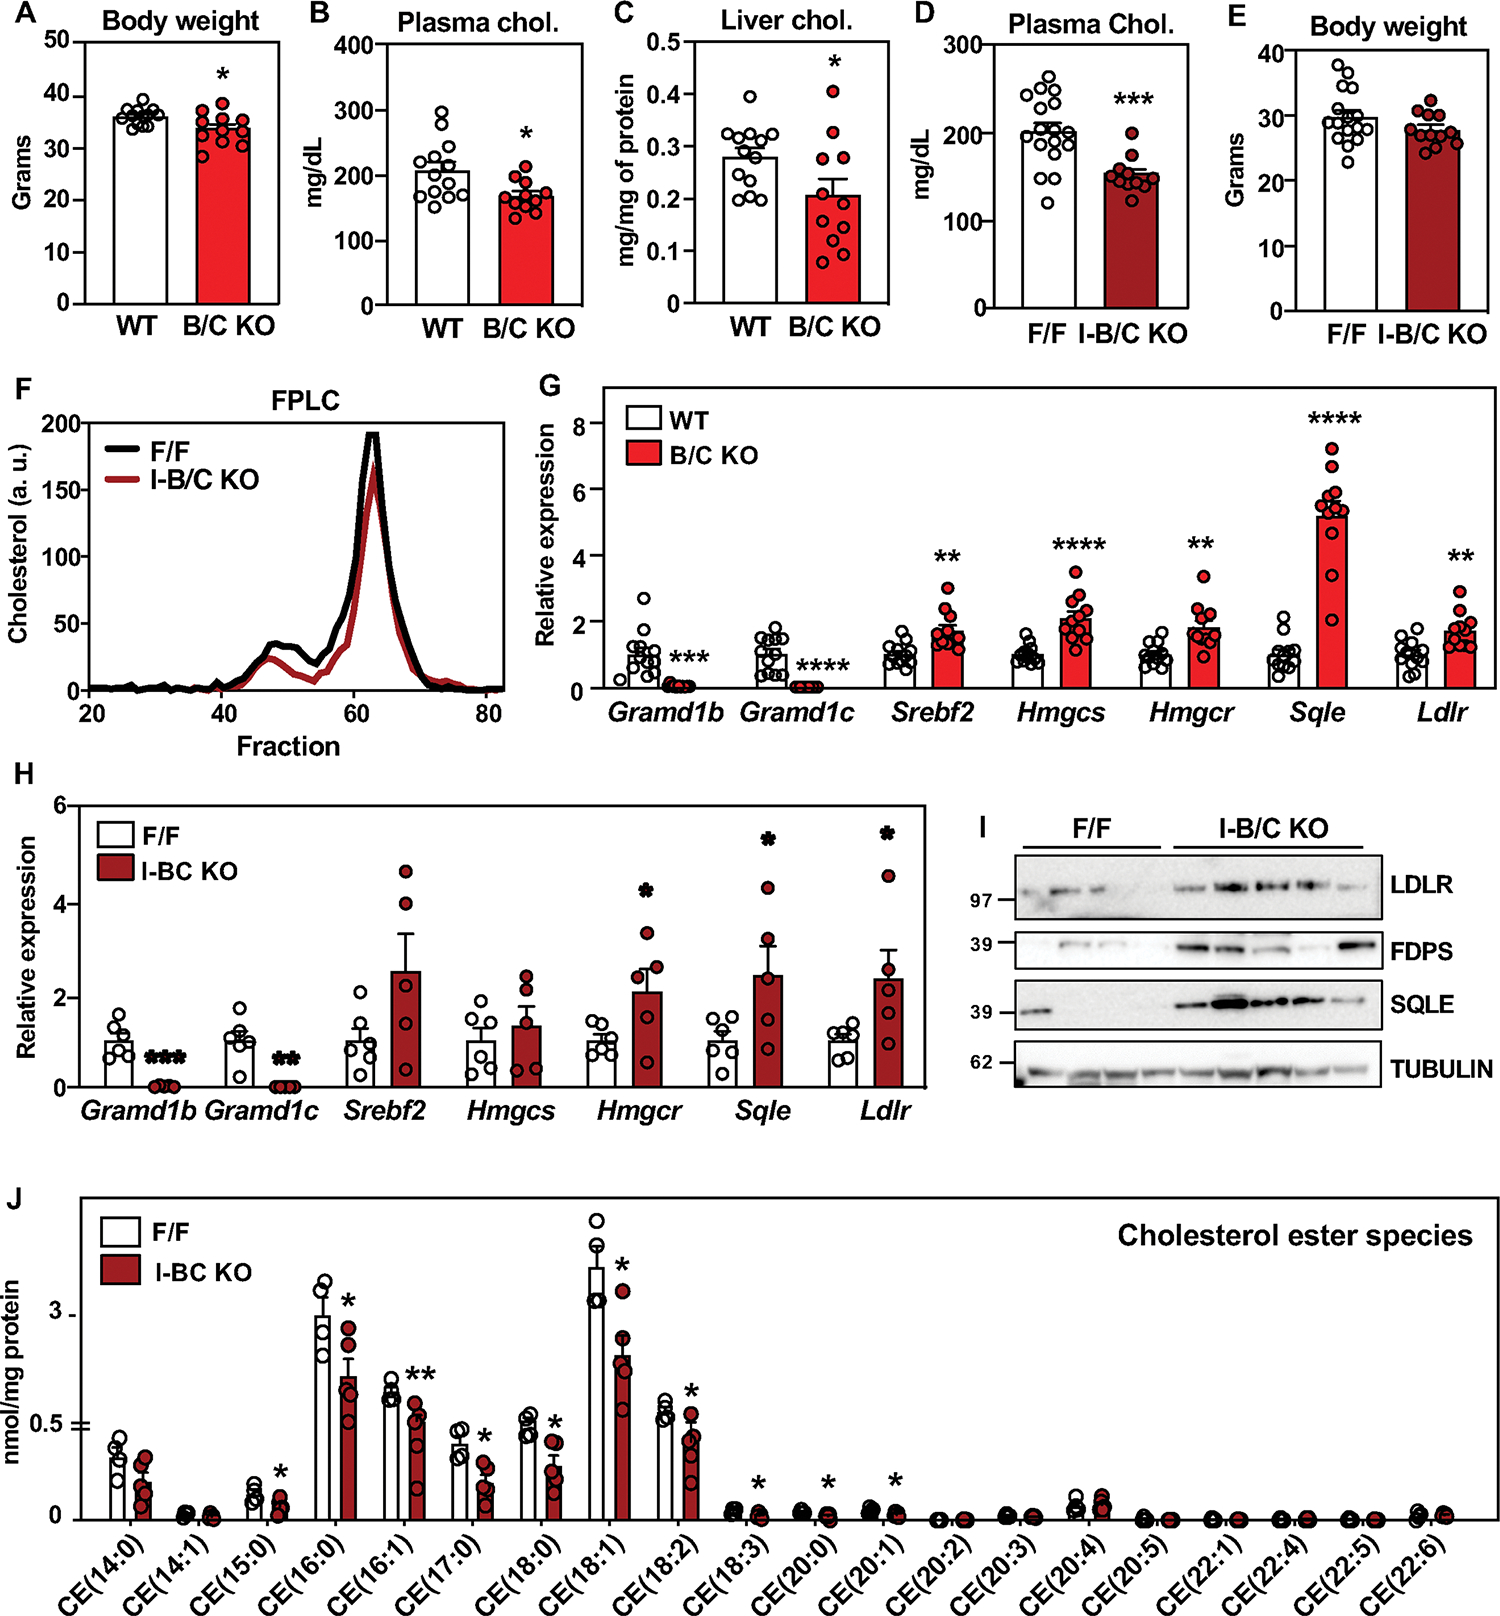
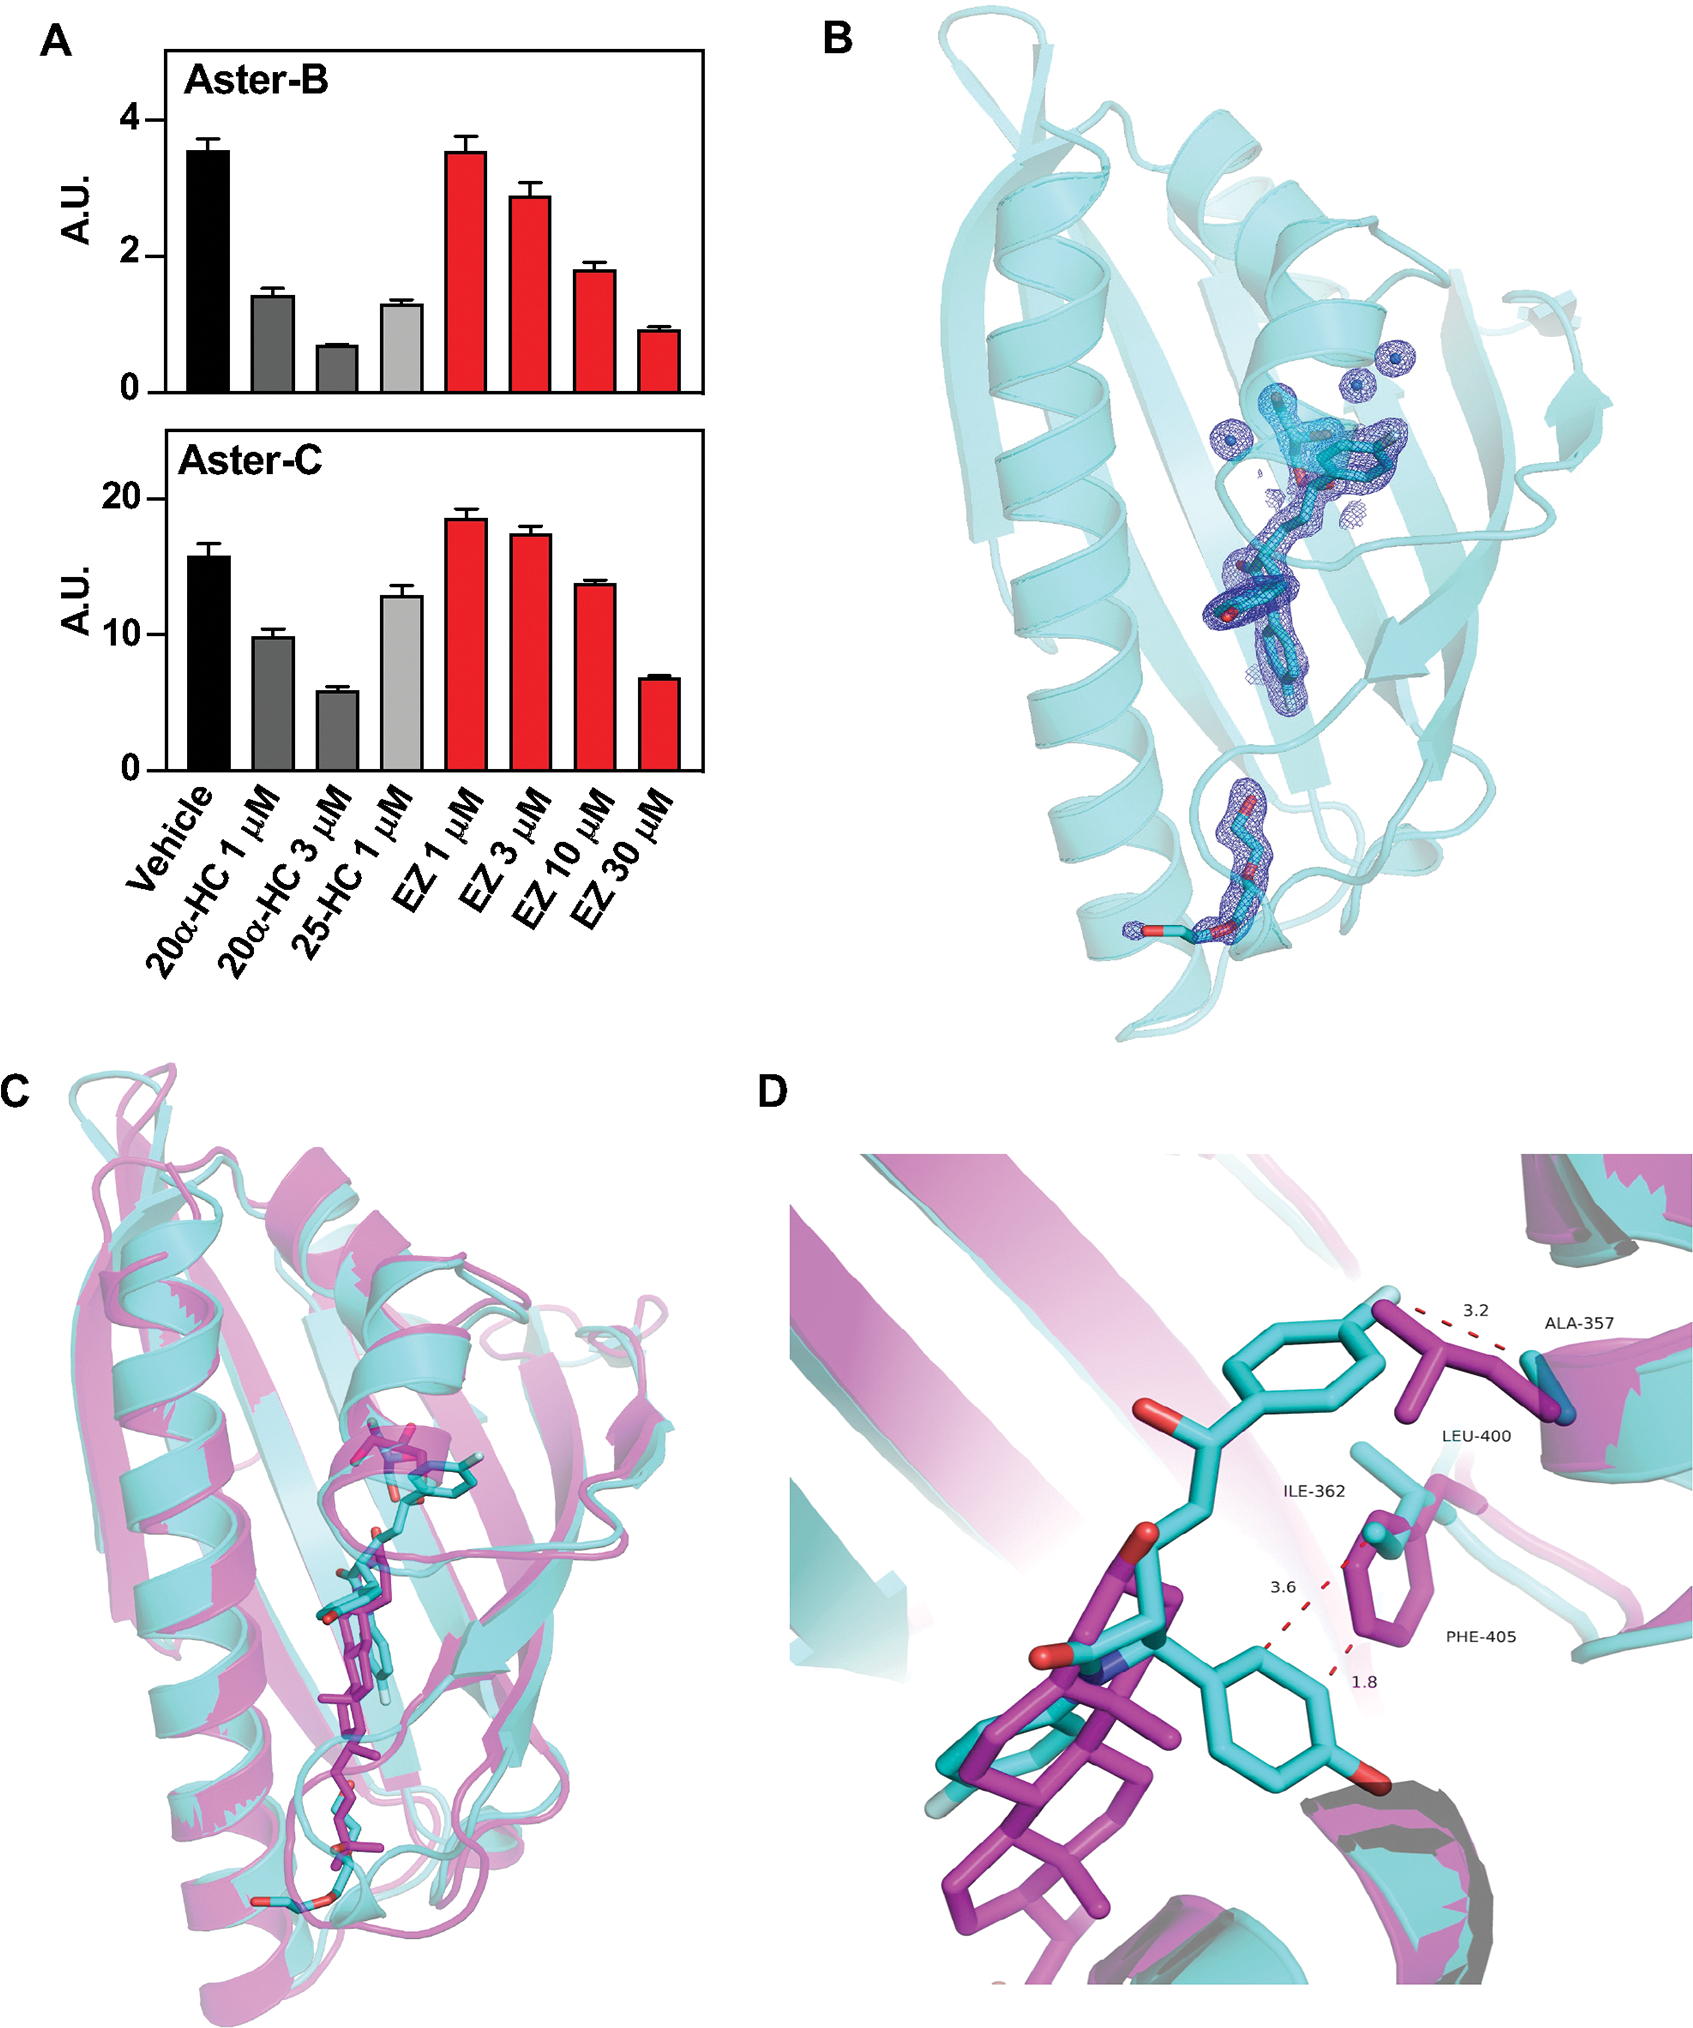
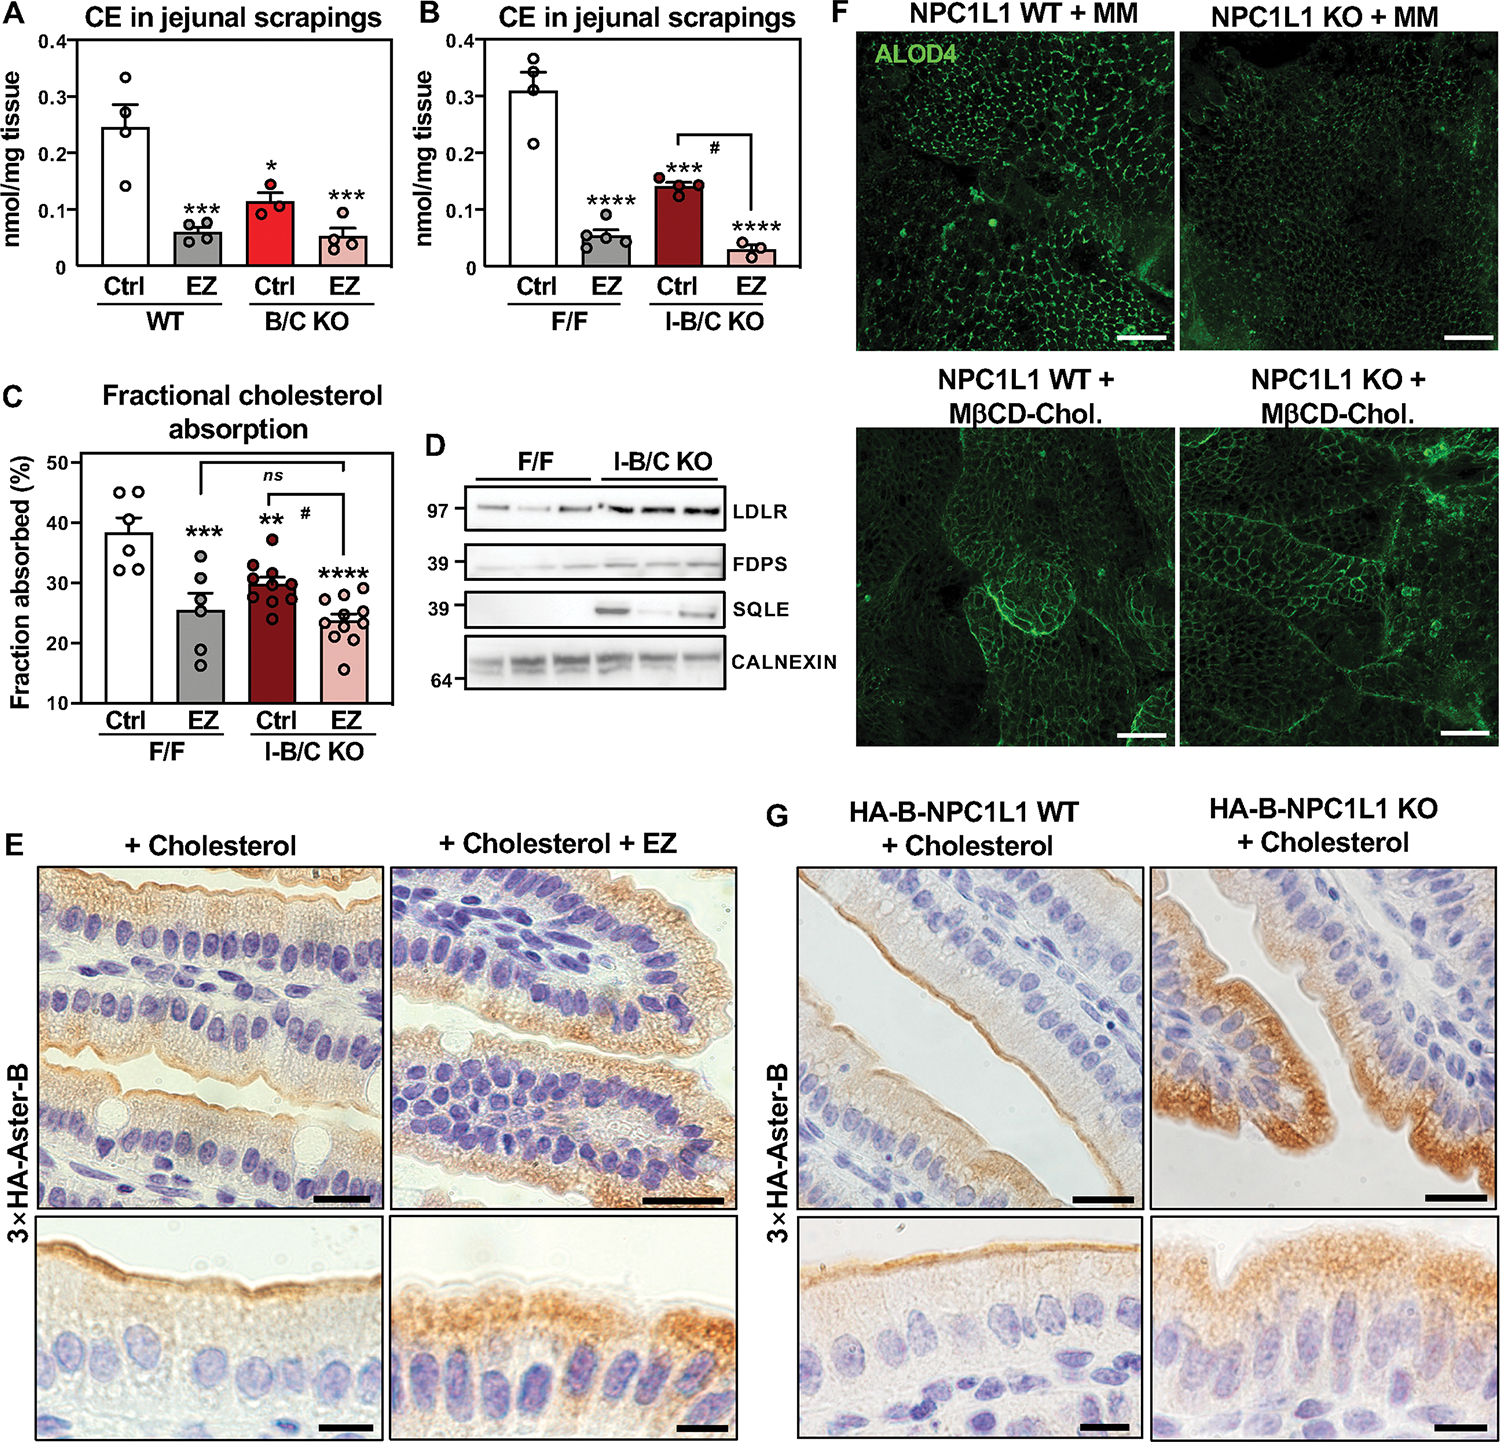
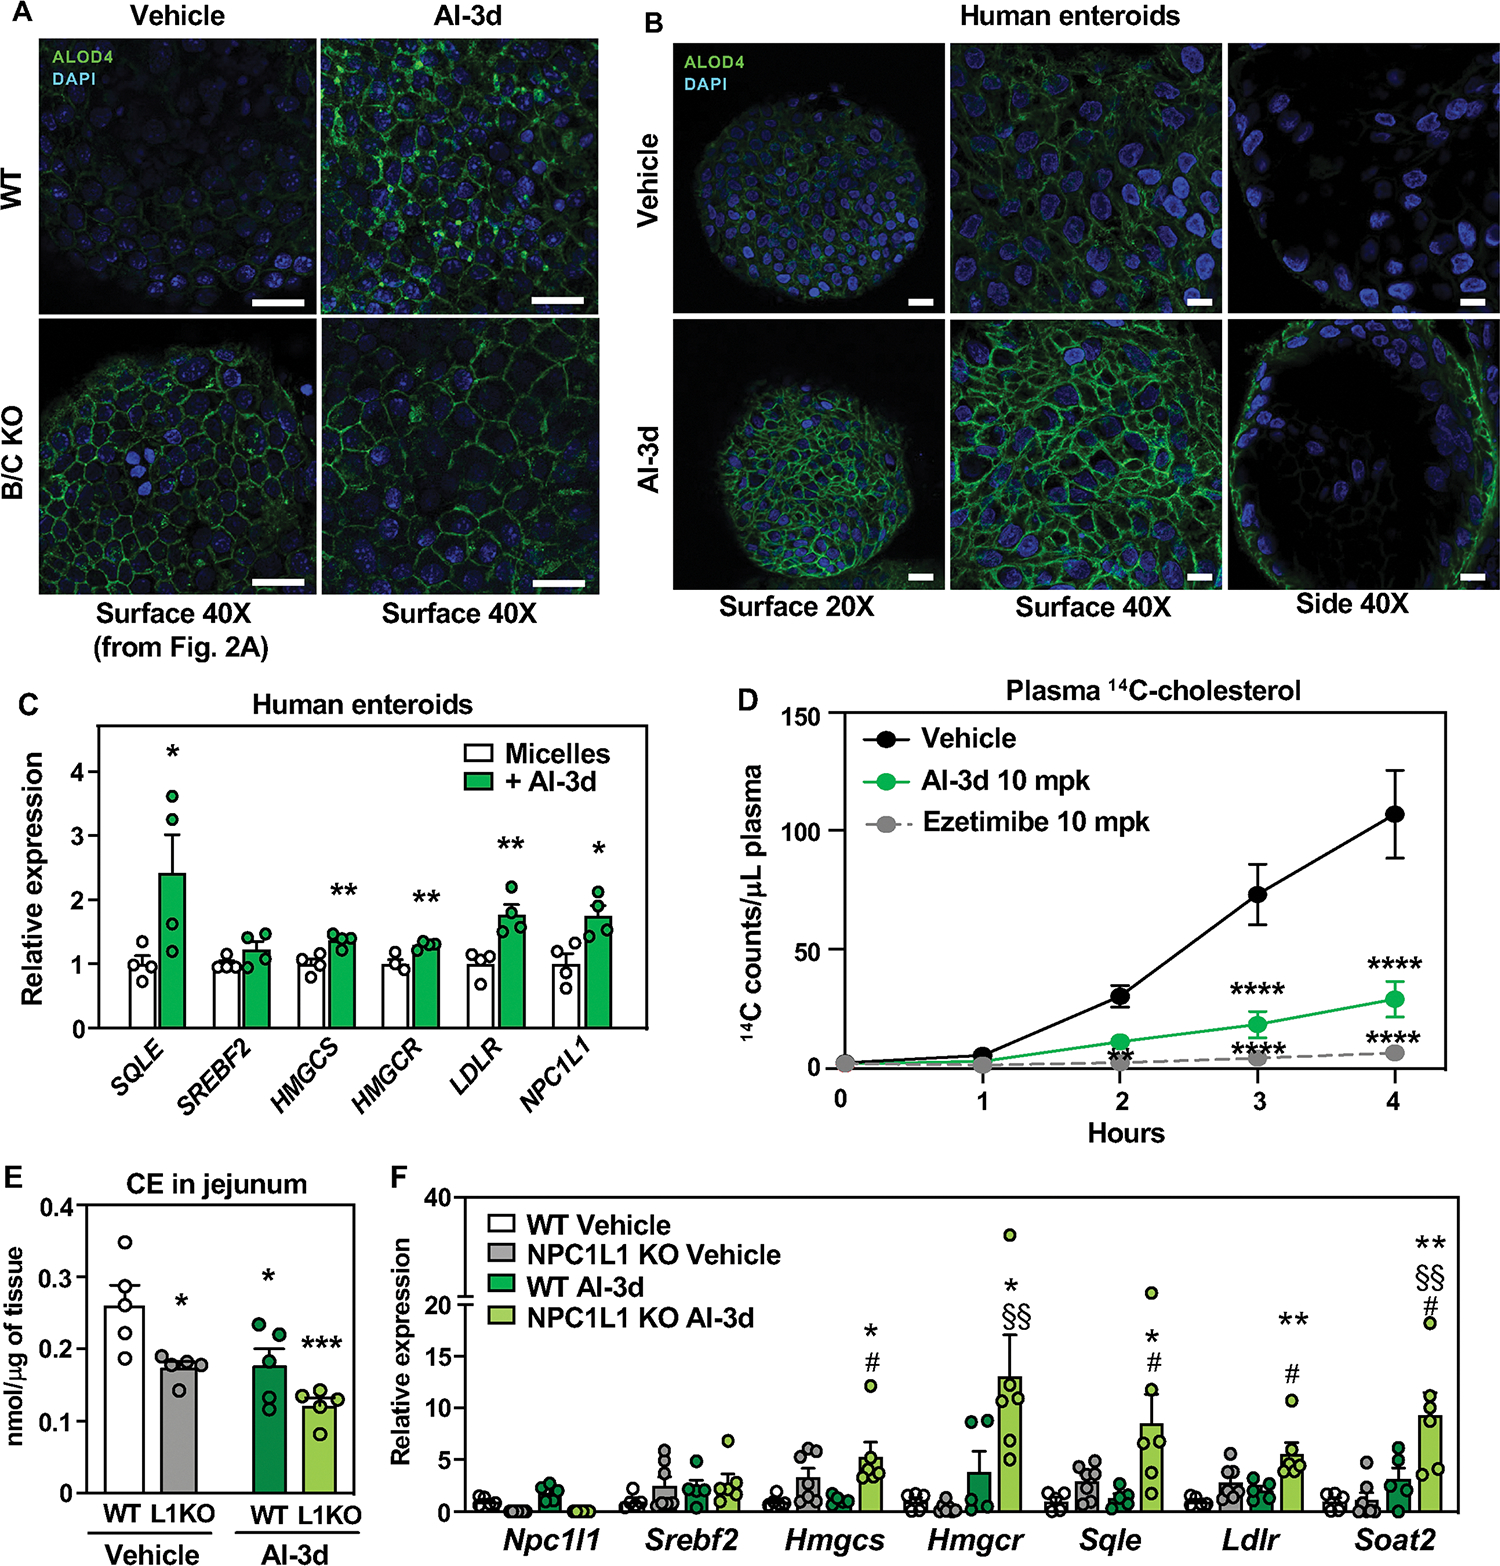
Intestinal absorption is an important contributor to systemic cholesterol homeostasis. Niemann-Pick C1 Like 1 (NPC1L1) assists in the initial step of dietary cholesterol uptake, but how cholesterol moves downstream of NPC1L1 is unknown. We show that Aster-B and Aster-C are critical for nonvesicular cholesterol movement in enterocytes. Loss of NPC1L1 diminishes accessible plasma membrane (PM) cholesterol and abolishes Aster recruitment to the intestinal brush border. Enterocytes lacking Asters accumulate PM cholesterol and show endoplasmic reticulum cholesterol depletion. Aster-deficient mice have impaired cholesterol absorption and are protected against diet-induced hypercholesterolemia. Finally, the Aster pathway can be targeted with a small-molecule inhibitor to manipulate cholesterol uptake. These findings identify the Aster pathway as a physiologically important and pharmacologically tractable node in dietary lipid absorption.


Conflict of interest statement

Competing interests: Authors declare that they have no competing interests.

Figures

Fig. 1:
Fig. 1:. Aster proteins modulate dietary cholesterol uptake.
(A) Absolute quantification of Gramd1a/b/c mRNA in duodenum, jejunum and ileum of C57BL/6J male mice (n = 5). (B) IF microscopy of HA-Aster-B in intestinal organoids from 3×HA-Aster-B mice during sterol deprivation (left) or loading with MβCD-cholesterol (right). Scale bar is 50 μm. (C) Immunohistochemical staining of HA-Aster-B in small intestines from 3×HA-Aster-B mice after a gastric gavage with corn oil or corn oil with cholesterol. For upper panels scale bar is 20 μm. panels. For lower panels scale bar is 10 μm. (D) Radioactivity in intestinal segments of female WT and B/C KO mice after oral gavage with olive oil containing [14C]cholesterol for 2 h (n = 9/group), and cumulative counts in the proximal intestine. (E) Radioactivity in plasma of mice described in D. (F) Radioactivity in livers of mice described in D. (G) Radioactivity in intestinal segments of female F/F and I-B/C KO mice after an oral challenge of olive oil containing [14C]cholesterol for 2 h (n = 9/group), and cumulative counts in the proximal intestine. (H) Radioactivity in plasma of mice described in H. (I) Radioactivity in livers of mice described in I. (J) Cholesterol absorption measured by fecal dual-isotope ratio method (n = 8–10/group). (K) Kinetics of radioactivity in plasma of female WT (n = 9), BKO (n = 5), CKO (n = 5), B/C KO (n = 5) mice after an oral challenge of olive oil containing [14C]cholesterol. (L) Kinetics of radioactivity in plasma of female F/F and I-B/C KO mice after injection of Poloxamer-407 and an oral challenge of [14C]cholesterol in olive oil. (N) Kinetics of total cholesterol in mice described in L. Data are expressed as mean ± SEM. Statistical analysis: for panels D, E, F, G, H, I, J, unpaired t test; for panel L, 2-way ANOVA with Tukey’s multiple comparisons test; for panels M and N, 2-way ANOVA with Sidak’s multiple comparisons test. *p < 0.05, **p < 0.01, ***p < 0.001, ****p < 0.0001.
Fig. 2:
Fig. 2:. Deletion of Asters reduces cholesterol internalization from the plasma membrane.
(A) Backscattered electron images and NanoSIMS images of a mid-duodenum villus from WT and B/C KO mice. (B) Quantification of the 2H secondary ion signal, normalized to the 1H, 13C, and 16O signals. (C) ALOD4 imaging of murine enteroids from WT and B/C KO mice 2 h after loading with MβCD cholesterol For left panels, scale bar is 20 μm. For middle and right panels scale bar is 10 μm. Data are expressed as mean ± SEM. Statistical analysis: unpaired t test; *p < 0.05, ***p < 0.001, ****p < 0.0001.
Fig. 3:
Fig. 3:. Loss of Asters in intestine impairs cholesterol transfer to ER.
(A) Cholesterol ester quantification by mass spectrometry in proximal jejunum from WT (n = 3) and B/C KO (n = 4) 2 h post- refeeding a chow diet, after 10 h fasting. (B) Quantification of 14C-labeled CE isolated from proximal jejunum scrapings of WT (n = 5) and B/C KO (n = 4) mice 2 h after oral gavage of [14C]cholesterol. (C) Gene expression from distal jejunum scrapings of WT (n = 5) and B/C KO (n = 3) mice after 4 h of fasting. (D) Gene expression from distal jejunum scrapings of WT (n = 3) and B/C KO (n = 4) mice 2 h post- refeeding a chow diet, after 10 h fasting. (E) Gene expression from distal jejunum scrapings of F/F (n = 4) and I-B/C KO (n = 4) mice 2 h post-refeeding with chow diet, after 10 h fasting. (F) Western blot analysis of duodenum scrapings of mice described in D. (G) Western blot analysis and quantification of plasma from F/F (n = 4) and I-B/C KO (n = 4) mice fed for 21 days a high cholesterol (1.25%) diet, after 10 h of fasting followed by 2 h refeeding a HC diet. (H) ApoB48 quantified by densitometry and normalized on the volume of plasma used for WB detection. (I) Plasma cholesterol of mice described in G. (J) Quantification of 14C-counts in chylomicrons isolated from plasma of F/F (n=5) and I-B/C KO (n=5) 3 h after treatment with Poloxamer-407 and oral gavage of [14C]cholesterol. (K), (L) Quantification of deuterated (-d4) CE (K) and free cholesterol (L) in chylomicrons isolated from plasma of F/F (n = 4) and I-B/C KO ( n = 4) 3.5 h after treatment with Poloxamer-407 and oral gavage with cholesterol-d4. Data are expressed as mean ± SEM. Statistical analysis: unpaired t test, *p < 0.05, **p < 0.01, ***p < 0.001, ****p < 0.0001.
Fig. 4:
Fig. 4:. Deletion of intestinal Asters protects from diet-induced hypercholesterolemia.
(A) Body weight of WT (n = 13) and B/C KO (n = 11) male mice after 21 days of a western diet + 1.25% cholesterol (HC). (B) Plasma cholesterol levels after 4 h fasting in mice described in A. (C) Liver cholesterol in mice described in A. (D) Plasma cholesterol levels after 4 h fasting in F/F (n = 17) and I-B/C KO (n = 11) male mice after 21 days of HC diet. (E) Body weight of mice described in D. (F) FPLC of plasma from F/F and I-B/C KO mice fed for 21 days with HC diet and euthanized after overnight fasting followed by 2 h of refeeding with the HC diet (pool of 3–5/group). (G) Gene expression in distal jejunum scrapings from WT (n = 12) and B/C KO (n = 11) mice after 21 days of HC diet, euthanized after 4 h fasting. (H) Gene expression in distal jejunum scrapings from F/F (n = 6) and I-B/C KO (n = 5) male mice after 21 days of HC diet, euthanized after 4 h fasting. (I) Western blot analysis of duodenum scrapings of mice described in H (n = 4/5). (J) Lipidomic analysis of CE in proximal jejunum scrapings from mice described in H (n = 5/group). Data are expressed as mean ± SEM. Statistical analysis: unpaired t test, *p < 0.05, **p < 0.01, ***p < 0.001, ****p < 0.0001.
Fig. 5:
Fig. 5:. Aster-B and Aster-C bind ezetimibe.
(A) Competition assays for 22-NBD-cholesterol binding to purified ASTER-B and ASTER-C domains incubated in presence of vehicle, 20α-HC, 25-HC, or EZ (1–30 mM). Data bars represent means ± SD. (B) Cartoon representation of the atomic structure, at 1.6 Å resolution, of the ASTER domain of Aster-C complexed to EZ. The EZ ligand in cyan sticks fits in a pocket created between the highly curved β-sheet, the second short helix, and the carboxyl-terminal helix. The cavity also accommodates glycerol (cyan sticks), water molecules (blue spheres), and part of a PEG 4000 molecule (cyan sticks). 2Fo-Fc electron density map of EZ, glycerol, part of PEG 4000, and water molecules in the binding cavity shown as blue mesh contoured at 1.2σ. (C) Superposition of Aster-C:EZ (cyan) with the structure of Aster A:25-HC (pdb ID 6GQF). The overall architecture of the domain is very similar, but there are differences in the binding pocket and the opening loop. (D) Detail of the interaction between EZ and Aster-C involving residues ALA 357 and ILE 362, and superposition of the Aster-A:25-HC interaction. The superposition reveals how LEU 400 and PHE 405 from Aster A domain would clash with EZ, potentially preventing Aster A from binding EZ.
Fig. 6:
Fig. 6:. NPC1L1 enriches accessible cholesterol at the brush border and promotes Aster recruitment.
(A) CE quantification by mass spectrometry in scrapings from proximal jejunum of WT and B/C KO mice fed for 3 days with a control diet (ctrl) containing 0.08% cholesterol or a diet containing 0.08% cholesterol and 0.01% EZ and euthanized after 10 h fasting followed by 2 h refeeding with the same diets (n = 3–5/group). (B) CE quantification by mass spectrometry in scrapings from proximal jejunum of F/F and I-B/C KO mice fed for 3 days with a control diet (ctrl) containing 0.08% cholesterol or a diet containing 0.08% cholesterol and 0.01% EZ) and euthanized 2 h after refeeding (n = 3–5/group). (C) Fractional absorption of cholesterol measured by fecal dual isotope method in F/F and I-B/C KO mice fed for 3 days with a control diet (ctrl) containing 0.08% cholesterol or a diet containing 0.08% cholesterol and 0.01% EZ. (D) Western blot analysis of duodenum scrapings from F/F and I-B/C KO mice fed for 3 days with EZ diet (n = 3/group). Samples were run on the same gel used for western blot analysis reported in Fig. S3F, therefore, the loading control (Calnexin) is the same. (E) Immunohistochemistry of HA-Aster-B in small intestines from 3×HA-Aster-B mice after an oral administration of vehicle or EZ and a gastric gavage with cholesterol in corn oil. (F) ALOD4 imaging of murine enteroids from WT and NPC1L1 KO mice after loading with cholesterol in mixed micelles or with MβCD-cholesterol. Scale bar is 40 μm. (G) Immunohistochemistry of HA-Aster-B in small intestines from 3×HA-Aster-B mice crossed to NPC1L1 WT or NPC1L1 KO mice after a gastric gavage with cholesterol in corn oil. For E and G upper panels scale bar is 20 μm, for lower panels scale bar is 10 μm. Data are expressed as mean ± SEM. 2-way ANOVA with Tukey’s multiple comparisons test. Data are expressed as mean ± SEM. *p < 0.05, **p < 0.01, ***p < 0.001, ****p < 0.0001 vs WT Ctrl, #p < 0.05 vs I-B/C KO Ctrl.
Fig. 7:
Fig. 7:. Pharmacological inhibition of Asters reduces intestinal cholesterol uptake.
(A) ALOD4 staining (green) of PM accessible cholesterol in enteroids from WT and B/C KO mice loaded with MβCD cholesterol and treated with vehicle or Aster inhibitor AI-3d. Results presented in this panel and in Fig. 2C came from one experiment, where WT vehicle-treated enteroids served as control for both B/C KO vehicle-treated enteroids and for AI-3d vehicle-treated enteroids. Scale bar is 20 μm. (B) ALOD4 staining (green) of PM accessible cholesterol in human enteroids treated with vehicle or AI-3d. For left panels, scale bar is 20 μm. For middle and right panels, scale bar is 10 μm. (C) Gene expression of SREBP-2 and target genes in human enteroids differentiated on transwell plates and loaded with cholesterol in mixed micelles in the presence of vehicle or AI-3d. (D) Kinetics of radioactivity in plasma of female mice that were administered vehicle (n = 6), AI-3d (n = 5), or EZ (n = 6) in corn oil. After 1 h, the mice were given a gastric gavage of olive oil containing [14C]cholesterol. (E) CE quantification by mass spectrometry in scrapings from proximal jejunum of NPC1L1 WT and NPC1L1 KO mice fed for 3 days with a control diet (ctrl) containing 0.08% cholesterol and treated with 3 doses of vehicle (left) or 10 mg/kg AI-3d (right) and euthanized after 10 h of fasting followed by 2 h refeeding with the same diet (n = 5/group). (F) Gene expression analysis of distal jejunum scrapings from mice described in E. Statistical analysis for panel C, unpaired t test; for panels, D, E, F, 2-way ANOVA with Tukey’s multiple comparisons test. Data are expressed as mean ± SEM. For panel C, *p < 0.05, **p < 0.01 vs micelles. For panel D **p < 0.01, ****p < 0.0001 vs Vehicle. For panels D, E *p < 0.05, **p < 0.01 vs WT Vehicle, #p < 0.05 vs WT AI-3d, §§ p < 0.01 vs NPC1L1 KO Vehicle.

Update of

Comment in

References

    1. Xie P et al., Genetic demonstration of intestinal NPC1L1 as a major determinant of hepatic cholesterol and blood atherogenic lipoprotein levels. Atherosclerosis 237, 609–617 (2014). - PMC - PubMed
    1. Mansbach CM, Siddiqi SA, The Biogenesis of Chylomicrons. Annual Review of Physiology 72, 315–333 (2010). - PMC - PubMed
    1. Buhman KK et al., Resistance to diet-induced hypercholesterolemia and gallstone formation in ACAT2-deficient mice. Nature Medicine 6, 1341–1347 (2000). - PubMed
    1. Nguyen TM, Sawyer JK, Kelley KL, Davis MA, Rudel LL, Cholesterol esterification by ACAT2 is essential for efficient intestinal cholesterol absorption: evidence from thoracic lymph duct cannulation [S]. Journal of Lipid Research 53, 95–104 (2012). - PMC - PubMed
    1. Zhang J et al., Tissue-specific knockouts of ACAT2 reveal that intestinal depletion is sufficient to prevent diet-induced cholesterol accumulation in the liver and blood[S]. Journal of Lipid Research 53, 1144–1152 (2012). - PMC - PubMed