

Using normative modeling and machine learning for detecting mild traumatic brain injury from magnetoencephalography data
- PMID: 37943963
- PMCID: PMC10662745
- DOI: 10.1371/journal.pcbi.1011613
Using normative modeling and machine learning for detecting mild traumatic brain injury from magnetoencephalography data
Abstract
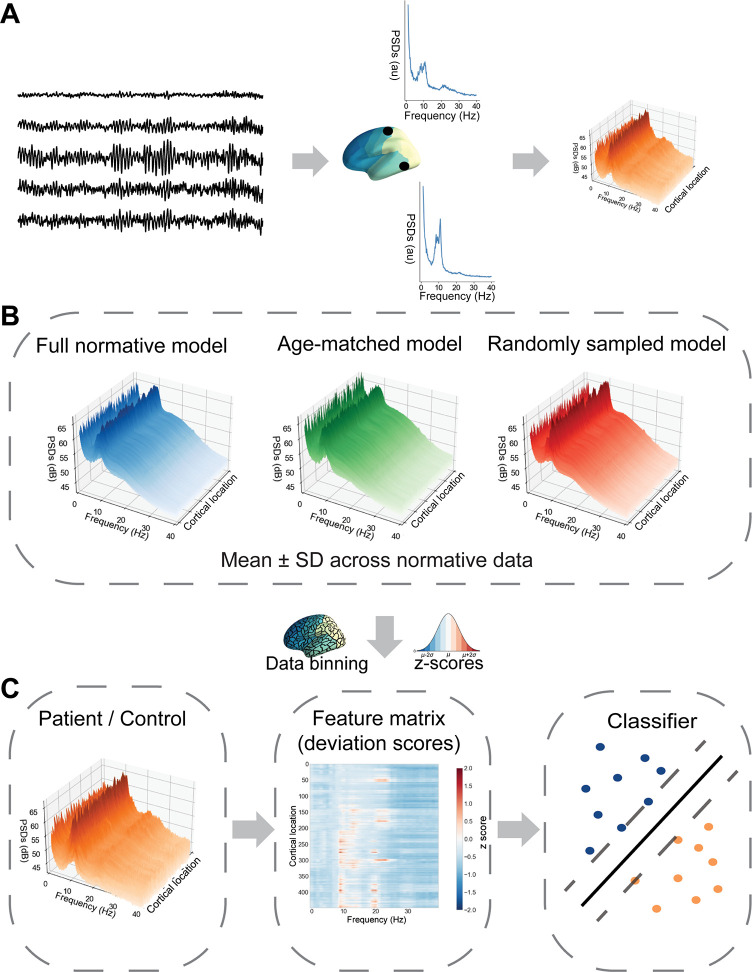
New biomarkers are urgently needed for many brain disorders; for example, the diagnosis of mild traumatic brain injury (mTBI) is challenging as the clinical symptoms are diverse and nonspecific. EEG and MEG studies have demonstrated several population-level indicators of mTBI that could serve as objective markers of brain injury. However, deriving clinically useful biomarkers for mTBI and other brain disorders from EEG/MEG signals is hampered by the large inter-individual variability even across healthy people. Here, we used a multivariate machine-learning approach to detect mTBI from resting-state MEG measurements. To address the heterogeneity of the condition, we employed a normative modeling approach and modeled MEG signal features of individual mTBI patients as deviations with respect to the normal variation. To this end, a normative dataset comprising 621 healthy participants was used to determine the variation in power spectra across the cortex. In addition, we constructed normative datasets based on age-matched subsets of the full normative data. To discriminate patients from healthy control subjects, we trained support-vector-machine classifiers on the quantitative deviation maps for 25 mTBI patients and 20 controls not included in the normative dataset. The best performing classifier made use of the full normative data across the entire age and frequency ranges. This classifier was able to distinguish patients from controls with an accuracy of 79%. Inspection of the trained model revealed that low-frequency activity in the theta frequency band (4-8 Hz) is a significant indicator of mTBI, consistent with earlier studies. The results demonstrate the feasibility of using normative modeling of MEG data combined with machine learning to advance diagnosis of mTBI and identify patients that would benefit from treatment and rehabilitation. The current approach could be applied to a wide range of brain disorders, thus providing a basis for deriving MEG/EEG-based biomarkers.
Copyright: © 2023 Itälinna et al. This is an open access article distributed under the terms of the Creative Commons Attribution License, which permits unrestricted use, distribution, and reproduction in any medium, provided the original author and source are credited.
Conflict of interest statement
The authors have declared that no competing interests exist.
Figures


Similar articles
-
The Use of Magnetoencephalography in the Diagnosis and Monitoring of Mild Traumatic Brain Injuries and Post-Concussion Syndrome.Brain Sci. 2025 Feb 4;15(2):154. doi: 10.3390/brainsci15020154. Brain Sci. 2025. PMID: 40002487 Free PMC article. Review.
-
Sensor-level MEG combined with machine learning yields robust classification of mild traumatic brain injury patients.Clin Neurophysiol. 2023 Sep;153:79-87. doi: 10.1016/j.clinph.2023.06.010. Epub 2023 Jun 30. Clin Neurophysiol. 2023. PMID: 37459668
-
Assessing Pediatric Mild Traumatic Brain Injury and Its Recovery Using Resting-State Magnetoencephalography Source Magnitude Imaging and Machine Learning.J Neurotrauma. 2023 Jun;40(11-12):1112-1129. doi: 10.1089/neu.2022.0220. Epub 2023 Apr 13. J Neurotrauma. 2023. PMID: 36884305 Free PMC article.
-
Brain activation profiles in mTBI: Evidence from combined resting-state EEG and MEG activity.Annu Int Conf IEEE Eng Med Biol Soc. 2015;2015:6963-6. doi: 10.1109/EMBC.2015.7319994. Annu Int Conf IEEE Eng Med Biol Soc. 2015. PMID: 26737894
-
Review of wearable technologies and machine learning methodologies for systematic detection of mild traumatic brain injuries.J Neural Eng. 2021 Aug 19;18(4). doi: 10.1088/1741-2552/ac1982. J Neural Eng. 2021. PMID: 34330120 Review.
Cited by
-
From bench to bedside: Overview of magnetoencephalography in basic principle, signal processing, source localization and clinical applications.Neuroimage Clin. 2024;42:103608. doi: 10.1016/j.nicl.2024.103608. Epub 2024 Apr 20. Neuroimage Clin. 2024. PMID: 38653131 Free PMC article. Review.
-
Identification and Connectomic Profiling of Concussion Using Bayesian Machine Learning.J Neurotrauma. 2024 Aug;41(15-16):1883-1900. doi: 10.1089/neu.2023.0509. Epub 2024 Apr 29. J Neurotrauma. 2024. PMID: 38482793 Free PMC article.
-
Machine learning and deep learning approach for medical image analysis: diagnosis to detection.Multimed Tools Appl. 2022 Dec 24:1-39. doi: 10.1007/s11042-022-14305-w. Online ahead of print. Multimed Tools Appl. 2022. PMID: 36588765 Free PMC article.
-
Multivariate Modelling and Prediction of High-Frequency Sensor-Based Cerebral Physiologic Signals: Narrative Review of Machine Learning Methodologies.Sensors (Basel). 2024 Dec 20;24(24):8148. doi: 10.3390/s24248148. Sensors (Basel). 2024. PMID: 39771880 Free PMC article. Review.
-
The Use of Magnetoencephalography in the Diagnosis and Monitoring of Mild Traumatic Brain Injuries and Post-Concussion Syndrome.Brain Sci. 2025 Feb 4;15(2):154. doi: 10.3390/brainsci15020154. Brain Sci. 2025. PMID: 40002487 Free PMC article. Review.
References
-
- Lewine JD, Davis JT, Bigler ED, Thoma R, Hill D, Funke M, et al.. Objective documentation of traumatic brain injury subsequent to mild head trauma: Multimodal brain imaging with MEG, SPECT, and MRI. Journal of Head Trauma Rehabilitation. 2007;22(3):141–55. doi: 10.1097/01.HTR.0000271115.29954.27 - DOI - PubMed
MeSH terms
Substances
LinkOut - more resources
Full Text Sources
Medical
