Case Reports
. 2023 Nov 2;164(12):bqad161.
doi: 10.1210/endocr/bqad161.

Standardized In Vitro Models of Human Adipose Tissue Reveal Metabolic Flexibility in Brown Adipocyte Thermogenesis

Affiliations
Case Reports

Standardized In Vitro Models of Human Adipose Tissue Reveal Metabolic Flexibility in Brown Adipocyte Thermogenesis

Cheryl Cero et al. Endocrinology. .

Abstract

Functional human brown and white adipose tissue (BAT and WAT) are vital for thermoregulation and nutritional homeostasis, while obesity and other stressors lead, respectively, to cold intolerance and metabolic disease. Understanding BAT and WAT physiology and dysfunction necessitates clinical trials complemented by mechanistic experiments at the cellular level. These require standardized in vitro models, currently lacking, that establish references for gene expression and function. We generated and characterized a pair of immortalized, clonal human brown (hBA) and white (hWA) preadipocytes derived from the perirenal and subcutaneous depots, respectively, of a 40-year-old male individual. Cells were immortalized with hTERT and confirmed to be of a mesenchymal, nonhematopoietic lineage based on fluorescence-activated cell sorting and DNA barcoding. Functional assessments showed that the hWA and hBA phenocopied primary adipocytes in terms of adrenergic signaling, lipolysis, and thermogenesis. Compared to hWA, hBA were metabolically distinct, with higher rates of glucose uptake and lactate metabolism, and greater basal, maximal, and nonmitochondrial respiration, providing a mechanistic explanation for the association between obesity and BAT dysfunction. The hBA also responded to the stress of maximal respiration by using both endogenous and exogenous fatty acids. In contrast to certain mouse models, hBA adrenergic thermogenesis was mediated by several mechanisms, not principally via uncoupling protein 1 (UCP1). Transcriptomics via RNA-seq were consistent with the functional studies and established a molecular signature for each cell type before and after differentiation. These standardized cells are anticipated to become a common resource for future physiological, pharmacological, and genetic studies of human adipocytes.

Keywords: bioenergetics; bioinformatics; brown adipose tissue; in vitro model; white adipose tissue.


Figures

Figure 1.
Figure 1.
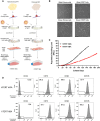
Generation of clonal immortalized white (CRL-4063TM, hTERT hWA) and brown (CRL-4062TM, hTERT hBA) adipocytes. (A) Representative workflow starting from tissue to the generation of primary cultures, immortalized adipocytes, and selected clones of human hTERT white (hWA) and hTERT brown (hBA) preadipocytes. (B) Phase contrast images of the morphology of primary vs immortalized white and brown adipocytes. Scale bars are 100 µM. (C) Population doubling levels (PDL) of immortalized clonal white (black) and brown adipocytes (red). (D) Flow cytometric analysis of adipocyte markers in immortalized clonal white and brown adipocytes. The hematopoietic lineage marker is CD34, while the mesenchymal stem cell (MSC) markers are CD73, CD90, and CD105. Numerical values in the graphs represent the percentage of cells above the fluorescence threshold of 104.
Figure 2.
Figure 2.
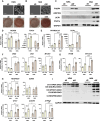
Morphologic and molecular characterization of hTERT immortalized clonal hWA and hBA. (A-B) Microscopic imaging of the morphology and Oil Red O staining in undifferentiated (d0) and differentiated (d30) immortalized clonal white (A) (hWA) and (B) brown (hBA) adipocytes. Scale bars are 100 µM. (C) Immunoblotting showing protein expression of adipocyte differentiation markers, FABP4 and ADIPOQ, and brown adipocyte markers, UCP1 and PGC1α, in undifferentiated and differentiated hWA and hBA. (D-H) mRNA levels of the following genes in undifferentiated and differentiated hWA and hBA. (D) white adipocyte markers HOXC8 and TCF21; (E) transcription factor PPARGC1A and thermogenic marker UCP1; (F) brown adipocyte markers DIO2, ZIC1 and MTUS1; (G) mitochondrial encoded genes TFAM and MT-CO2; (H) electron transport chain genes NDUFAB1, SDHB, CYC1, COX7B, and ATP5g1. (I) Immunoblotting to show protein expression of electron transport chain complexes in undifferentiated and differentiated hWA and hBA. *P < .05, **P < .01, ***P < .001, ****P < .0001.
Figure 3.
Figure 3.
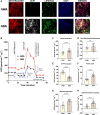
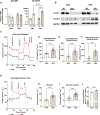
Immortalized hBA have a higher content of thermogenic mitochondria and higher basal and stimulated metabolic rate. (A) Immunofluorescence microscopy of differentiated adipocytes from clonal hTERT immortalized hWA and hBA with labeling of mitochondria (MitoTracker, red); anti-UCP1 (white); lipid droplets (LipidTox-green); nuclei (DAPI, blue); and all four labels (“Merged”). Scale bars are 100 µm. (B) Mitochondrial stress test with oxygen consumption rate (OCR) tracings in differentiated adipocytes from hTERT immortalized hWA and hBA. Drugs added were 2 μM oligomycin; 1 μM carbonyl cyanide-p-trifluoromethoxyphenylhydrazone (FCCP); 0.11 μM rotenone; and 2.2 μM antimycin A. Standard parameters of mitochondrial function are identified with annotated double-headed arrows on the tracing for the hWA. Error bars represent the SEM of the independent individual experiments, which are separate points shown in (C-H).Quantification of respiratory profile by differentiated adipocytes from clonal hTERT immortalized hWA and hBA showing (C) basal respiration; (D) non-mitochondrial respiration; (E) ATP production; (F) proton leak; (G) maximal respiration; and (H) spare respiratory capacity. *P < .05, **P < .01, ***P < .001, ****P < .0001.
Figure 4.
Figure 4.
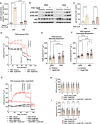
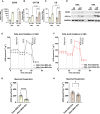
Signaling through adenylyl cyclase/cAMP induces lipolysis and thermogenesis in hWA and hBA. All experiments were conducted with differentiated hWA and hBA treated with 10 µM forskolin (FSK) or vehicle. (A) Intracellular cAMP levels in differentiated hWA and hBA. (B) Immunoblot showing protein levels of HSL and its two phosphorylated variants that reflect activation, pHSL Ser-563 and pHSL Ser-660. Actin is the loading control. (C) Glycerol levels in the incubation media. (D) OCR after treatment with 10 µM forskolin or vehicle followed by 2 μM oligomycin; 0.11 μM rotenone, and 2.2 μM antimycin A. Quantification of the respiratory profile in differentiated hWA and hBA adipocytes showing forskolin-induced (E) maximal respiration and (F) uncoupled respiration. Error bars represent the SEM of the independent individual experiments, which are separate points shown in E-F and H-I. (G) OCR after treatment with 10 µM forskolin or vehicle followed by 1.5 nM plasma membrane permeabilizer (PMP) + 3 mM GDP or vehicle and then 0.11 μM, rotenone and 2.2 μM antimycin A. Quantification of the four OCR reads after GDP treatment in (H) hWA and (I) hBA. *P < .05, **P < .01, ***P < .001, ****P < .0001.
Figure 5.
Figure 5.
hBA have higher glucose oxidation and glycolysis compared to hWAExperiments were done with undifferentiated and differentiated immortalized clonal hWA and hBA. (A) mRNA levels of glucose transporters SLC2A1 and SLC2A4. (B) Immunoblotting showing protein expression of glucose transporters GLUT1 and GLUT4. GAPDH is the loading control. (C) Mitochondrial stress test with OCR tracings. Drugs added were 2 μM oligomycin; 1 μM FCCP; 0.11 μM rotenone, and 2.2 μM antimycin A. Error bars represent the SEM of the independent individual experiments, which are separate points shown in (D-F and H-J). (D) Basal respiration prior to the addition of glucose. (E) Basal respiration after the addition of 25 mM glucose. (F) Maximal respiration after the addition of 25 mM glucose. (G) Glycolysis stress test with tracings showing ECAR. Drugs added were 2 μM oligomycin; 1 μM FCCP; 0.11 μM rotenone, and 2.2 μM antimycin A. (H) Glycolysis; (I) Glycolytic capacity. (J) Intracellular lactate. *P < .05, **P < .01, ***P < .001, ****P < .0001.
Figure 6.
Figure 6.
hBA have higher fatty acid oxidation than hWA and use both exogenous and endogenous fatty acid sources. mRNA levels of the following genes in undifferentiated and differentiated immortalized clonal hWA and hBA: (A) Cell membrane fatty acid transporter CD36; (B) Mitochondrial fatty acid importer CPT1B; (C) Tricarboxylic acid cycle rate-limiting enzyme CS; (D) Immunoblot showing protein levels of CD36 and CPT1b. GAPDH is the loading control. (E-H) Mitochondrial stress test with OCR tracings in differentiated hWA and hBA. Cells were preincubated in a substrate-limited medium (0.5 mM glucose, 1 mM GlutaMAX, 0.5 mM carnitine, and 1% FBS) with palmitate and BSA (Palm:BSA) at a molar ratio of 6:1. Cells were also treated with 40 μM CPT1b inhibitor etomoxir (Eto) or vehicle. Stress test drugs added were 2 μM oligomycin; 1 μM FCCP; 0.11 μM rotenone, and 2.2 μM antimycin A. (E) hWA OCR tracings with error bars representing the SEM of the independent individual experiments represented by each dot. (F) hBA OCR tracings with error bars representing the SEM of the independent individual experiments represented by each dot. (G) hWA maximal respiration with exogenous palmitate with error bars representing the SEM of the independent individual experiments represented by each dot. (H) hBA maximal respiration with exogenous palmitate with error bars representing the SEM of the independent individual experiments represented by each dot. *P < .05, **P < .01, ***P < .001, ****P < .0001.
Figure 7.
Figure 7.
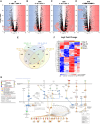
RNA-seq identifies distinct markers and functional pathways of hWA and hBA. (A-D) Volcano plots of transcriptomes of the d0 and d30 hWA and hBA. Shown are all genes whose expression was detectable (CPM > 0) in at least 3 replicates. (Red) Genes with differential expression FDR P 1.5, and with the phrases “adipose”, “white fat” or “brown fat” in their Gene Ontology Biological Process annotations. Actual values are in the Data set. (A) hBA d0 vs hWA d0; (B) hWA d0 vs d30; (C) hBA d3 vs d30; (D) hBA d30 vs hWA d30. Not depicted were genes whose absolute fold change and/or P values were outside the bounds of the graphs: (A) none; (B) CEBPA, PLAAT3, PPARG, RETREG1; (C) CEBPA, FABP4, PLAAT3; (D) FGF10, OXCT1, PNPLA3, PPARGC1A, SORL1. (E) Venn diagram showing the overlap of the differentially expressed genes in the four comparisons described in (A-D). (F) Genetic signature profile for 45 genes significantly differentially expressed across each condition. Genes shown here exhibited an absolute fold change >2x and an FDR P-value <.05 in each of the four pairwise comparisons shown. Colors represent z-score normalized CPM gene expression values centered on each gene's mean expression across all samples. (G) Network diagram representing the regulation of PPARα/RXRα activation in hWA d0 vs d30.

References

    1. Richard AJ, White U, Elks CM, et al. Adipose tissue: physiology to metabolic dysfunction. In: Feingold KR Anawalt B and Boyce A (eds.), Endotext. MDText.com, Inc.; 2000. - PubMed
    1. Longo M, Zatterale F, Naderi J, et al. Adipose tissue dysfunction as determinant of obesity-associated metabolic complications. Int J Mol Sci. 2019;20(9):2358. - PMC - PubMed
    1. Ikeda K, Maretich P, Kajimura S. The common and distinct features of brown and beige adipocytes. Trends Endocrinol Metab. 2018;29(3):191‐200. - PMC - PubMed
    1. Cannon B, de Jong JMA, Fischer AW, Nedergaard J, Petrovic N. Human brown adipose tissue: classical brown rather than brite/beige? Exp Physiol. 2020;105(8):1191‐1200. - PubMed
    1. Rahbani JF, Roesler A, Hussain MF, et al. Creatine kinase B controls futile creatine cycling in thermogenic fat. Nature. 2021;590(7846):480‐485. - PMC - PubMed

Publication types