. 2023 Dec:98:104865.
doi: 10.1016/j.ebiom.2023.104865. Epub 2023 Nov 7.

Blockade of IL-6R prevents preterm birth and adverse neonatal outcomes

Affiliations

Blockade of IL-6R prevents preterm birth and adverse neonatal outcomes

Marcelo Farias-Jofre et al. EBioMedicine. 2023 Dec.

Abstract

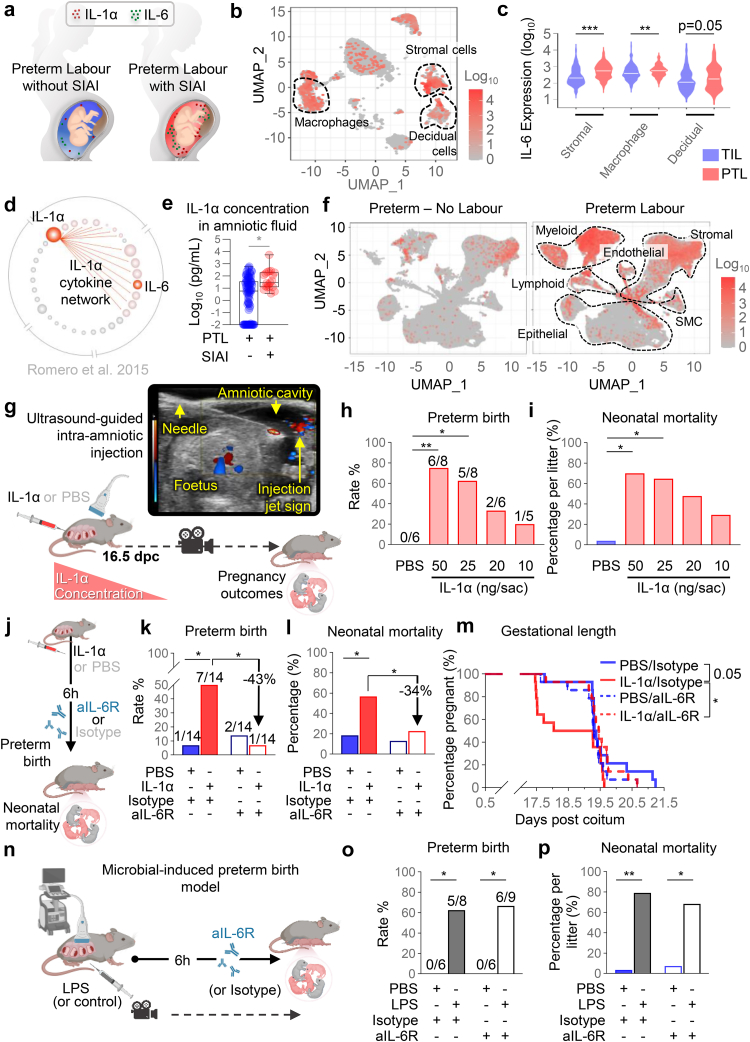
Background: Preterm birth preceded by spontaneous preterm labour often occurs in the clinical setting of sterile intra-amniotic inflammation (SIAI), a condition that currently lacks treatment.

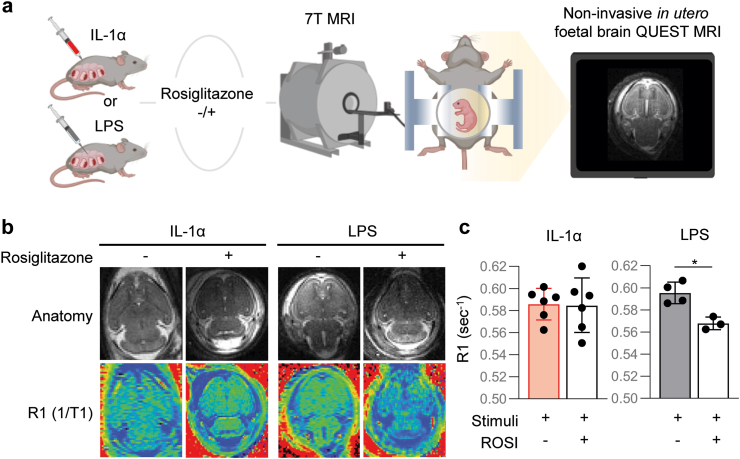
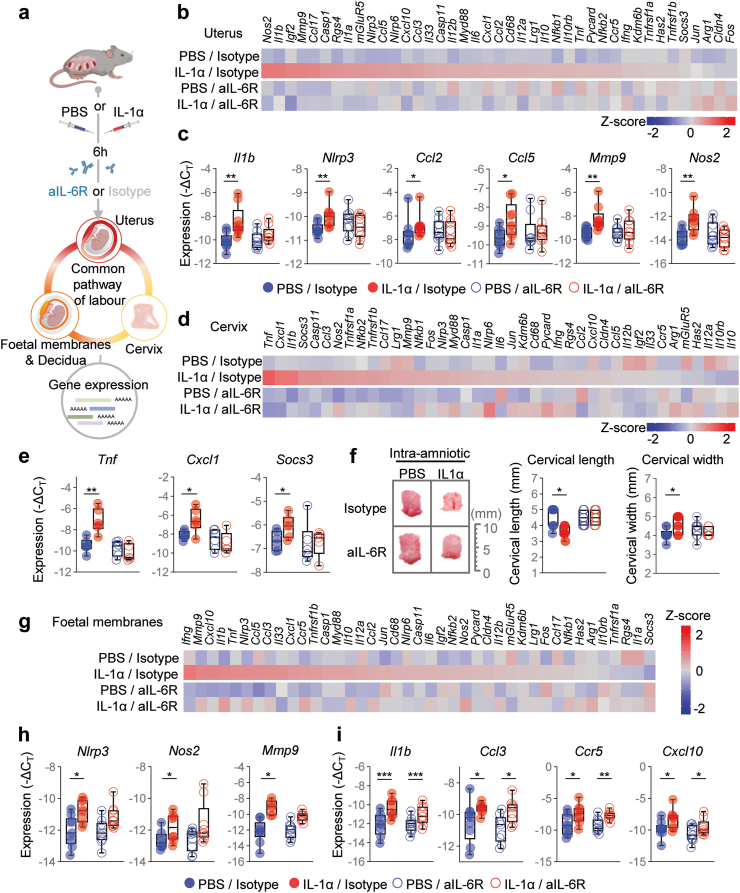
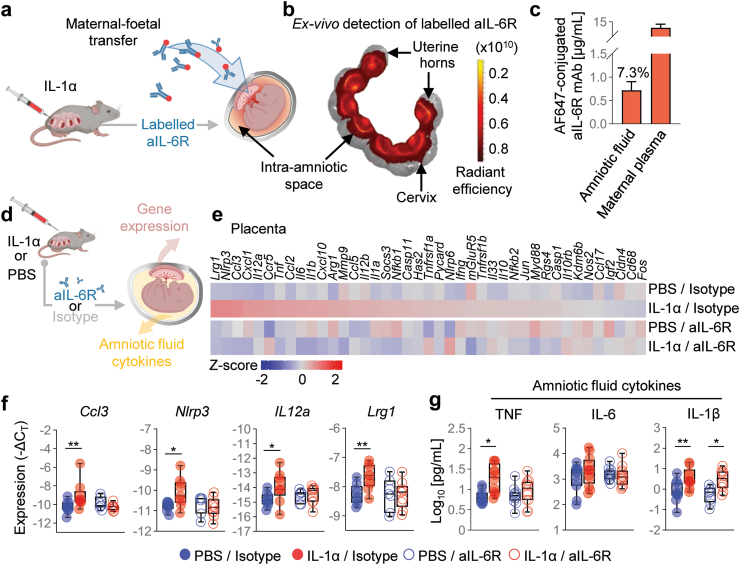
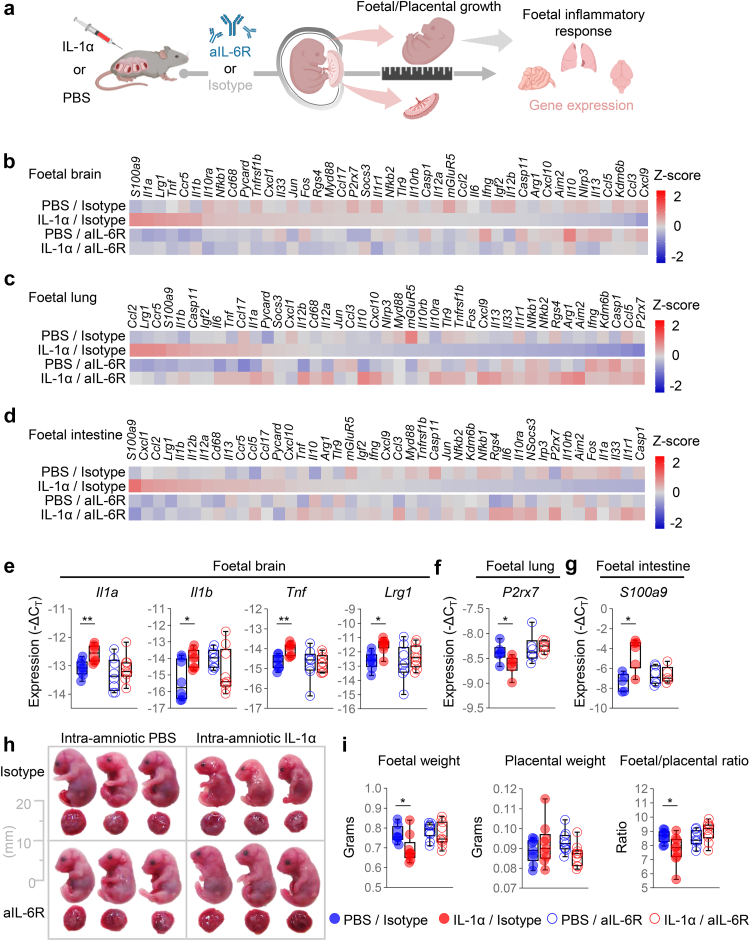
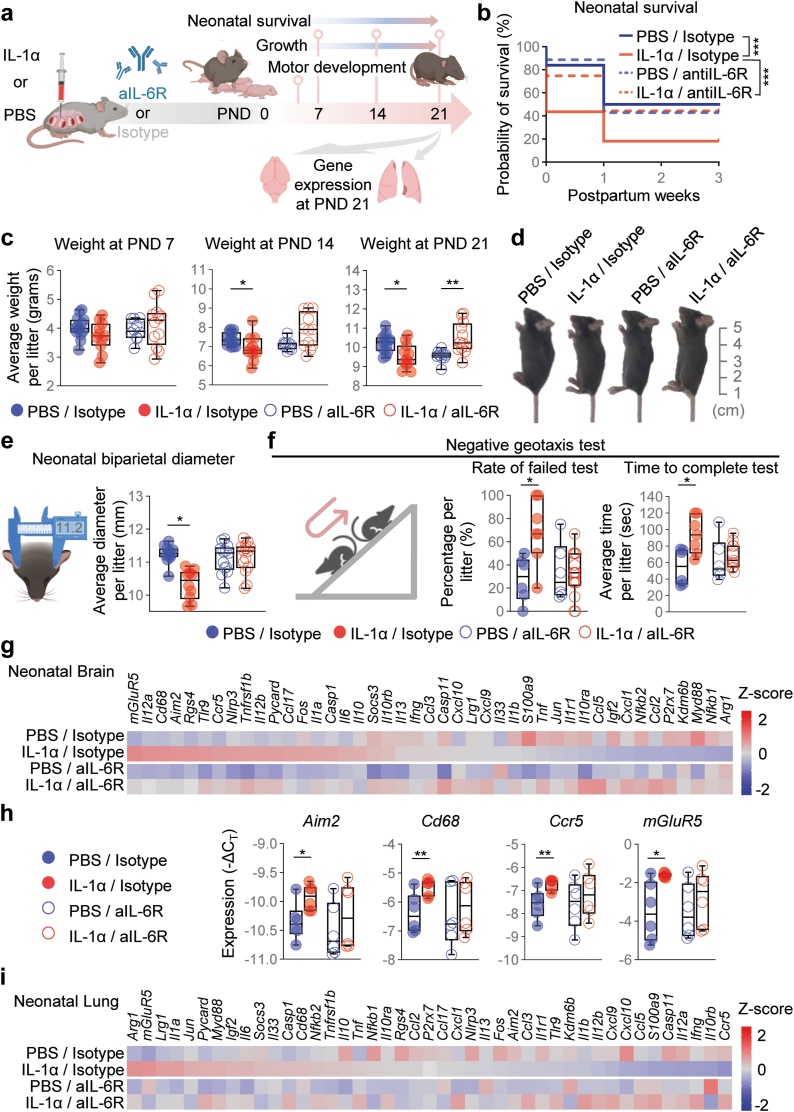
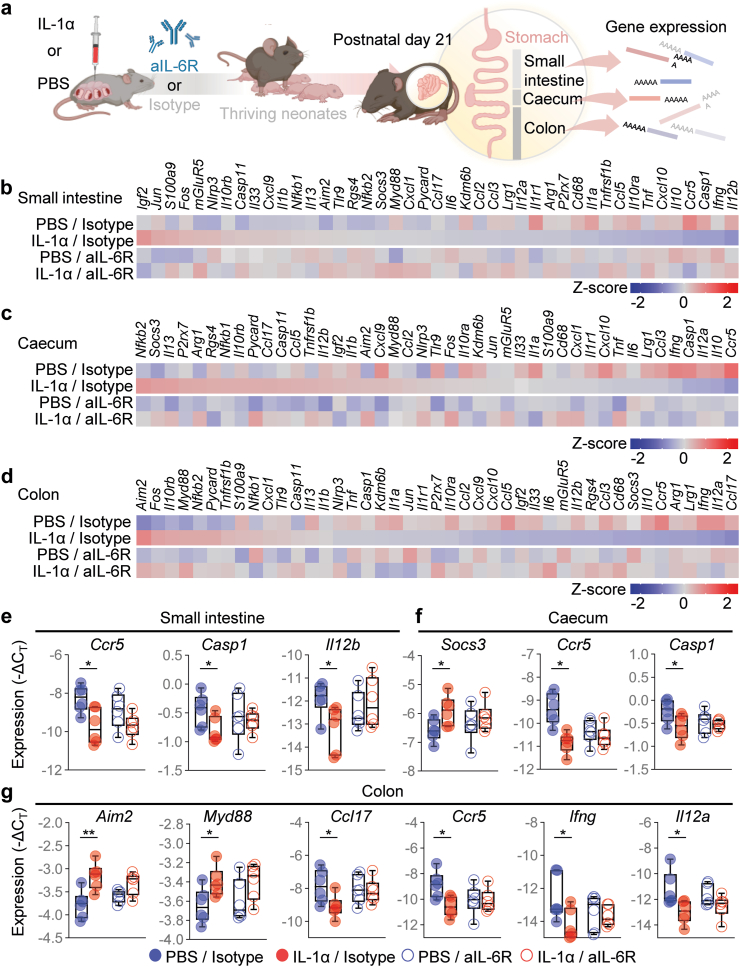
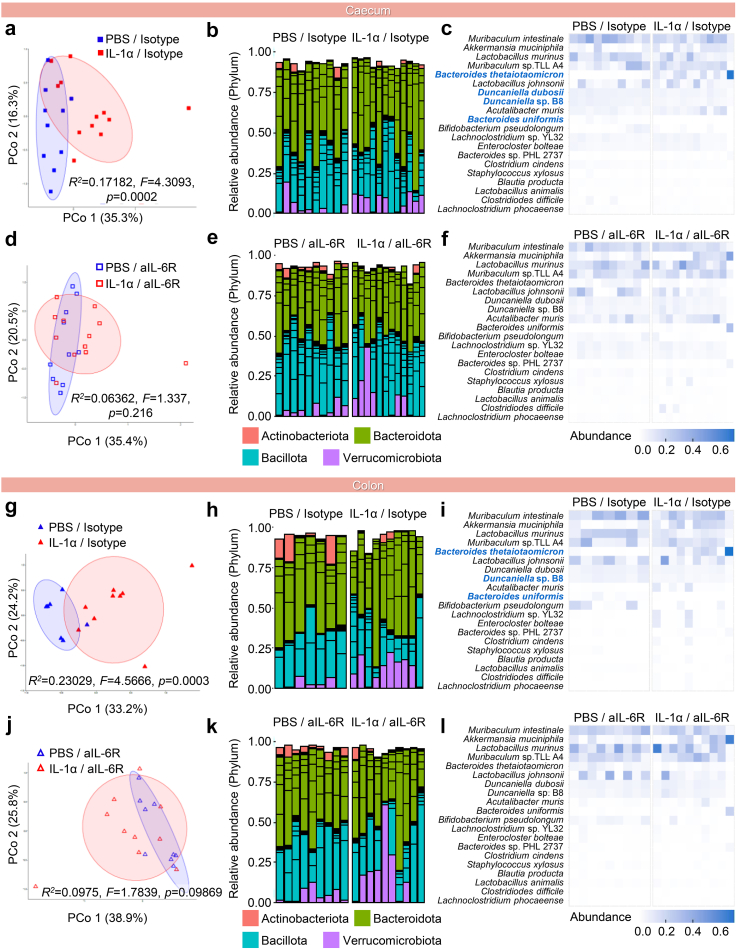
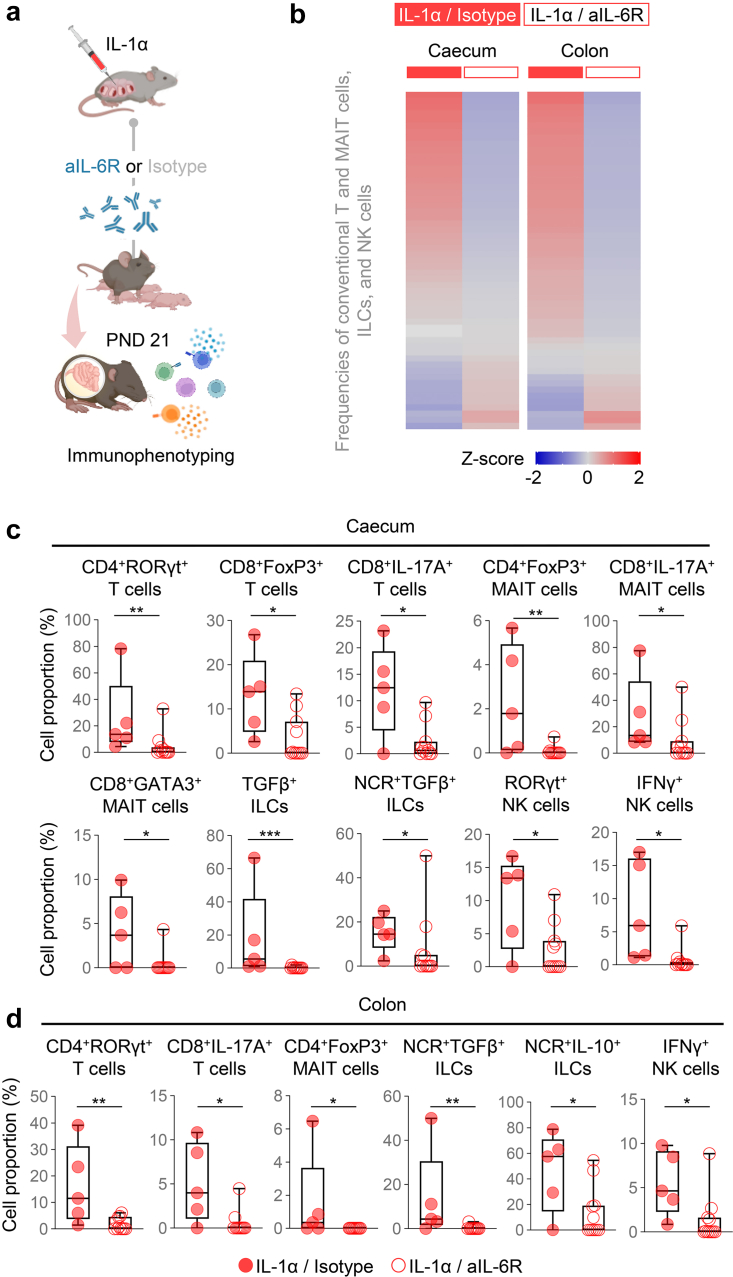
Methods: Proteomic and scRNA-seq human data were analysed to evaluate the role of IL-6 and IL-1α in SIAI. A C57BL/6 murine model of SIAI-induced preterm birth was developed by the ultrasound-guided intra-amniotic injection of IL-1α. The blockade of IL-6R by using an aIL-6R was tested as prenatal treatment for preterm birth and adverse neonatal outcomes. QUEST-MRI evaluated brain oxidative stress in utero. Targeted transcriptomic profiling assessed maternal, foetal, and neonatal inflammation. Neonatal biometrics and neurodevelopment were tested. The neonatal gut immune-microbiome was evaluated using metagenomic sequencing and immunophenotyping.

Findings: IL-6 plays a critical role in the human intra-amniotic inflammatory response, which is associated with elevated concentrations of the alarmin IL-1α. Intra-amniotic injection of IL-1α resembles SIAI, inducing preterm birth (7% vs. 50%, p = 0.03, Fisher's exact test) and neonatal mortality (18% vs. 56%, p = 0.02, Mann-Whitney U-test). QUEST-MRI revealed no foetal brain oxidative stress upon in utero IL-1α exposure (p > 0.05, mixed linear model). Prenatal treatment with aIL-6R abrogated IL-1α-induced preterm birth (50% vs. 7%, p = 0.03, Fisher's exact test) by dampening inflammatory processes associated with the common pathway of labour. Importantly, aIL-6R reduces neonatal mortality (56% vs. 22%, p = 0.03, Mann-Whitney U-test) by crossing from the mother to the amniotic cavity, dampening foetal organ inflammation and improving growth. Beneficial effects of prenatal IL-6R blockade carried over to neonatal life, improving survival, growth, neurodevelopment, and gut immune homeostasis.

Interpretation: IL-6R blockade can serve as a strategy to treat SIAI, preventing preterm birth and adverse neonatal outcomes.

Funding: NICHD/NIH/DHHS, Contract HHSN275201300006C. WSU Perinatal Initiative in Maternal, Perinatal and Child Health.

Keywords: Alarmin; IL-1α; Microbiome; Pregnancy; Prematurity; Sterile intra-amniotic inflammation.


Conflict of interest statement

Declaration of interests The authors declare no competing interests.

Figures

Fig. 1
Fig. 1
Blockade of IL-6R reduces preterm birth and neonatal mortality induced by IL-1α. (a) Schematic representation showing the increased amniotic fluid concentrations of the alarmin IL-1α and the biomarker of intra-amniotic inflammation, IL-6, in patients with sterile intra-amniotic inflammation (SIAI). (b) Uniform Manifold Approximation and Projection (UMAP) plot showing the expression of IL6 by cell types in the chorioamniotic membrane of patients who underwent spontaneous term or preterm labour (n = 3 per group). Dotted lines represent cell clusters with the highest IL6 expression. (c) Violin plots represent the expression of IL6 by the Stromal, Macrophage, and Decidual cell clusters compared between patients who underwent spontaneous term (TIL) or preterm (PTL) labour. (d) IL-1α module of cytokine network interactions in the amniotic fluid of pregnant patients with preterm labour and SIAI (modified from Romero et al. 2015). (e) Amniotic fluid concentrations of IL-1α (pg/mL) in pregnant patients with preterm labour with or without SIAI (modified from Bhatti et al. 2020). Data are shown as box-and-whisker plots where midlines indicate medians, boxes indicate interquartile ranges, and whiskers indicate minimum and maximum values. (f) UMAP plots showing the expression of Il6 by cell types in labour-associated tissues from control (preterm no labour) mice (left panel) or mice undergoing preterm labour (right panel; n = 4 per group). Dotted lines represent cell clusters with the highest Il6 expression. SMC, smooth muscle cell. (g) Experimental model for the induction of SIAI by ultrasound-guided intra-amniotic injection of IL-1α (or PBS control) on 16.5 days post coitum (dpc), with successful injection confirmed by observation of the “injection jet sign” by using colour Doppler ultrasound. (h) Preterm birth and (i) neonatal mortality rates in mice injected with PBS (blue, n = 6 litters) or IL-1α (light red, n = 5–8 litters per group). (j) Experimental design for treatment of IL-1α- or PBS-injected dams with rat anti-mouse IL-6 receptor monoclonal antibody (aIL-6R) or rat IgG2b isotype (control) 6 h after intra-amniotic injection. (k) Preterm birth and (l) neonatal mortality of dams injected with PBS/Isotype (filled blue bars), IL-1α/Isotype (filled red bars), PBS/aIL-6R (open blue bars), and IL-1α/aIL-6R (open red bars) (n = 14 per group). (m) Gestational lengths of dams from the four experimental groups displayed as Kaplan–Meier survival curves (n = 14 dams at risk per group). (n) Model of microbial-induced preterm birth and treatment with aIL-6R or isotype. (o) Preterm birth and (p) neonatal mortality were evaluated in mice injected with PBS/Isotype (filled blue bars), LPS/Isotype (filled black bars), PBS/aIL-6R (open blue bars), and LPS/aIL-6R (open black bars) (n = 6–9 litters per group). Data are shown as bar plots. p-values were determined using the Fisher's exact test for preterm birth rate, two-sided Mann–Whitney U-tests for neonatal mortality, and the Gehan-Breslow-Wilcoxon test for Kaplan–Meier survival curve comparisons. ∗p < 0.05; ∗∗p < 0.01; ∗∗∗p < 0.001.
Fig. 2
Fig. 2
Differential effect of sterile and microbial intra-amniotic inflammation on an MRI imaging biomarker of free radical production/oxidative stress in the foetal brain. (a) Left: Dams were intra-amniotically injected with IL-1α (25 ng/25 μL per sac) or LPS (100 ng/25 μL per sac). Six h later, a portion of dams from each group received an intraperitoneal injection of rosiglitazone (ROSI; 10 mg/kg), and all dams underwent in utero MRI scanning using a 7T system. Continuous production of paramagnetic free radicals (indicative of oxidative stress) in the region of interest (ROI) located in the left and right brain hemispheres was inferred from the difference in the R1 (=1/T1) signal between ROSI-treated (a drug with antioxidant properties) and untreated dams. Right: Representative image showing the foetal brain. (b) Top row: Representative anatomical images (generated by normalizing the TR 150 ms image) for each study group. Bottom row: Corresponding R1 maps. All images were fixed to the same scale with darker colours indicating lower R1 values. (c) Modelled mean of the ROI R1 from both hemispheres of either IL-1α and IL-1α + ROSI groups (left bar graph, n = 6 per group) or LPS and LPS + ROSI groups (right bar graph, n = 3–4 per group). Data are presented as means and confidence intervals. p-values were determined using linear mixed modelling. ∗p < 0.05.
Fig. 3
Fig. 3
Blockade of IL-6R interferes with the common pathway of labour induced by intra-amniotic IL-1α. (a) Dams underwent intra-amniotic injection of PBS (control) or IL-1α on 16.5 days post coitum (dpc). Six h later, dams were intra-peritoneally injected with rat anti-mouse IL-6 receptor monoclonal antibody (aIL-6R) or rat IgG2b isotype (control). Sixteen h after the intra-amniotic injection, the uterus, cervix, foetal membranes, and decidua were collected to analyse gene expression by directed high-throughput RT-qPCR. (b) Heatmap representation of inflammatory gene expression in the uterine tissue (n = 9 per group). Red indicates increased expression and blue indicates decreased expression. (c) Gene expression (−ΔCT) of Il1b, Nlrp3, Ccl2, Ccl5, Mmp9, and Nos2 in the uterus. (d) Heatmap representation of inflammatory gene expression in the cervix (n = 9 per group). (e) Gene expression (−ΔCT) of Tnf, Cxcl1, and Socs3 in the cervix. (f) Representative images of cervical dilation and quantifications of cervical length and width. Scale bar represents 10 mm (n = 7–11 per group). (g) Heatmap representation of inflammatory gene expression in foetal membranes (n = 9 per group). Gene expression (-ΔCT) of (h)Nlrp3, Nos2, and Mmp9 or (i)Il1b, Ccl3, Ccr5, and Cxcl10 in foetal membranes. Data for gene expression are shown as box-and-whisker plots where midlines indicate medians, boxes indicate interquartile ranges, and whiskers indicate minimum and maximum values. p-values were determined by two-sided Mann–Whitney U-test. ∗p < 0.05; ∗∗p < 0.01; ∗∗∗p < 0.001.
Fig. 4
Fig. 4
Anti-IL-6R efficiently crosses the placenta and reduces the inflammation-related gene expression induced by intra-amniotic IL-1α. (a) Dams underwent intra-amniotic injection of IL-1α on 16.5 days post coitum (dpc). Six h later, dams received Alexa Fluor™647-conjugated rat anti-mouse IL-6 receptor monoclonal antibody (aIL-6R) to evaluate maternal–foetal transfer. Sixteen h after intra-amniotic injection the uterus was collected for imaging by using the IVIS system. (b) Representative fluorescence image and scale showing the ex vivo detection of labelled aIL-6R in the intra-amniotic space. (c) Amniotic fluid concentrations (μg/mL) of aIL-6R in the amniotic fluid and maternal plasma. The amniotic fluid concentration is also reported as a percentage of the maternal plasma concentration (7.3%) (n = 5). Data are shown as bar plots with mean and S.E.M. (d) Dams underwent intra-amniotic injection of PBS (control) or IL-1α on 16.5 days post coitum (dpc). Six h later, dams were treated with aIL-6R or rat IgG2b isotype (control). Sixteen h after intra-amniotic injection, placental tissues and amniotic fluid were collected to determine gene expression and cytokine concentrations, respectively. (e) Representative heatmap showing Z-scores (red and blue indicates increased and decreased expression, respectively) for gene expression across the placental tissues from the four experimental groups (n = 7–9 per group). (f) Expression (-ΔCT) of Ccl3, Nlrp3, Il12a, and Lrg1 in the placental tissues from the four experimental groups. (g) Concentrations (pg/mL) of TNF, IL-6, and IL-1β in the amniotic fluid from the four experimental groups (n = 8–12 per group). Data for gene expression are shown as box-and-whisker plots where midlines indicate medians, boxes indicate interquartile ranges, and whiskers indicate minimum and maximum values. p-values were determined using the two-sided Mann–Whitney U-test. ∗p < 0.05; ∗∗p < 0.01.
Fig. 5
Fig. 5
Anti-IL-6R dampens foetal inflammation induced by intra-amniotic IL-1α, restoring foetal growth. (a) Dams underwent intra-amniotic injection of PBS (control) or IL-1α on 16.5 days post coitum (dpc). Six h later, dams received intraperitoneal injection of rat anti-mouse IL-6 receptor monoclonal antibody (aIL-6R) or rat IgG2b isotype (control). Sixteen h after intra-amniotic injection, foetal and placental growth parameters were measured followed by tissue collection to determine gene expression. Representative heatmaps showing Z-scores for gene expression in the (b) foetal brain, (c) foetal lung, and (d) foetal intestine from the four experimental groups (n = 6–9 per group). Red indicates increased expression and blue indicates decreased expression. Expression (−ΔCT) of (e)Il1a, Il1b, Tnf, and Lrg1 in the foetal brain, (f)P2rx7 in the foetal lung, and (g)S100a9 in the foetal intestine from the four experimental groups. (h) Representative images of foetuses and placentas from the four experimental groups. Scale bar represents 20 mm. (i) Foetal weight, placental weight, and foetal:placental weight ratio from the four experimental groups (n = 9–10 litters per group). Data for gene expression are shown as box-and-whisker plots where midlines indicate medians, boxes indicate interquartile ranges, and whiskers indicate minimum and maximum values. p-values were determined using the two-sided Mann–Whitney U-test. ∗p < 0.05; ∗∗p < 0.01.
Fig. 6
Fig. 6
Blockade of IL-6R improves neonatal outcomes and limits organ inflammation induced by intra-amniotic IL-1α. (a) Dams underwent intra-amniotic injection of PBS (control) or IL-1α on 16.5 days post coitum (dpc). Six h later, dams received intraperitoneal injection of rat anti-mouse IL-6 receptor monoclonal antibody (aIL-6R) or rat IgG2b isotype (control). Dams were allowed to deliver and neonatal survival until postnatal day (PND) 21 as well as weekly weights and neuro-motor development testing were recorded. Brain and lung tissues were collected on PND21. (b) Neonatal survival rates up to PND21 are displayed as Kaplan–Meier survival curves (n = 14 litters per group). p-values were determined using the Gehan-Breslow-Wilcoxon test. (c) Weights (g) of neonates across the first three weeks of life are shown as box plots (n = 10–14 litters per group). p-values were determined using two-sided Mann–Whitney U-tests. Data are shown as box-and-whisker plots where midlines indicate medians, boxes indicate interquartile ranges, and whiskers indicate minimum and maximum values. (d) Representative images of pups at PND21. The scale bar represents 5 cm. (e) Schematic diagram of calliper measurement and quantification of neonatal biparietal diameter (n = 10–14 litters per group). (f) Schematic diagram of the negative geotaxis test for neuro-motor evaluation. The rate of neonates with a failed test and the time required to complete the test are shown as box plots (n = 6–14 litters per group). Data in e and f are shown as box-and-whisker plots where midlines indicate medians, boxes indicate interquartile ranges, and whiskers indicate minimum and maximum values. (g) Representative heatmap showing Z-scores for gene expression in the neonatal brain from the four experimental groups (n = 6 per group). Red indicates increased expression and blue indicates decreased expression. (h) Expression (−ΔCT) of Aim2, Cd68, Ccr5, and mGluR5 in the neonatal brain. Data for gene expression are shown as box-and-whisker plots where midlines indicate medians, boxes indicate interquartile ranges, and whiskers indicate minimum and maximum values. (i) Representative heatmap showing Z-scores for gene expression in the neonatal lung from the four experimental groups (n = 6 per group). p-values were determined using the two-sided Mann–Whitney U-test. ∗p < 0.05; ∗∗p < 0.01.
Fig. 7
Fig. 7
Blockade of IL-6R prevents IL-1α-induced neonatal gut inflammation. (a) Dams underwent intra-amniotic injection of PBS (control) or IL-1α on 16.5 days post coitum (dpc). Six h later, dams received intraperitoneal injection of rat anti-mouse IL-6 receptor monoclonal antibody (aIL-6R) or rat IgG2b isotype (control). Dams were allowed to deliver, and the neonatal small intestine, caecum, and colon were collected on postnatal day (PDN) 21 to determine gene expression. Representative heatmaps showing Z-scores for gene expression in the neonatal (b) small intestine, (c) caecum, and (d) colon from the four experimental groups (n = 6 per group). Red indicates increased expression and blue indicates decreased expression. Expression (−ΔCT) of (e)Ccr5, Casp1, and Il12b in the neonatal small intestine, (f)Socs3, Ccr5, and Casp1 in the neonatal caecum, and (g)Aim2, Myd88, Ccl17, Ccr5, Ifng, and Il12a in the neonatal colon from the four experimental groups. Data for gene expression are shown as box-and-whisker plots where midlines indicate medians, boxes indicate interquartile ranges, and whiskers indicate minimum and maximum values. p-values were determined using the two-sided Mann–Whitney U-test. ∗p < 0.05; ∗∗p < 0.01.
Fig. 8
Fig. 8
Blockade of IL-6R prevents IL-1α-induced microbiome alterations in the neonatal caecum and colon. Samples from the neonatal colon and caecum, as well as environmental controls, were obtained at postnatal day 21 using sterile swabs. (af) Principal coordinate analysis (PCoA) illustrating variation in the metagenomic profiles of the neonatal caecum of the (a) PBS/Isotype and IL-1α/Isotype groups or (d) PBS/aIL-6R and IL-1α/aIL-6R groups (n = 10–12 per group). Bar plots showing the taxonomic classifications of the 20 bacterial taxa with highest relative abundance in the neonatal caecum of the (b) PBS/Isotype and IL-1α/Isotype groups or (e) PBS/aIL-6R and IL-1α/aIL-6R groups (n = 10–12 per group). Heatmap displaying the relative abundance and taxonomy of the 20 most relatively abundant bacterial taxa between the metagenomic profiles of the neonatal caecum of the (c) PBS/Isotype and IL-1α/Isotype groups or (f) PBS/aIL-6R and IL-1α/aIL-6R groups (n = 10–12 per group). (gl) PCoA illustrating variation in the metagenomic profiles of the neonatal colon of the (g) PBS/Isotype and IL-1α/Isotype groups or (j) PBS/aIL-6R and IL-1α/aIL-6R groups (n = 10–12 per group). Bar plots showing the taxonomic classifications of the 20 bacterial taxa with highest relative abundance in the neonatal colon of the (h) PBS/Isotype and IL-1α groups/Isotype or (k) PBS/aIL-6R and IL-1α/aIL-6R groups (n = 10–12 per group). Heatmap displaying the relative abundance and taxonomy of the 20 most relatively abundant bacterial taxa between the metagenomic profiles of the neonatal colon of the (i) PBS/Isotype and IL-1α/Isotype groups or (l) PBS/aIL-6R and IL-1α/aIL-6R groups (n = 10–12 per group). Similarities in the metagenomic profiles (PCoA plots) were characterised using the Bray–Curtis similarity index. For bar plots, multiple taxa with the same phylum-level classification within the same sample are indicated by bars of the same colour. For heatmaps, bacterial taxa with significantly altered abundance between groups are labelled in blue. p-values were determined using two-sided Mann–Whitney U-tests with Holm's correction for multiple comparisons.
Fig. 9
Fig. 9
Blockade of IL-6R restores immune cellular homeostasis in the neonatal gut following intra-amniotic IL-1α exposure. (a) Dams underwent intra-amniotic injection of IL-1α on 16.5 days post coitum (dpc). Six h later, dams received intraperitoneal injection of rat anti-mouse IL-6 receptor monoclonal antibody (aIL-6R) or rat IgG2b isotype (control). Dams were allowed to deliver, and the neonatal small intestine, caecum, and colon were collected on postnatal day (PDN) 21 to isolate leukocytes for immunophenotyping. (b) Heatmap representation showing Z-scores for the proportions of specific lymphocyte subpopulations (conventional T and MAIT cells, ILCs, and NK cells) from the two experimental groups in the neonatal caecum and colon (n = 5–11 per group). (c) Cell proportions of CD4+RORγt+ T cells, CD8+FoxP3+ T cells, CD8+IL-17A+ T cells, CD4+FoxP3+ mucosal-associated invariant T (MAIT) cells, CD8+IL-17A+ MAIT cells, CD8+GATA3+ MAIT cells, TGFβ+ ILCs, NCR+TGFβ+ ILCs, RORγt+ NK cells, and IFNγ+ NK cells in the neonatal caecum. (d) Cell proportions of CD4+RORγt+ T cells, CD8+IL-17A+ T cells, CD4+FoxP3+ MAIT cells, NCR+TGFβ+ ILCs, NCR+IL-10+ ILCs, and IFNγ+ NK cells in the neonatal colon. Data are shown as box-and-whisker plots where midlines indicate medians, boxes indicate interquartile ranges, and whiskers indicate minimum and maximum values. p-values were determined using the two-sided Mann–Whitney U-test. ∗p < 0.05; ∗∗p < 0.01; ∗∗∗p < 0.001.

References

    1. Liu L., Oza S., Hogan D., et al. Global, regional, and national causes of under-5 mortality in 2000-15: an updated systematic analysis with implications for the Sustainable Development Goals. Lancet. 2016;388(10063):3027–3035. - PMC - PubMed
    1. Chawanpaiboon S., Vogel J.P., Moller A.B., et al. Global, regional, and national estimates of levels of preterm birth in 2014: a systematic review and modelling analysis. Lancet Glob Health. 2019;7(1):e37–e46. - PMC - PubMed
    1. Perin J., Mulick A., Yeung D., et al. Global, regional, and national causes of under-5 mortality in 2000-19: an updated systematic analysis with implications for the Sustainable Development Goals. Lancet Child Adolesc Health. 2022;6(2):106–115. - PMC - PubMed
    1. Blencowe H., Lee A.C., Cousens S., et al. Preterm birth-associated neurodevelopmental impairment estimates at regional and global levels for 2010. Pediatr Res. 2013;74 Suppl 1(Suppl 1):17–34. - PMC - PubMed
    1. Ream M.A., Lehwald L. Neurologic consequences of preterm birth. Curr Neurol Neurosci Rep. 2018;18(8):48. - PubMed