. 2024 Feb 15;31(2):249-264.e7.
doi: 10.1016/j.chembiol.2023.10.012. Epub 2023 Nov 8.

Ferroptosis inhibition by oleic acid mitigates iron-overload-induced injury

Affiliations

Ferroptosis inhibition by oleic acid mitigates iron-overload-induced injury

Josiane Mann et al. Cell Chem Biol. .

Abstract

Iron overload, characterized by accumulation of iron in tissues, induces a multiorgan toxicity whose mechanisms are not fully understood. Using cultured cell lines, Caenorhabditis elegans, and mice, we found that ferroptosis occurs in the context of iron-overload-mediated damage. Exogenous oleic acid protected against iron-overload-toxicity in cell culture and Caenorhabditis elegans by suppressing ferroptosis. In mice, oleic acid protected against FAC-induced liver lipid peroxidation and damage. Oleic acid changed the cellular lipid composition, characterized by decreased levels of polyunsaturated fatty acyl phospholipids and decreased levels of ether-linked phospholipids. The protective effect of oleic acid in cells was attenuated by GW6471 (PPAR-α antagonist), as well as in Caenorhabditis elegans lacking the nuclear hormone receptor NHR-49 (a PPAR-α functional homologue). These results highlight ferroptosis as a driver of iron-overload-mediated damage, which is inhibited by oleic acid. This monounsaturated fatty acid represents a potential therapeutic approach to mitigating organ damage in iron overload individuals.

Keywords: C. elegans; MUFA; PPAR; cancer; cell death; degeneration; ferroptosis; iron; lipid; olei acid.


Conflict of interest statement

Declaration of interests B.R.S. is an inventor on patents and patent applications involving ferroptosis, holds equity in and serves as a consultant to Exarta Therapeutics, and ProJenX Inc, holds equity in Sonata Therapeutics, and serves as a consultant to Weatherwax Biotechnologies Corporation and Akin Gump Strauss Hauer & Feld LLP.

Figures
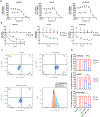
Figure 1:
Figure 1:. FAC exposure causes early lipid peroxidation and concentration- and time-dependent cytotoxicities in cultured HEK-293, HepG2 and SK-N-Be(2) cells, related toFigures S2.
(A and B) Cells were seeded at a density of 2000 cells/well in 384 well-plates. After 24 h, cells were treated with different ferric ammonium citrate (FAC) concentrations. After 24 h (A) or at different time-points (B), cell viability was evaluated. Data are presented as % of control. Mean +/− SD (n = 3). (C and D) HEK-293, Hep G2 and SK-N-Be(2) cells were seeded at a density of 350,000 cells/well in 6 well-plates. After 24 h, cells were treated with FAC (16 mM) and/or Fer-1 (5 μM). After 6 h, lipid peroxidation was evaluated by Bodipy C11 staining in the flow cytometer. (C) Representative flow cytometer plots of HEK-293 cells. (D) Quantitative analyses of HEK-293, Hep G2 and SK-N-Be(2) cells present in the quadrants 3 and 4 (Q3 and Q4). * P < 0.05, *** P < 0.001, and **** P < 0.0001 by two-way ANOVA followed by Tukey’s multiple comparisons test. Mean +/− SD (n = 3). Representative flow cytometer plots of Hep G2 and SK-N-Be(2) cells are depicted in Figures S2.
Figure 2:
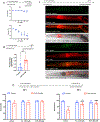
Figure 2:. Experimental iron overload causes ferroptosis-dependent damage and mortality in C. elegans.
(A) Wild type (N2 strain) L4 worms were exposed to different concentrations of ferric ammonium citrate (FAC) during 48 or 96 h. Survival rate is presented as % the initial number of alive animals (~25/experiment/group). Data are represented as mean +/− SD (N = 3). Significant differences were analyzed by one-way ANOVA followed by Dunnett’s test. * p < 0.05, ** p < 0.01, **** p < 0.0001 compared to control. (B-C) Wild type (N2 strain) L4 worms were exposed to vehicle (control) or 50 mM FAC during 48 h. (B) Lipid peroxidation (BODIPY-C11 staining) is presented as fluorescence [green/(green + red)]. **** p < 0.0001 by Student test. N = 15 worms per group (derived from 3 independent experiments). (C) Representative confocal microscopy imagens of red and/or green BODIPY-C11 fluorescence in control and FAC-exposed worms. (D) Wild type (N2 strain) L4 worms were exposed to 50 mM FAC and/or 200 μM Fer-1 or 200 μM BHT for 48 or 96 h. Survival rate is presented as % the initial number of alive animals (~25/experiment/group). Data are represented as mean +/− SD (N = 5). Significant differences were analyzed by two-way ANOVA followed by Tukey’s test. * p < 0.05, **** p < 0.0001 compared to control. #### p < 0.0001 compared to worms exposed only to 50 mM FAC.
Figure 3:
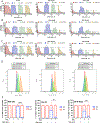
Figure 3:. Oleic acid inhibits FAC-induced cytotoxicity and lipid peroxidation in cells.
(A-C) HEK-293 (A), Hep G2 (B) and SK-N-Be(2) (C) cells were seeded at a density of 2000 cells/well in 384 well-plates. After 90 min, cells were treated with different concentrations (12.5–400 μM) of stearic, oleic, linoleic and arachidonic acids. After 24 h, cells were treated with FAC (0, 16 mM and 32 mM) and, after additional 24 h, cell viability was evaluated. Data are presented as % of vehicle-treated cells. Mean +/− SD (n = 3). Dashed lines indicate the average of cell viability without fatty acids addition: just vehicle (0.5% ethanol) and FAC (0, 16 or 32 mM). (D-E) HEK-293, Hep G2 and SK-N-Be(2) cells were seeded at a density of 350,000 cells/well in 6 well-plates. After 90 min, cells were treated with vehicle or 50 μM oleic acid. After 24 h, cells were treated with vehicle or 16 mM FAC and, after 6 h, lipid peroxidation was evaluated by Bodipy C11 staining in the flow cytometer. (D) Representative plots of HEK-293, Hep G2 and SK-N-Be(2) cells. (E) Quantitative analyses of HEK-293, Hep G2 and SK-N-Be(2) cells present in the quadrants 3 and 4 (Q3 and Q4). ** P < 0.01, *** P < 0.001, and **** P < 0.0001 by two-way ANOVA followed by Tukey’s multiple comparisons test.
Figure 4:
Figure 4:. Oleic acid prevents FAC-induced mortality and lipid peroxidation in C. elegans.
(A) Wild type (N2 strain) worms were exposed to different 0.15 mM of stearic, linoleic or oleic acid from L1. At the L4 stage, worms were exposed to 50 or 100 mM FAC during 48 or 96 h. Survival rate is presented as % the initial number of alive animals (~25/experiment/group). Data are represented as mean +/− SD (N = 3). ** p < 0.01, **** p < 0.0001 compared to the respective control after two-way ANOVA followed by Tukey’s multiple comparisons test. (B-C) Wild type (N2 strain) worms were exposed to vehicle or 0.15 mM of stearic, linoleic or oleic acid from L1. At the L4 stage, worms were exposed to 50 mM FAC during 48. (B) Lipid peroxidation (BODIPY-C11 staining) is presented as fluorescence [green/(green + red)]. **** p < 0.0001 by one-way ANOVA. N = 15 worms per group (derived from 3 independent experiments). ns = non-significant. (C) Representative confocal microscopy imagens of bright field + red and green BODIPY-C11 fluorescences from (i) control, (ii) FAC (50 mM), (iii) oleic acid (0.15 mM), and FAC (50 mM) + oleic acid (0.15 mM)-exposed worms (48 h after FAC exposure). Scale bar = 50 μm.
Figure 5:
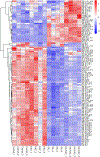
Figure 5:. Oleic acid decreases PUFA-containing and ether-related phospholipids.
Heat map of significantly changed lipid species (one-way ANOVA; FDR-corrected P < 0.05; n = 4 biologically independent samples) measured in duplicates using UPLC–MS. Each row represents z-score-normalized intensities of the detected lipid species. Each column represents a sample. The relative abundance of each lipid is color-coded, with red indicating high signal intensity and blue indicating low signal intensity. DAG, diacylglycerol; LysoPC, lysophosphatidylcholine; LysoPE, lysophosphatidylethanolamine; MAG monoacylglycerol; PA, phosphatidic acid; PC, phosphatidylcholine; PC P, plasmalogen PC; PE phosphatidylethanolamine; PE O, ether-linked PE; PE P, plasmalogen PE; PG, phosphatidylglycerol; PI, phosphatidylinositol; PS, phosphatidylserine; SM sphingomyelin; TAG, triacylglycerol. Lipids are annotated based on their fatty acyl compositions (for example, LysoPC 18:1 has 18 carbons and 1 double bond) or as the sum of their total number of carbons and double bonds (for example, DAG 38:4 has a total of 38 carbons and 4 double bonds).
Figure 6:
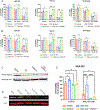
Figure 6:. Inhibition of PPAR-α activity decreases the antiferroptotic effects of oleic acid and SLC47A1 protein expression.
(A-B) HEK-293, Hep G2 and SK-N-Be(2) cells were seeded at a density of 2000 cells/well in 384 well-plates. After 90 min, cells were treated with vehicle or 50 μM oleic acid. After 24 h, cells were treated with FAC (0, 16 mM or 32 mM) and/or (A) 10 μM T0070907 (PPAR-γ antagonist) or (B) 10 μM GW 6471 (PPAR-α antagonist). After additional 24 h, cell viability was evaluated. Data are presented as % of control. Mean +/− SD (n = 3). * P < 0.05, *** P < 0.001, and **** P < 0.0001 by two-way ANOVA followed by Tukey’s multiple comparisons test. ns = non-significant. (C) ACSL3 protein levels: HEK-293 cells were seeded at a density of 1×10⁶ cells/well in 100 mm dishes. After 90 min, cells were treated with vehicle or 25 μM oleic acid (OA). After 24 h, cells were treated with vehicle (DMSO) or 15 μM GW6471. After 24 h, samples were collected for western blotting analyses. (D) SLC47A1 protein levels: HEK-293 cells were seeded at a density of 1×10⁶ cells/well in 100 mm dishes. After 90 min, cells were treated with vehicle, 12.5 or 25 μM oleic acid (OA). After 24 h, cells were treated with vehicle or 15 μM GW6471 (GW). After 24 h, samples were collected for western blotting analyses. The image is a representative of 3 separate blots with similar results. 50 kDa (green) = SLC47A1; 40 kDa (red) = beta-actin. (E) HEK-293 cells were plated at 10,000 cells per well in white 96-well plates. After 90 min, cells were treated with vehicle or 12.5 μM oleic acid. After 24 h, cells were treated with 100 nM RSL3 and/or 10 μM GW6471 (PPAR-α antagonist). After additional 24 h, cell viability was evaluated. Data are presented as % of control. Mean +/− SD (n = 4). **** P < 0.0001 by two-way ANOVA followed by Tukey’s multiple comparisons test. ns = non-significant.
Figure 7:
Figure 7:. Oleic acid pre-treatment inhibits iron-overload-induced liver lipid peroxidation and damage in mice.
Swiss male mice were pretreated with vehicle or oleic acid (600 mg/kg/day; oral route) for 10 days. Thereafter, mice were treated with a single i.p. injection of FAC (120 mg/kg) and euthanized at 4 h after FAC treatment. (A) Liver malondialdehyde (MDA), serum (B) AST and (C) LDH are presented as mean +/− SD (n = 6–7 per group). * P < 0.05, ** P < 0.01, *** P < 0.001, and **** P < 0.0001 by two-way ANOVA. ns = non-significant.

References

    1. Darshan D, Frazer DM, and Anderson GJ (2010). Molecular basis of iron-loading disorders. Expert Rev. Mol. Med 12, e36. 10.1017/S1462399410001687. - DOI - PubMed
    1. Alexander J, and Kowdley KV (2009). HFE-associated hereditary hemochromatosis. Genetics in Medicine 11, 307–313. 10.1097/GIM.0b013e31819d30f2. - DOI - PubMed
    1. Papanikolaou G, Samuels ME, Ludwig EH, MacDonald MLE, Franchini PL, Dubé M-P, Andres L, MacFarlane J, Sakellaropoulos N, Politou M, et al. (2004). Mutations in HFE2 cause iron overload in chromosome 1q–linked juvenile hemochromatosis. Nat Genet 36, 77–82. 10.1038/ng1274. - DOI - PubMed
    1. Roetto A, Totaro A, Piperno A, Piga A, Longo F, Garozzo G, Calì A, De Gobbi M, Gasparini P, and Camaschella C (2001). New mutations inactivating transferrin receptor 2 in hemochromatosis type 3. Blood 97, 2555–2560. 10.1182/blood.V97.9.2555. - DOI - PubMed
    1. Montosi G, Donovan A, Totaro A, Garuti C, Pignatti E, Cassanelli S, Trenor CC, Gasparini P, Andrews NC, and Pietrangelo A (2001). Autosomal-dominant hemochromatosis is associated with a mutation in the ferroportin (SLC11A3) gene. J. Clin. Invest 108, 619–623. 10.1172/JCI200113468. - DOI - PMC - PubMed