. 2023 Nov 21;4(11):101266.
doi: 10.1016/j.xcrm.2023.101266. Epub 2023 Nov 8.

RAGE engagement by SARS-CoV-2 enables monocyte infection and underlies COVID-19 severity

Affiliations

RAGE engagement by SARS-CoV-2 enables monocyte infection and underlies COVID-19 severity

Roberta Angioni et al. Cell Rep Med. .

Abstract

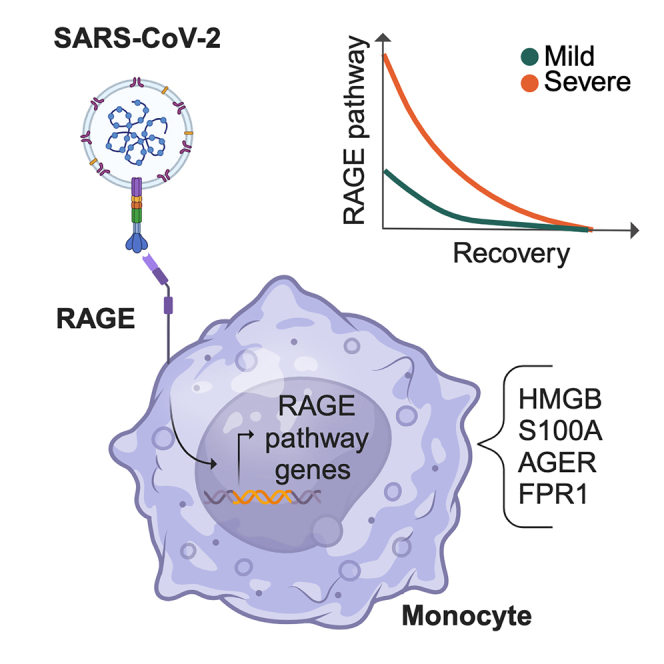
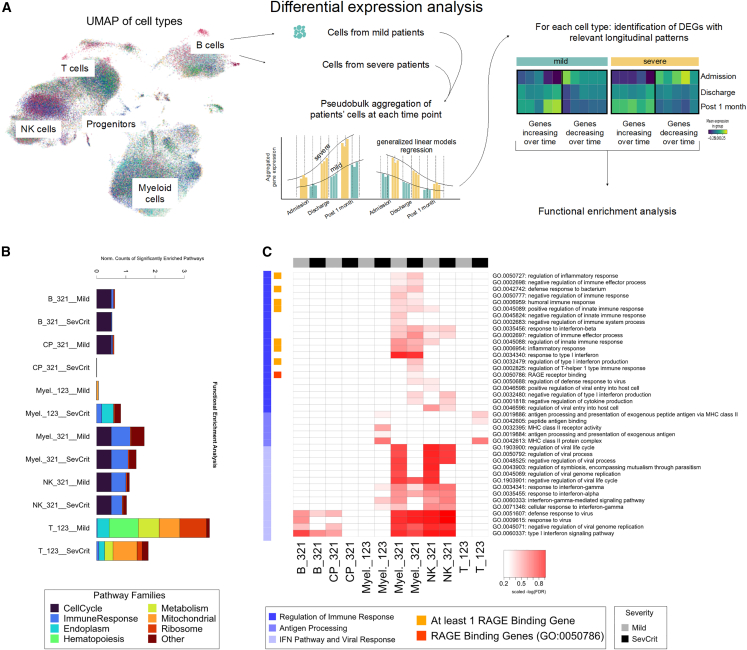
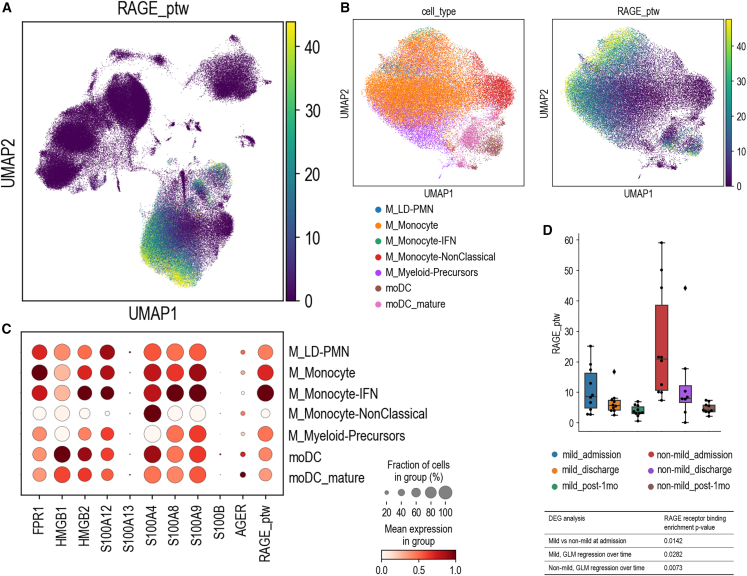
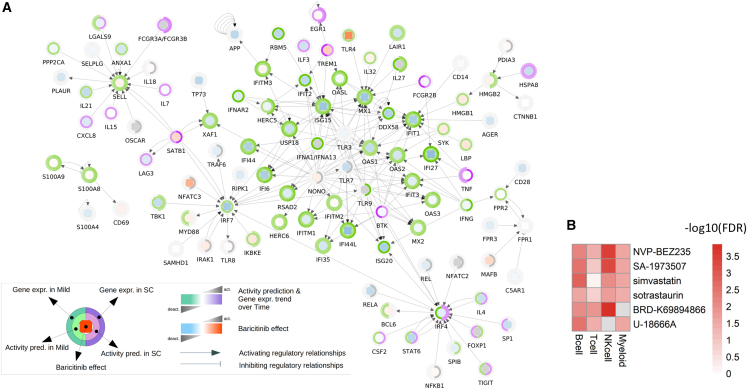
The spread of severe acute respiratory syndrome coronavirus 2 (SARS-CoV-2) has fueled the COVID-19 pandemic with its enduring medical and socioeconomic challenges because of subsequent waves and long-term consequences of great concern. Here, we chart the molecular basis of COVID-19 pathogenesis by analyzing patients' immune responses at single-cell resolution across disease course and severity. This approach confirms cell subpopulation-specific dysregulation in COVID-19 across disease course and severity and identifies a severity-associated activation of the receptor for advanced glycation endproducts (RAGE) pathway in monocytes. In vitro THP1-based experiments indicate that monocytes bind the SARS-CoV-2 S1-receptor binding domain (RBD) via RAGE, pointing to RAGE-Spike interaction enabling monocyte infection. Thus, our results demonstrate that RAGE is a functional receptor of SARS-CoV-2 contributing to COVID-19 severity.

Keywords: COVID-19; RAGE; SARS-CoV-2; disease severity; drug repurposing; longitudinal profiling; monocytes; single-cell multi-omics.


Conflict of interest statement

Declaration of interests The authors declare no competing interests.

Figures

None
Graphical abstract
Figure 1
Figure 1
COVID-19 patient single-cell transcriptomic data and cell population enrichment (A) Overview of cell clusters by uniform manifold approximation projection (UMAP) plots from the analysis of 143,428 single cells from 20 patients. Main clusters were identified and annotated by family and then classified in subclusters by specific cell type and their distribution over time (admission, discharge, and post 1 month). (B) UMAP plot of the cell colored by patient gender (left), by patient age binned in 10-year intervals (center), and by patient ID code (right). (C) Box-and-whisker plots showing the significant changes of cell type abundance for the COVID-19 samples across time and patient severity (“sev+cri” labels the combined group of severe and critical patients). The box shows the dataset quartiles, while the whiskers extend to the rest of the distribution, except for “outlier” points that are below/above the first/third quartile with a distance of more than 1.5 times the interquartile range. The p values reported are not corrected for multiple testing. ∗p ≤ 0.05, ∗∗p ≤ 0.01, ∗∗∗p ≤ 0.001. See also Figures S1 and S2A.
Figure 2
Figure 2
Functional enrichment analysis (A) Schematic of the pseudo-bulk differential expression analysis that was done with the single-cell data. (B) Stacked histograms reporting the counts of significantly enriched pathways (false discovery rate [FDR] ≤0.001 for terms with the number of genes in background between 3 and 500) by cell population, expression trend over time, and severity; the counts were normalized by the total number of terms mapped onto each pathway family. (C) Heatmap showing the distribution of the significantly enriched terms related to immunity response among the DEGs identified for each cell population, colored according to −log(FDR) of the enrichment analysis. See also Figure S2.
Figure 3
Figure 3
RAGE pathway enrichment (A) UMAP plot of the average expression of the RAGE pathway, defined as the gene score of the RAGE receptor binding GO term (GO:0050786). (B) View of selected myeloid populations (left) with the corresponding RAGE pathway gene score (right) shown in a re-computed UMAP plot. (C) Dot plot of the average expression values of the GO:0050786 gene list for each of the selected myeloid subclusters. Dots are colored according to the expression value averaged over cells labeled with the same cell type and standardized between 0 and 1 for each variable considered. The size of the dot indicates the fraction of cells within each group with an expression value greater than 0. (D) Differential analysis of the RAGE pathway gene score across time and patient severity. The box-and-whisker plot shows the value of the RAGE pathway gene score for all samples averaged over the cells of the myeloid family. The box and the whiskers are defined analogously to Figure 1B. The table lists some RAGE pathway enrichment p values, computed as described in STAR Methods. See also Figure S2.
Figure 4
Figure 4
SARS-CoV-2 binds monocytes through an alternative receptor (A) Computational model of the interaction of S1-RBD to the RAGE receptor. Regions of interaction between the two proteins are shown in cartoon representation, and residues important for the binding are explicitly shown from different point of views in (1) and (2). (B) Computations of the absolute binding free energies of the reference type and Omicron S RBDs to the RAGE receptor are the same within the errors (STAR Methods). (C) RAGE23–231 binding to S detected by microscale thermophoresis (MST). Dots are data from three independent experiments, and curves are their “one-site binding” fits, with respective calculated KD values and 95% confidence intervals reported on the graphs. (D) Representative blot of co-immunoprecipitation and quantification analysis of 4 independent experiments in human peripheral blood monocytes treated with 100 ng/mL His tag S protein (+). IgG was used as an antibody-specific control. Ø, empty well. Data are presented as mean ± SEM. Kruskal-Wallis test for multiple comparisons with Dunns post hoc test. ∗p ≤ 0.05. See also Figure S4.
Figure 5
Figure 5
RAGE-S protein interaction is required for SARS-CoV-2 entry into monocytes (A) Representative western blot (WB) of RAGE, ACE2, ADAM17, and TMPRSS2 in the THP-1 cell line, human-derived monocytes (Mono), and CaCo2. Actin was used as a loading control. (B) The binding of His tag S to THP1 cells treated with 1–2 μM azeliragon (Aze) or left untreated was measured as mean fluorescence intensity (M.F.I.) by confocal microscopy after 2 h of stimulation. (C) Plaque-forming unit (PFU) quantification after THP1 cells were infected with SARS-CoV-2 (0.01 MOI) for 24, 48, 72, and 144 h in the absence or presence of Aze and AngII. (D) RAGE internalization in human-derived monocytes exposed to 100 ng/mL S protein alone (+) or upon pre-treatment with 2 μM Aze (+Aze), measured by flow cytometry after 60 min. Data represent the M.F.I. of RAGE antibody measured by flow cytometry. Values were normalized on the RAGE M.F.I. of untreated cells (−) at 5 min of S protein treatment. (E and F) Representative images obtained by confocal microscopy (E, scale bar: 15 μm) and relative quantification (F) of heat-inactivated SARS-CoV-2 (iVirus) binding human-derived monocytes after 2 h of incubation in the absence or presence of Aze. Data are presented as M.F.I. normalized on uninfected cells. (G) Graph representing the M.F.I. (measured by confocal microscopy and normalized on uninfected cells) of iVirus that binds to wild-type (WT) and KO RAGE (ΔRAGE) THP1 cells after 2 h of incubation in the absence or presence of AngII (10 μM). Data are collected from 3 donors tested in 2 independent experiments. Dots represent individual cells identified in 10 different regions of each acquired image. (H) Representative TEM pictures of monocytes treated with replicative SARS-CoV-2 virus (+), MOI 0.1, in the presence or absence of Aze pre-treatment. (I) Virion quantification from TEM analysis. Data are presented as number of particles per field ± SEM. Kruskal-Wallis test for multiple comparisons with Dunns post hoc test. ∗p ≤ 0.05, ∗∗p ≤ 0.01, ∗∗∗p ≤ 0.001. See also Figure S5.
Figure 6
Figure 6
Candidate compounds for COVID-19 treatment based on the pathogenic mechanisms uncovered through our longitudinal study design (A) Extended network of the RAGE receptor binding interactors. In each node, three metrics are reported: on the central heatmap, the predicted effects of baricitinib on gene expression; on the inner circle, the predicted overall effect of interactors on the gene expression in mild (left half-arch) and single cell (SC; right half-arch); and on the outer circle, the measured gene expression trend in mild (left half-arch) and SC (right half-arch). (B) Heatmap showing compounds recurrently reverting gene expression signatures of severity across the cell lines tested in the CMap database. Only drugs resulting in a significant one-sided Fisher’s test false discovery rate (FDR < 0.05) in at least three cell families were selected. The color code represents the enrichment test FDR. See also Figure S6.

References

    1. The Lancet COVID-19: the next phase and beyond. Lancet. 2022;399:1753. doi: 10.1016/S0140-6736(22)00817-0. - DOI - PMC - PubMed
    1. Coronaviridae Study Group of the International Committee on Taxonomy of Viruses The species Severe acute respiratory syndrome-related coronavirus: classifying 2019-nCoV and naming it SARS-CoV-2. Nat. Microbiol. 2020;5:536–544. doi: 10.1038/s41564-020-0695-z. - DOI - PMC - PubMed
    1. Wang M.-Y., Zhao R., Gao L.-J., Gao X.-F., Wang D.-P., Cao J.-M. SARS-CoV-2: Structure, Biology, and Structure-Based Therapeutics Development. Front. Cell. Infect. Microbiol. 2020;10 doi: 10.3389/fcimb.2020.587269. - DOI - PMC - PubMed
    1. Hoffmann M., Kleine-Weber H., Schroeder S., Krüger N., Herrler T., Erichsen S., Schiergens T.S., Herrler G., Wu N.-H., Nitsche A., et al. SARS-CoV-2 Cell Entry Depends on ACE2 and TMPRSS2 and Is Blocked by a Clinically Proven Protease Inhibitor. Cell. 2020;181:271–280.e8. doi: 10.1016/j.cell.2020.02.052. - DOI - PMC - PubMed
    1. Shang J., Wan Y., Luo C., Ye G., Geng Q., Auerbach A., Li F. Cell entry mechanisms of SARS-CoV-2. Proc. Natl. Acad. Sci. USA. 2020;117:11727–11734. doi: 10.1073/pnas.2003138117. - DOI - PMC - PubMed

Publication types

Substances