. 2023 Dec;29(12):3067-3076.
doi: 10.1038/s41591-023-02586-z. Epub 2023 Nov 9.

Targeted gene expression profiling predicts meningioma outcomes and radiotherapy responses

Affiliations

Targeted gene expression profiling predicts meningioma outcomes and radiotherapy responses

William C Chen et al. Nat Med. 2023 Dec.

Abstract

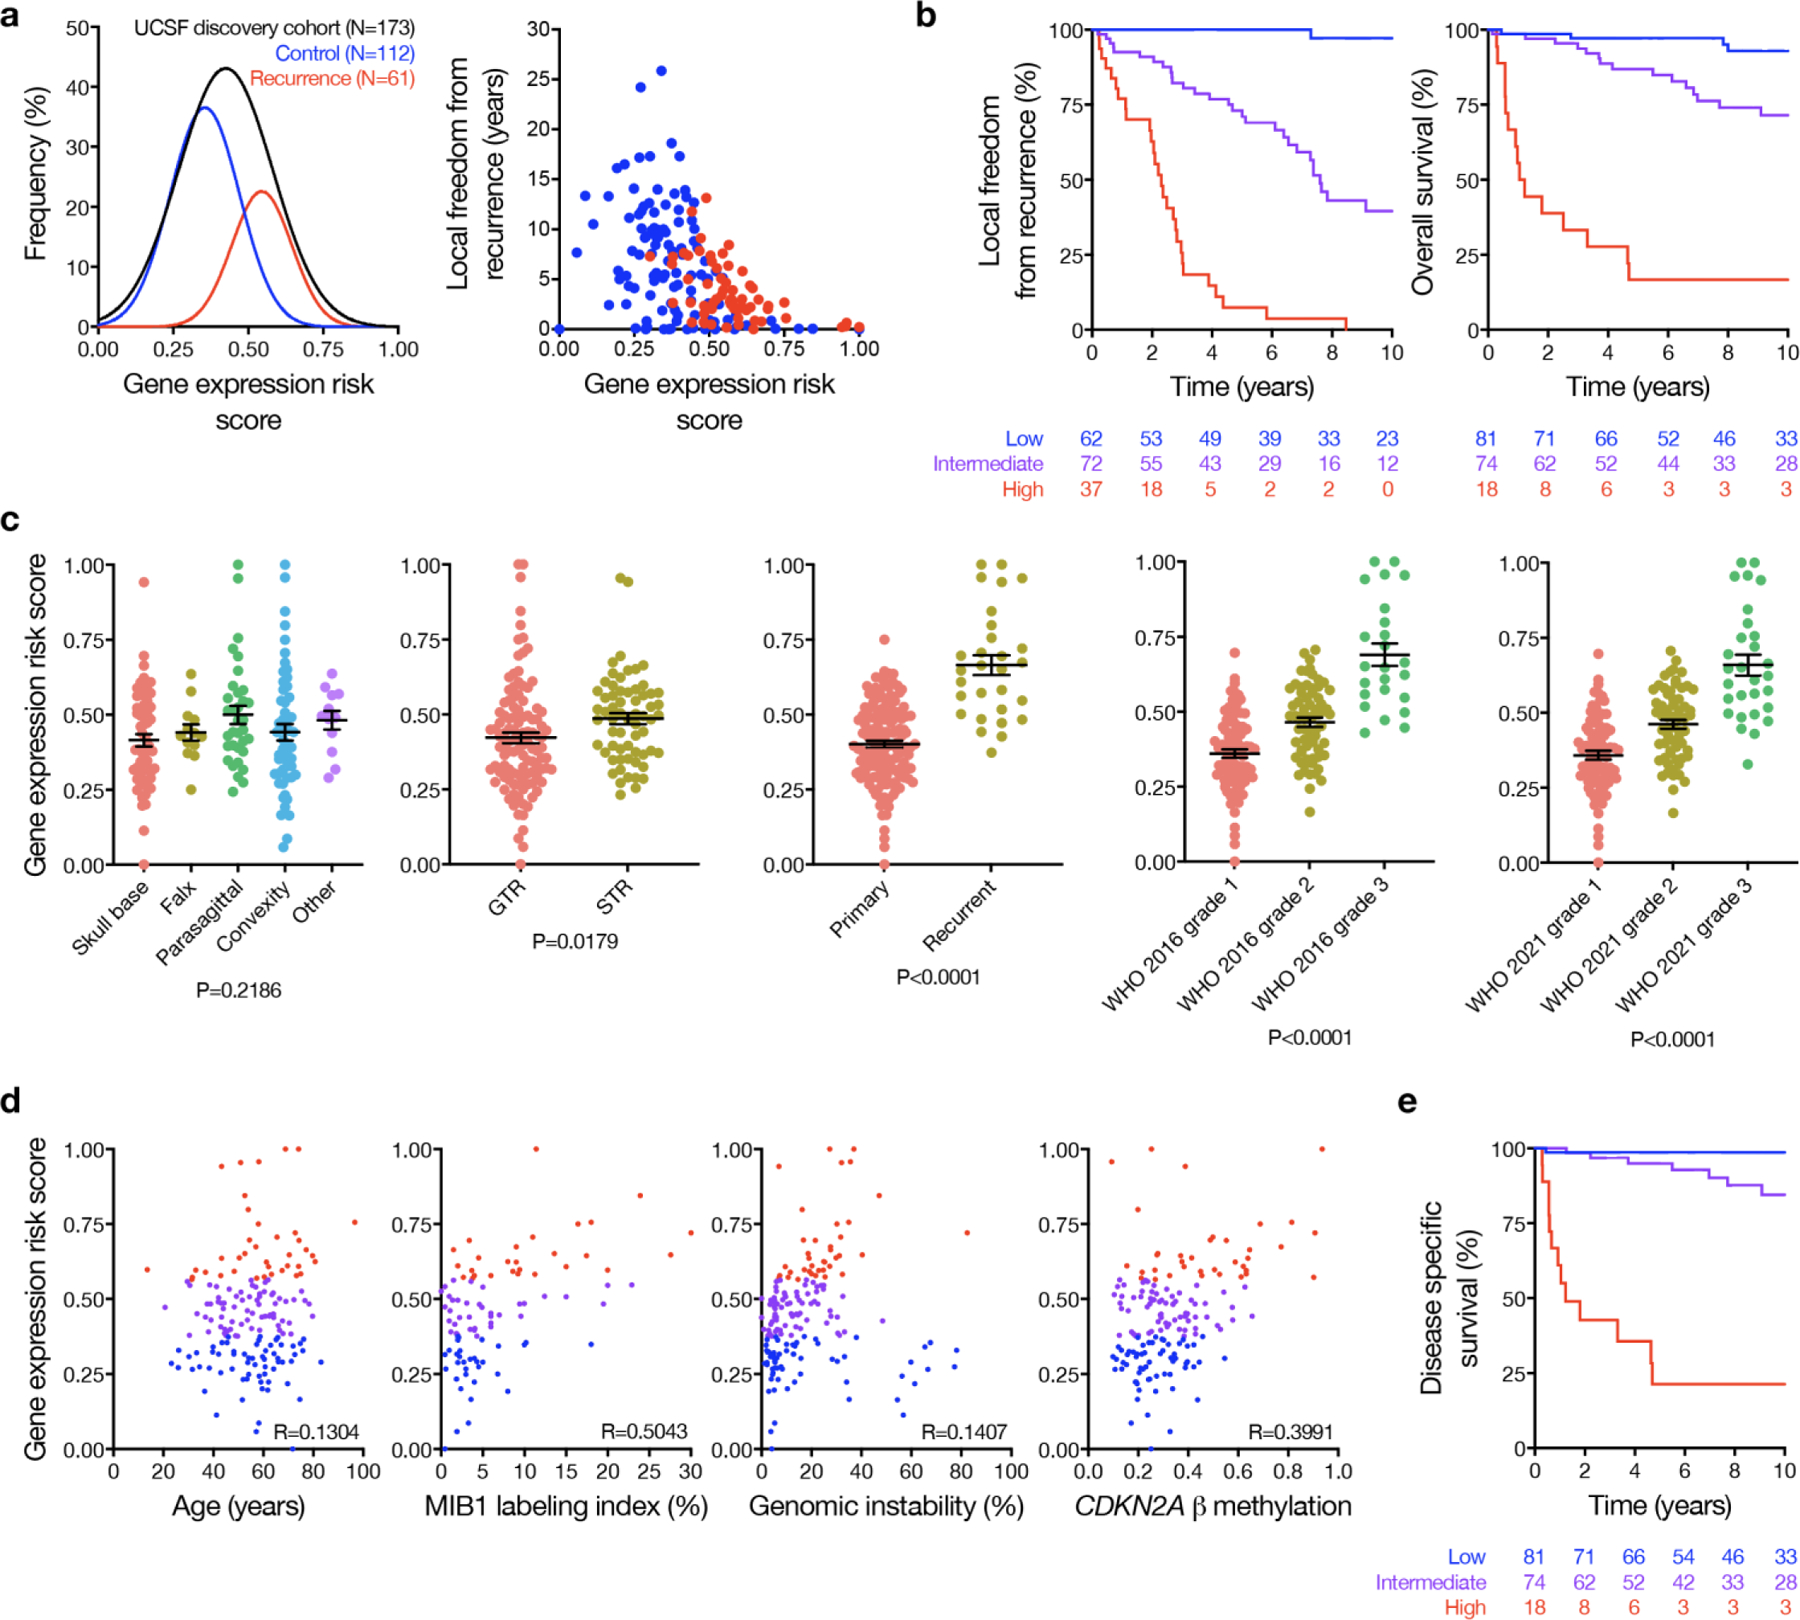
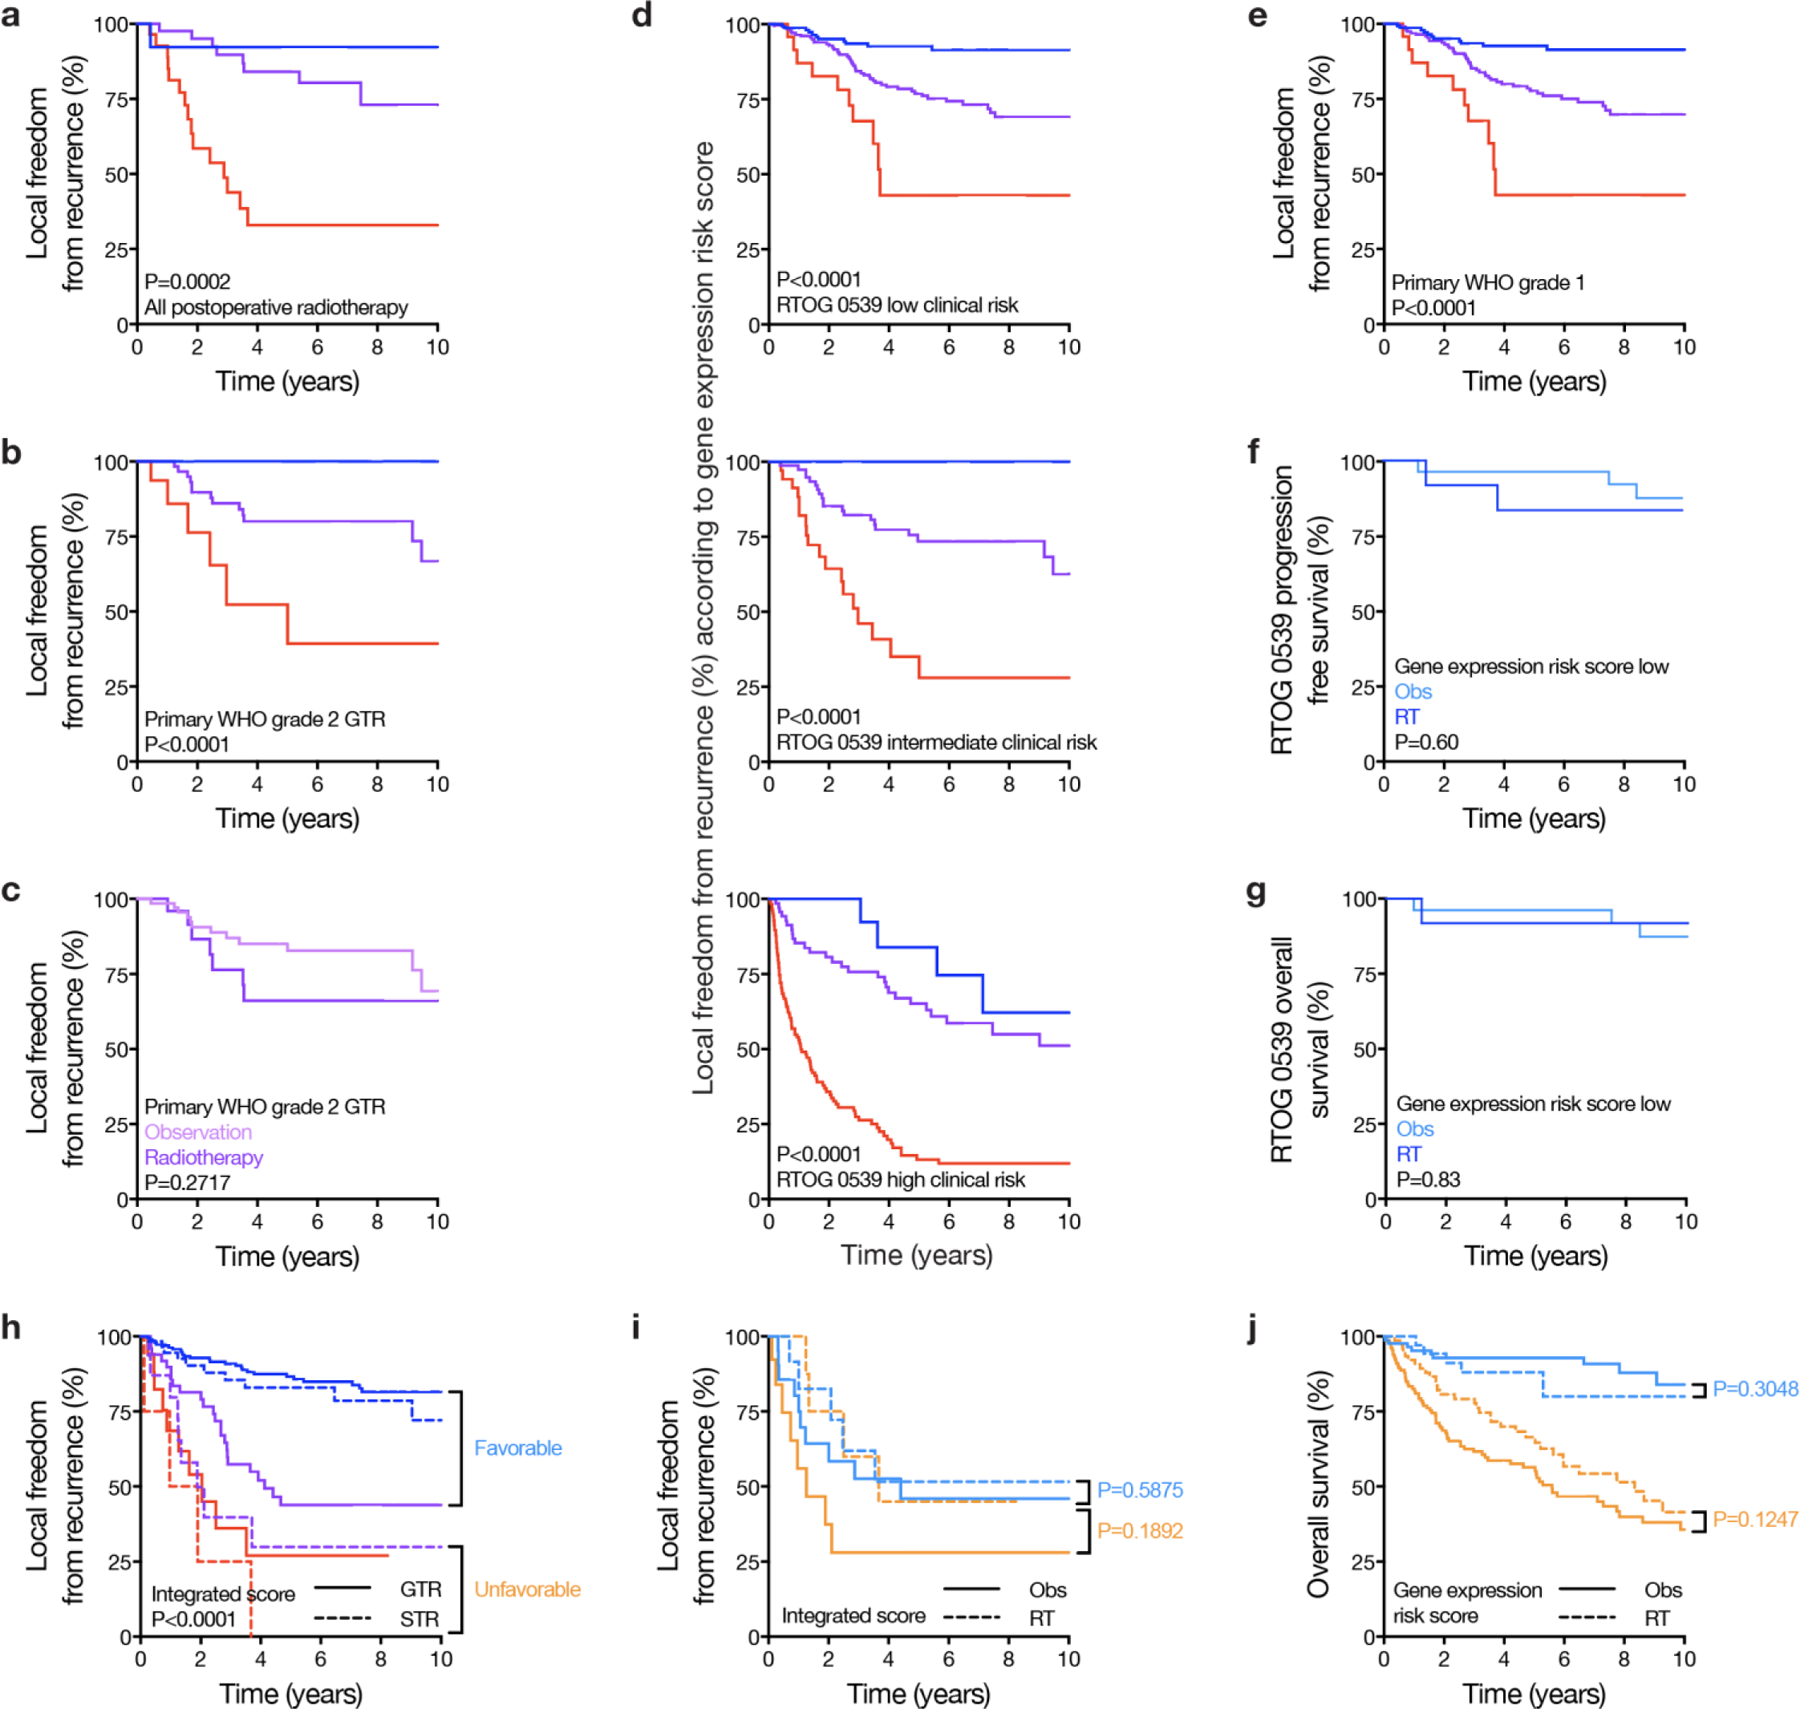
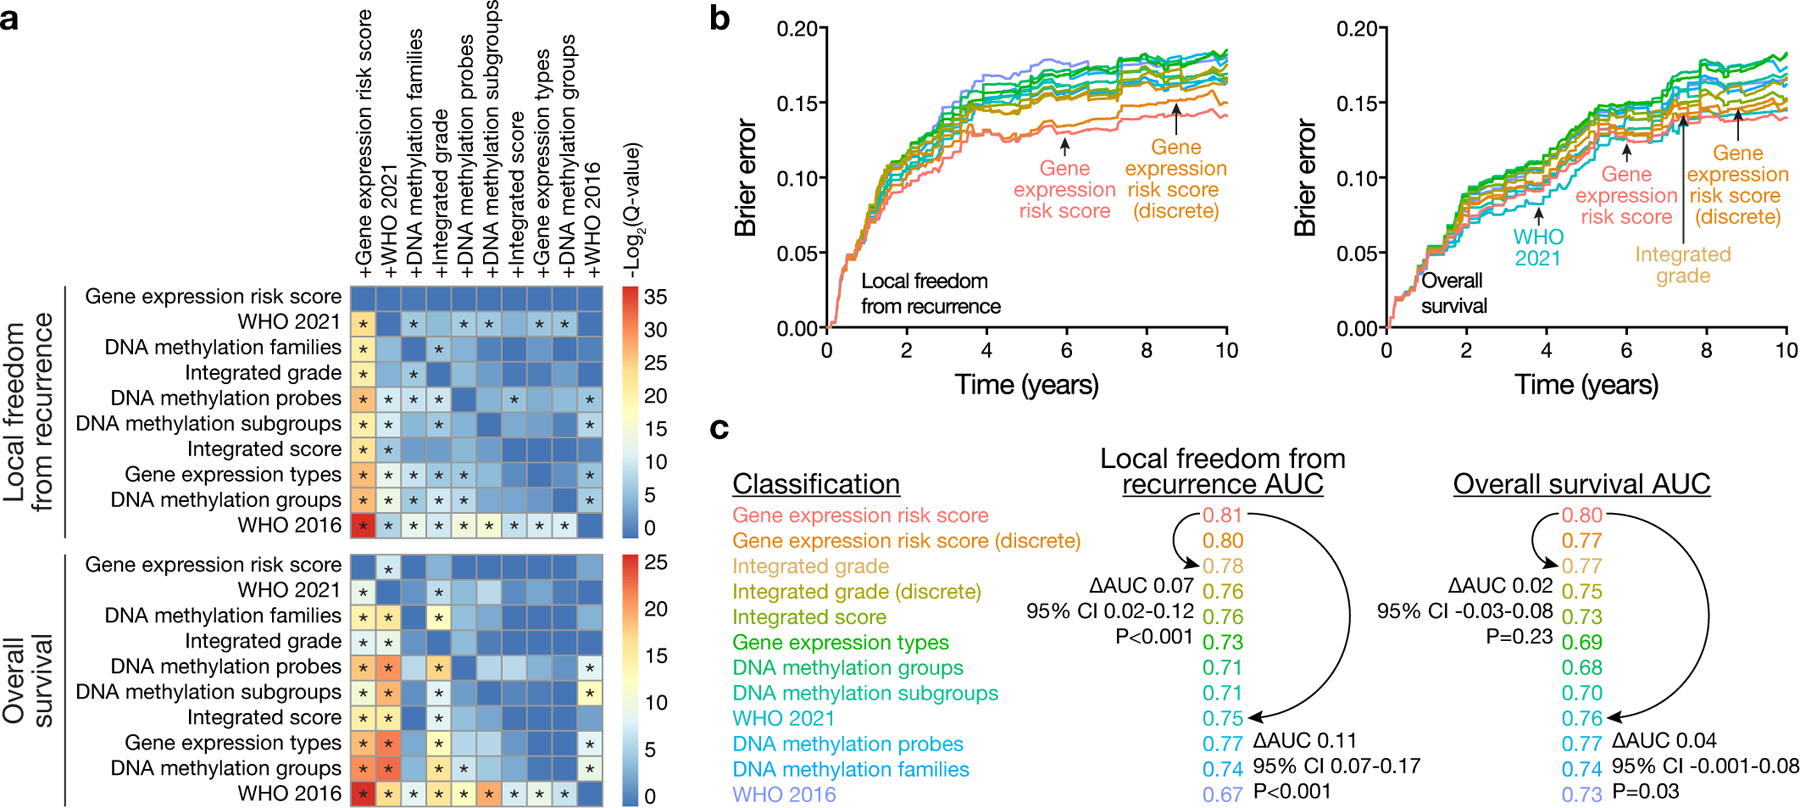
Surgery is the mainstay of treatment for meningioma, the most common primary intracranial tumor, but improvements in meningioma risk stratification are needed and indications for postoperative radiotherapy are controversial. Here we develop a targeted gene expression biomarker that predicts meningioma outcomes and radiotherapy responses. Using a discovery cohort of 173 meningiomas, we developed a 34-gene expression risk score and performed clinical and analytical validation of this biomarker on independent meningiomas from 12 institutions across 3 continents (N = 1,856), including 103 meningiomas from a prospective clinical trial. The gene expression biomarker improved discrimination of outcomes compared with all other systems tested (N = 9) in the clinical validation cohort for local recurrence (5-year area under the curve (AUC) 0.81) and overall survival (5-year AUC 0.80). The increase in AUC compared with the standard of care, World Health Organization 2021 grade, was 0.11 for local recurrence (95% confidence interval 0.07 to 0.17, P < 0.001). The gene expression biomarker identified meningiomas benefiting from postoperative radiotherapy (hazard ratio 0.54, 95% confidence interval 0.37 to 0.78, P = 0.0001) and suggested postoperative management could be refined for 29.8% of patients. In sum, our results identify a targeted gene expression biomarker that improves discrimination of meningioma outcomes, including prediction of postoperative radiotherapy responses.


Conflict of interest statement

Competing interests statement

MP has received honoraria for lectures, consultation, or advisory board participation from the following for-profit companies: Bayer, Bristol-Myers Squibb, Novartis, Gerson Lehrman Group (GLG), CMC Contrast, GlaxoSmithKline, Mundipharma, Roche, BMJ Journals, MedMedia, Astra Zeneca, AbbVie, Lilly, Medahead, Daiichi Sankyo, Sanofi, Merck Sharp & Dome, Tocagen, Adastra, Gan & Lee Pharmaceuticals. WCC and DRR are the inventors on patent PCT/US 21/70288 describing the use of targeted gene expression profiling to predict meningioma outcomes and radiotherapy responses. The remaining authors declare no competing interests.

Figures

Extended Data Fig. 1.
Extended Data Fig. 1.. Prognostic and predictive gene expression biomarker development.
a, C-index for LFFR models based on meningioma Nanostring targeted gene expression profiling plotted against the natural-log of the lambda parameter during algorithm training. Center and error bars shows the mean C-index +/− estimated SEM. Candidate model performance was estimated using 10-fold cross validation in the UCSF discovery cohort (N=173). An optimal gene set (N=34 genes, dotted lines, Extended Data Table 3) was selected within 1 standard error of the model achieving maximal c-index to reduce over-fitting. The number of genes in each model is displayed at the top of the graph. In order to further reduce over-fitting, improve calibration and stability, and facilitate risk score calculations using FFPE meningiomas or gene expression quantification from RNA sequencing or microarrays (Extended Data Fig. 4), bootstrap aggregation was used to train 500 ridge-regression sub-models using the normalized and log-transformed gene counts as inputs and discovery cohort risk scores between 0 and 1 as target variables. In brief, this procedure nominates a bootstrap aggregated risk score defined as the arithmetic mean across sub-model risk scores. b, Log2 values for Nanostring counts or RNA sequencing data (transcripts per million, TPM) for the 34 genes comprising the gene expression risk score in the frozen meningiomas from the UCSF discovery cohort (N=173), revealing high concordance with R2=0.81 (two sided F-test P<2.2×10⁻¹⁶). Similarly, a non-regularized Cox model for LFFR using RNA sequencing TPMs for the same 34 genes also achieved excellent performance in the UCSF discovery cohort (N=173 meningiomas, LFFR c-index 0.89 ± 0.02, OS c-index 0.84 ± 0.02), and outperformed 10,000 randomly sampled sets of 34 genes (one-sided bootstrap P<0.0001). c, Limitations to using RNA sequencing for targeted gene expression biomarker discovery, in comparison to using RNA sequencing for targeted gene expression biomarker validation or implementation (as described for b and as shown in Extended Data Fig. 4). The distribution of univariate LFFR Cox model two-sided unadjusted Wald test P-values for all RNA sequencing genes in the UCSF discovery cohort are shown (N=58,830 genes, N=173 meningiomas). A background uniform distribution is evident, with a peak towards lower P-values. Between P=0.0 and 0.2, at least 6904 of 17437 P-values (40%) could be expected to be false positives rather than related to true biological significance. Spike-in experiments and simulations report false discovery rates across bioinformatic methods and experimental conditions for observational whole transcriptomic approaches between 10–75%, depending on the ground-truth prevalence. d, Log10 β coefficient magnitudes (red for positive coefficients, blue for negative coefficients) versus log2 transformed P-values from individual Cox models from the discovery cohort RNA sequencing are shown, demonstrating challenges with feature selection using sparse observations in high dimensional space. Despite the limitations in using RNA sequencing to discover clinical biomarkers, we show RNA sequencing can be used to validate and implement the 34-gene expression biomarker that was developed using Nanostring targeted gene expression profiling (Extended Data Fig. 4).
Extended Data Fig. 2.
Extended Data Fig. 2.. Gene expression biomarker characteristics in the discovery cohort.
a, Gaussian fits (left) to the distribution of gene expression risk scores in the UCSF discovery cohort, stratified by cases with local recurrence (red) or without local recurrence (blue) on clinical follow up. The gene expression risk score was also plotted against the time to censorship or local recurrence (right), and higher risk score correlated with greater risk of local recurrence and shorter time to recurrence. b, Kaplan Meier curves for LFFR or OS in the UCSF discovery cohort stratified by the gene expression risk score. c, Gene expression risk score distributions stratified by clinical characteristics in the UCSF discovery cohort. Mean +/− standard error measurements are shown for gene expression risk scores stratified by tumor location (skull base, N=60; falx, N=13; parasagittal, N=34; convexity, N=54; other, N=10), extent of resection (GTR, N=110; STR, N=63), setting (primary, N=144; recurrent, N=29), WHO 2016 grade (grade 1, N=83; grade 2, N=66; grade 3, N=24), and WHO 2021 grade (grade 1, N=81; grade 2, N=61; grade 3, N=29). There was no significant difference across meningioma locations (ANOVA, two-sided unadjusted P=0.22), but gene expression risk scores were higher among subtotally resected meningiomas (t-test two-sided P=0.02), recurrent meningiomas (t-test two-sided P<0.0001), and were stratified by WHO 2016 or 2021 grade (P<0.0001). Convexity meningiomas arise adjacent to the cerebral convexity underlying the calvarium, while parasagittal meningiomas abut or involve the parasagittal sinus along the calvarial midline, falx meningiomas involve the falx without extending superiorly to the parasagittal sinus, and skull base meningiomas arise adjacent to the bones of the skull base. d, UCSF discovery cohort gene expression risk score scatter plots across clinical or molecular variables associated with meningioma biology or outcomes (blue, low risk; purple, intermediate risk; red, high risk). There was no clear association between patient age and gene expression risk score, but risk score was loosely correlated with MIB1 labeling index, genomic instability as defined by the proportion of non-centromeric, non-acrocentric chromosomes affected by copy number gain or loss, and DNA methylation of the CDKN2A locus. P values shown are from a two-sided, unadjusted F-test. Thus, the gene expression biomarker correlated with surrogate markers of aggressive meningiomas. e, Disease specific survival among patients in the UCSF discovery cohort stratified by gene expression risk score.
Extended Data Fig. 3.
Extended Data Fig. 3.. Gene expression biomarker across somatic short variants in the discovery cohort.
Targeted DNA sequencing of recurrent somatic short variants was performed on 171 meningiomas from the UCSF discovery cohort (98.8%). a, Oncoplot distribution of identified pathogenic short somatic variants with variant allele frequency (VAF) of at least 5.0% (N=98 variants, median VAF 38.0%, interquartile range [IQR] 29–43%, median sequencing depth 551.5, IQR 354–856). Consistent with prior reports, variants in NF2 were most common (N=67, 39.2%), followed by TRAF7 (N=10, 5.8%) and AKT1 (N=8, 4.7%). A minority of meningiomas (N=16, 9.4%) were identified without alteration of NF2 or loss of chromosome 22q, but with a characteristic pathogenic variant in one of the following genes: TRAF7, AKT1, PIK3CA, SMARCB1, SMARCE1, SMO, SUFU, KLF4, or POLR2A. The majority of these were WHO 2021 grade 1 meningiomas (N=9, 60.0%), and were associated with favorable histologic characteristics and outcomes (median MIB1 labeling index 2.0%, range 0.5–4.0, 5-year LFFR 90.9%). TERT promoter C228T and C250T hotspot mutations were not identified in the discovery cohort. BAP1 mutations were rare (N=5, 2.9%) and correlated with high histological grade and poor outcomes (N=3 [60.0%] WHO 2016 grade 2 or 3, 5-year LFFR 40.0%). Homozygous CDKN2A/B loss, derived from meningioma DNA CNVs (Supplementary Methods), was identified in 10 meningiomas from the UCSF discovery cohort (5.8%, 80.0% WHO 2016 grade 3, 20.0% WHO 2016 grade 2) and was associated with poor outcomes (5-year LFFR 14.2%). These findings were supported by targeted DNA sequencing of recurrent somatic short variants in 35 consecutive clinical validation cohort meningiomas from The University of Hong Kong using the same approach. b, Same oncoplot from the UCSF discovery cohort as in a, but ordered by VAF instead of gene expression risk score.
Extended Data Fig. 4.
Extended Data Fig. 4.. Gene expression biomarker characteristics in the analytical validation cohort.
a, Gene expression risk score concordance across multiple conditions and replicates. Test-retest conditions (combined N=44, R=0.94, P<0.0001) were comprised of varying probe batches (N=10, R=0.98, P<0.0001), within probe batch testing of technical replicates (N=12, R=0.98, P<0.0001), and test-retest conditions for meningiomas with serial RNA extraction on the same FFPE block or frozen tumor chunk at least 4 weeks apart (N=22, R=0.94, P<0.001). Gene expression risk scores on paired frozen/FFPE meningiomas also demonstrated high concordance (N=90, R=0.88, P<0.001), and FFPE gene expression risk scores provided excellent discrimination of outcomes across FFPE clinical validation datasets, including a prospective clinical trial (Fig. 2, 3, 5 and Extended Data Fig. 5, 6, 8). b, Principal component analysis on FFPE gene expression risk scores from meningiomas processed at multiple laboratories spanning academic institutions (Northwestern University, San Francisco Veterans Administration) or Clinical Laboratory Improvement Amendments (CLIA) certified private industry (Canopy Biosciences), demonstrating no laboratory batch effects. c, Publicly available microarray and clinical data were used to test the performance of the gene expression risk score on a non-Nanostring platform (N=33 of 34 genes available). No paired microarray/Nanostring data was available to train a calibration model, which precluded direct comparison. Thus, the RNA sequencing calibration model described below (and described in further detail in the Supplementary Methods) was adapted to microarray data as an exploratory analysis, yielding prognostic risk groups as shown in the Kaplan Meier plot (P=0.0014, Log-rank test). d, Concordance of gene expression risk scores derived from RNA sequencing or Nanostring targeted gene expression profiling on the same meningiomas (N=469 meningiomas, R=0.89, F-test two-sided unadjusted P<0.0001). e, Distribution of gene expression risk scores (mean +/− SEM is shown) derived from RNA sequencing of cohorts overlapping (UCSF, The University of Hong Kong, N=502) or non-overlapping (Caris Life Sciences, Heidelberg University, Brigham and Women’s Hospital, University Hospital Magdeburg, Children’s Brain Tumor Network, Baylor College of Medicine, N=640) with the discovery or clinical validation cohorts, comprising 1142 unique meningiomas. Gene expression risk scores remained well distributed across all datasets, including RNA sequencing of pediatric meningiomas (Children’s Brain Tumor Network, N=29), meningiomas with KLF4 or AKT1 somatic short variants (University Hospital Magdeburg, N=31), or FFPE (N=428) or frozen (N=718) meningiomas, and demonstrated similar stratification by 2016 WHO histological grade as with Nanostring targeted gene expression profiling analyses (Extended Data Fig. 2c). f, Principal component analysis of gene expression risk scores across RNA sequencing cohorts after correction for batch effects using the COMBAT pipeline in the sva package in R. g, LFFR or OS stratified by gene expression risk scores from RNA sequencing of cohorts with available clinical data (UCSF discovery, The University of Hong Kong, and Baylor College of Medicine).
Extended Data Fig. 5.
Extended Data Fig. 5.. Gene expression biomarker characteristics in the clinical validation cohort.
A, Kaplan Meier curves for LFFR stratified by gene expression risk score (blue lines, low risk; purple lines, intermediate risk; red lines, high risk) for individual clinical validation cohorts, including The University of Hong Kong (Frozen N=339; c-index=0.80; low risk N=122, 5-year LFFR 95.1%; intermediate risk N=151, 5-year LFFR 73.6%; high risk N=66, 5-year LFFR 19.5%), Northwestern University (Frozen and FFPE N=180; c-index=0.74; low risk N=42, 5-year LFFR 90.0%; intermediate risk N=98, 5-year LFFR 76.0%; high risk N=42, 5-year LFFR 21.4%), UCSF WHO grade 2 or grade 3 (FFPE N=158; c-index=0.78; low risk N=24, 5-year LFFR 87.4%; intermediate risk N=69, 5-year LFFR 77.5%; high risk N=65, 5-year LFFR 22.0%), Baylor College of Medicine (Frozen N=116; c-index=0.77; low risk N=35, 5-year LFFR 90.0%; intermediate risk N=61, 5-year LFFR 63.0%; high risk N=20, 5-year LFFR 0.0%), and Heidelberg University plus the Medical University of Vienna (FFPE N=61 with LFFR data; c-index=0.76; low risk N=24, 5-year LFFR 80.4%; intermediate risk N=23, 5-year LFFR 48.1%; high risk N=14, 5-year LFFR 19.3%). The gene expression risk score remained well calibrated across multiple independent clinical validation cohorts comprising both frozen and FFPE meningiomas. When assessed separately within each independent retrospective cohort site, the gene expression risk score remained independently prognostic in multivariate analysis combining the risk score with WHO 2016 grade (P<0.001 in all cases, two-sided unadjusted Wald test P-value). B, Kaplan Meier curves for LFFR in clinical validation cohort meningiomas stratified by gene expression risk score within WHO 2021 grades, demonstrating that the gene expression biomarker remained discriminatory across WHO 2021 grade 1 (low risk N=114, intermediate risk N=127, high risk N=26), WHO 2021 grade 2 (low risk N=7, intermediate risk N=17, high risk N=26), and WHO 2021 grade 3 meningiomas (low risk N=2, intermediate risk N=46, high risk N=98). Shown are two-sided unadjusted Log-rank P-values. C, Forest plots of hazard ratios (HR) with 95% confidence intervals (CI) for local recurrence (left) or death (right) for each 0.1 increase in gene expression risk score are shown (center and error bars denote the hazard ratio and 95% confidence interval). The gene expression biomarker was prognostic across all molecular classification systems tested for both recurrence and survival. HRs according to gene expression risk score across meningioma settings, extent of resection (EOR), and WHO grades from Fig. 2b are re-presented for ease of comparison to HRs in molecular classification systems. P values shown are from two-sided unadjusted Wald’s tests. Overall, in the retrospective clinical validation cohort, LFFR Harrel’s c-index/Uno’s c-index for the gene expression biomarker was 0.78/0.77 (N=854), while LFFR c-index was 0.68/0.66 for WHO 2016 grade (N=854), 0.72/0.71 for WHO 2021 grade (N=462), 0.72/0.73 for integrated score (N=398), 0.73/0.73 for integrated grade (N=460), 0.68/0.69 for DNA methylation groups (N=460), 0.69/0.70 for DNA methylation subgroups (N=460), 0.74/0.73 for DNA methylation probes (N=455), and 0.70/0.71 for gene expression type (N=389). OS Harrel’s c-index/Uno’s c-index for the gene expression biomarker was 0.78/0.78 (N=863), while OS c-index was 0.72/0.72 for WHO 2016 grade (N=863), 0.74/0.73 for WHO 2021 grade (N=463), 0.73/0.72 for integrated score (N=410), 0.75/0.75 for integrated grade (N=460), 0.66/0.66 for DNA methylation groups (N=460), 0.68/0.68 for DNA methylation subgroups (N=460), 0.73/0.74 for DNA methylation probes (N=455), and 0.70/0.67 for gene expression type (N=386).
Extended Data Fig. 6.
Extended Data Fig. 6.. Molecular classification comparisons in the clinical validation cohort.
Kaplan Meier curves are shown for LFFR (shown are two-sided unadjusted Log-rank P-values) in clinical validation cohort meningiomas stratified by molecular risk groups (blue lines, low risk; purple lines, intermediate risk; red lines, high risk) using the gene expression biomarker in a, or 2 contemporary supervised meningioma classification systems based on combined molecular and clinical features: integrated grade based on CNVs and mitoses in b, or integrated score based on CNVs, DNA methylation families, and WHO 2016 grade in c. In a, the gene expression biomarker remained robustly discriminatory across integrated grade or integrated score risk groups, concordant with the independent prognostic value of the gene expression risk score on multivariate analyses (Extended Data Table 10, 11) and within groups from the 6 other molecular and/or histological classification systems tested (Fig. 3a). The converse was examined in b and c, where integrated grade was unable to discriminate outcomes across gene expression risk score groups, and integrated score had limited discriminatory power for intermediate and high gene expression risk score groups and was not discriminatory for low gene expression low risk groups.
Extended Data Fig. 7.
Extended Data Fig. 7.. Gene expression biomarker nomograms for meningioma outcomes.
A, Nomograms are shown for prediction of 5-year LFFR or OS based on gene expression risk score, extent of resection, setting, and WHO 2016 histologic grade. To use the nomograms, use a straight-edge to draw a vertical line between the variable of interest and the points scale at the top of the nomogram to determine the contribution in points to the total score for each variable. Add up the points from each variable, and then draw a vertical line from the total points scale at the bottom of the nomogram to the 5-year outcome scale to determine the estimated outcome. B, Calibration curves are shown for the models corresponding to the nomograms in Fig. 4a for LFFR (top) and OS (bottom) using the gene expression risk score, extent of resection, primary vs recurrent status, and WHO 2021 grade (and the addition of age for OS). The calibrate function from the rms package in R was used, with B=1000 iterations and N=75 samples per group. Center and error bars denote the predicted 5-year LFFR versus the observed 5-year LFFR calculated via the Kaplan Meier method, with a 95% confidence interval. c, Calibration curves corresponding to the nomograms in a, for LFFR (top) and OS (bottom) using 150 samples per group. Center and error bars denote the predicted 5-year LFFR versus the observed 5-year LFFR calculated via the Kaplan Meier method, with a 95% confidence interval. d, Time dependent AUC is shown for LFFR and OS for the retrospective clinical validation cohort (N=866) as a function of time.
Extended Data Fig. 8.
Extended Data Fig. 8.. Molecular classification systems and response to treatment.
Kaplan Meier curves are shown for LFFR or OS (shown are two-sided unadjusted Log-rank P-values) in retrospective clinical validation cohort meningiomas or prospective RTOG 0539 meningiomas, stratified by gene expression risk score (blue lines, low risk; purple, intermediate risk lines; red lines, high risk), extent of resection, postoperative observation (Obs), or postoperative radiotherapy (RT). a, Primary retrospective clinical validation cohort meningiomas receiving postoperative external beam radiotherapy (N=89) stratified by gene expression risk score (low risk N=14, intermediate risk N=45, high risk N=30), revealing the gene expression biomarker remained prognostic among patients receiving postoperative radiotherapy. b, Primary WHO 2016 grade 2 meningiomas with GTR from the retrospective clinical validation cohort stratified by gene expression risk score (N=21 low risk, N=63 intermediate risk, N=18 high risk). The gene expression risk score remained prognostic among gross totally resected primary WHO grade 2 meningiomas (N=102, HR for local recurrence of 1.75 per 0.1 increase, 95% CI 1.18–2.59, P=0.0057). c, Primary WHO grade 2 meningiomas with GTR from the retrospective clinical validation cohort stratified by postoperative radiotherapy (N=28) or observation (N=74). Patients with meningiomas meeting these criteria were eligible for 2 Phase III randomized multi-institutional trials (NRG BN003 and ROAM-EORTC 1308) examining clinical outcomes with postoperative radiotherapy versus observation. Postoperative radiotherapy did not offer a benefit to patients with meningiomas meeting these criteria in the retrospective clinical validation cohort. d, Retrospective clinical validation cohort meningiomas stratified by gene expression risk score across RTOG 0539 clinical risk groups (low clinical risk, primary WHO grade 1 meningiomas; intermediate clinical risk, recurrent WHO grade 1 meningiomas or primary WHO grade 2 meningiomas status post GTR; high clinical risk, recurrent or STR WHO grade 2 meningiomas or WHO grade 3 meningiomas after any resection). The gene expression biomarker remained prognostic across RTOG 0539 low clinical risk (gene expression risk score low risk N=173, intermediate risk N=224, high risk N=27), RTOG 0539 intermediate clinical risk (gene expression risk score low risk N=32, intermediate risk N=80, high risk N=38), and RTOG 0539 high clinical risk groups (gene expression risk score low risk N=16, intermediate risk N=75, high risk N=128). e, Primary WHO grade 1 meningiomas from the retrospective clinical validation cohort (equivalent to RTOG 0539 low clinical risk meningiomas) stratified by gene expression risk score (N=173 low risk, N=224 intermediate risk, N=27 high risk, 5-year LFFR 92.7%, 77.3%, and 43.0% for low, intermediate, or high risk meningiomas, respectively). f and g, Prospective validation cohort meningiomas from RTOG 0539 identified as low risk by the gene expression biomarker stratified by postoperative radiotherapy (N=12 WHO 2016 grade 2 or 3 or recurrent WHO 2016 grade 1 meningiomas) or observation (N=27 primary WHO 2016 grade 1 meningiomas). These analyses showed favorable outcomes for prospectively collected meningiomas with low gene expression risk scores across clinical risk strata, consistent with findings from retrospective clinical validation cohort meningiomas. More broadly, these data support the hypothesis that the gene expression biomarker may be useful for identifying meningiomas where postoperative radiotherapy could be safely omitted, even in the setting of conventionally high risk clinical features. h, Meningiomas treated with surgical monotherapy from the retrospective clinical validation cohort stratified by integrated score (the only contemporary molecular classification system potentially providing additional prognostic information for LFFR within gene expression biomarker strata, Extended Data Fig. 6c) and extent of resection. Favorable (light blue) and unfavorable (yellow) groups were identified using the same criteria for identification of biomarker/surgical strata (Fig. 5a). I, Favorable and unfavorable strata based on integrated score were unable to identify meningiomas benefitting from postoperative radiotherapy even after propensity matching on integrated score, extent of resection, and WHO 2016 grade. j, OS in the same meningiomas as Fig. 5c (i.e. propensity matched favorable and unfavorable retrospective clinical validation cohort meningiomas based on biomarker/surgical strata), demonstrating a trend towards benefit with postoperative radiotherapy for unfavorable meningiomas.
Extended Data Fig. 9.
Extended Data Fig. 9.. Biomarker risk score gene distribution in tumor versus microenvironment cell types from meningioma single-cell RNA sequencing.
a, Single-cell RNA sequencing uniform manifold approximation and projection (UMAP) of 57,114 transcriptomes from 8 human meningioma samples and 2 human dura samples shaded by cell clusters that were defined using cell signature gene sets, cell cycle analysis, and differentially expressed cluster marker genes, as previously reported. Image is reproduced with permission. b, Feature plots showing normalized biomarker risk score gene expression across reduced dimensionality clusters of meningioma and tumor microenvironment cells. 33 of 34 biomarker genes were available for analysis in meningioma single-cell RNA sequencing data from a, although several were sparsely captured in single-cell RNA data (a known limitation that can be overcome using bulk RNA sequencing or Nanostring hybridization targeted gene expression profiling).
Figure 1.
Figure 1.. Study design and gene expression biomarker characteristics.
a, Study design and numbers of meningiomas used for gene expression biomarker development, analytical validation (Extended Data Fig. 4 and Extended Data Table 4), clinical validation, and comparison across classification systems. See Supplementary Methods, Table 1, and Extended Data Table 1–9 for additional details. Numbers in black text denote intersecting (e.g. 173, 332) or non-intersecting (e.g. 714, 534, 103) meningiomas used for each analysis. Color-matched numbers in adjacent text annotations denote the total number of meningiomas (whether intersecting or non-intersecting) that were used for each analysis. Superscript numbers correspond to manuscripts reporting comparator meningioma classification systems in the References. b, Upset plot of 4898 bioinformatic assays (horizontal) performed across 1856 unique meningiomas (vertical) to define and compare molecular classification systems in this study. c and d, Distribution of continuous (c) or discrete (d) gene expression risk scores in principal component space. Dots represents individual meningiomas from the training, multicenter retrospective, and prospective clinical validation cohorts (N=1142). e, Loading scores for the 34 genes comprising the gene expression biomarker. A simplified color scheme shows genes associated with higher risk in red and genes associated with lower risk in blue in the first 2 principal components. Further information regarding the biological significance of these genes can be found in the Supplementary Methods and Supplement Table 3.
Figure 2.
Figure 2.. Gene expression biomarker discrimination of meningioma outcomes.
a, Kaplan Meier curves for LFFR or OS in the multicenter retrospective clinical validation cohort stratified by gene expression risk score (N=866 meningiomas, 6 institutions, N=854 with LFFR data, N=863 with OS data). P values shown are from a two-sided Log-rank test. Low, intermediate, and high gene expression risk scores were associated with 5-year LFFR of 92.2% (95% CI, 88.3–96.2%), 72.6% (95% CI 67.8–77.8%), and 19.4% (95% CI 13.5–28.0%), and 5-year OS of 95.3% (95% CI 92.9–97.8%), 83.3% (95% CI 79.3–87.5%), and 44.3% (95% CI 35.6–55.1%), respectively. b, Forest plot of hazard ratios (HR) with 95% confidence intervals (CI) for local recurrence or death in the multicenter retrospective clinical validation cohort for each 0.1 increase in gene expression risk score across meningioma settings (primary or recurrent), extent of resection (EOR), WHO grades, or multivariate analysis. N refers to the number of meningiomas included within each strata for which the hazard ratio is reported. For multivariate analysis, the variables shown in parentheses were included as covariates, and N refers to the number of meningiomas included in multivariate analysis. P values are from a two-sided Wald’s test without multiple comparisons adjustment.
Figure 3.
Figure 3.. Gene expression biomarker comparisons to other meningioma classification systems.
a, Heatmap of −Log2-transformed two-sided P-values with false-discovery-rate (FDR) correction (Q-values) for pairwise likelihood-ratio tests of improvements in Cox regression models for LFFR or OS. Meningioma classification systems in columns (e.g. +Gene expression risk score) were combined with meningioma classification systems in rows. The performance of combined models was assessed using 290 consecutive meningiomas from The University of Hong Kong validation cohort with available data to define all 10 meningioma classification systems tested. Asterixis denote Benjamini-Hochberg corrected Q<0.01. Combination with the gene expression risk score improved all other models tested for both LFFR and OS (first column). Conversely, no models improved the gene expression risk score for LFFR (first row, top heatmap), and only WHO 2021 grade provided improvement for OS (first row, bottom heatmap). These findings were additionally validated using multivariate analyses (Supplement Data Table 10, 11) and Kaplan Meier analyses (Extended Data Fig. 5, 6). b, Brier error curves over time for LFFR or OS in the same retrospective validation cohort as in a. The gene expression biomarker achieved the lowest Brier error score over time for LFFR across meningioma classification systems and had an error score that was comparable to WHO 2021 grade and integrated grade over time for OS. c, 5-year time dependent area under the receiver operating characteristic (AUC) for all meningioma classification systems tested. AUC values reflect the performance of each system in all multicenter retrospective clinical validation cohort meningiomas (N=866 meningiomas, 6 institutions) with available data to define each system tested (Supplement Data Table 4, 10, 11). Pairwise comparisons were performed for select systems using bootstrap delta-AUC. P values shown are 1-sided bootstrap P values. The gene expression biomarker achieved the highest 5-year AUC for LFFR and OS across meningioma classification systems, with a delta-AUC for LFFR of +0.07 (95% CI 0.02–0.12, P<0.001) compared to the next best performing system (integrated grade), and a delta-AUC of +0.11 for LFFR (95% CI 0.07–0.17, P<0.001) and +0.04 for OS (95% CI −0.001–0.08, P=0.03) compared to the current standard of care (WHO 2021 grade). As was the case for AUC calculations, the number of meningiomas included in each delta-AUC comparison varied depending on the number of meningiomas in the multicenter retrospective clinical validation cohort with available data to define the systems tested in each comparison (Supplement Data Table 4, 10, 11). Unless specified (as in a.), P values are not corrected for multiple comparisons.
Figure 4.
Figure 4.. Gene expression biomarker nomograms for meningioma outcomes.
a, Nomograms are shown for prediction of 5-year LFFR (left) or OS (right) based on gene expression risk score, setting (primary or recurrent), extent of resection, and WHO 2021 grade using data from the multicenter retrospective clinical validation cohort. Similar nomograms based on WHO 2016 grade are available in Extended Data Fig. 7. To use the nomograms, use a straight-edge to draw a vertical line between the variable of interest and the points scale at the top of the nomogram to determine the contribution in points to the total score for each variable. Add up the points from each variable, and then draw a vertical line from the total points scale at the bottom of the nomogram to the 5-year outcome scale to determine the estimated outcome.
Figure 5.
Figure 5.. Gene expression biomarker prediction of meningioma radiotherapy responses and prognostic validation in samples from a prospective clinical trial.
a, Kaplan Meier curves for LFFR for meningiomas in the multicenter retrospective clinical validation cohort that were treated with surgical monotherapy, stratified by extent of resection and the gene expression risk score. 5-year LFFR was 96.1% for gene expression low risk meningiomas with GTR, 80.3% for gene expression low risk with STR, 80.5% for gene expression intermediate risk with GTR, 54.9% for gene expression intermediate risk with STR, 30.0% for gene expression high risk with GTR, and 9.8% for gene expression high risk with STR. Meningiomas were grouped as favorable (N=442) or unfavorable (N=210) as shown if they had >80% or <80% 5-year LFFR, respectively, for subsequent analyses. P value shown is from a two-sided Log-rank test. b, Kaplan Meier curves for LFFR of favorable versus unfavorable primary WHO grade 2 meningiomas in the multicenter retrospective clinical validation cohort that received postoperative radiotherapy (RT) or underwent postoperative observation (Obs). Unfavorable primary WHO grade 2 meningiomas benefitted from postoperative radiotherapy (HR 0.33, 95% CI 0.14–0.76, two-sided Log-rank P=0.009), while favorable primary WHO grade 2 meningiomas did not (two-sided Log-rank P=0.88). c, Kaplan Meier curves for LFFR of favorable versus unfavorable propensity matched meningiomas in the multicenter retrospective clinical validation cohort that received postoperative radiotherapy or underwent postoperative observation. P values shown are from two-sided Log-rank tests. Cases were first stratified by favorable versus unfavorable criteria, and then matched based on gene expression risk score, extent of resection, and WHO grade (Supplement Data Table 12). Unfavorable propensity matched meningiomas benefitted from postoperative radiotherapy (HR 0.54, 95% CI 0.37–0.78, P=0.0001), while favorable propensity matched meningiomas did not (P=0.42). d, Sankey plot of RTOG 0539 clinical risk groups versus gene expression biomarker risk groups in the multicenter retrospective clinical validation cohort (left) or the multicenter prospective clinical validation cohort from RTOG 0539 itself (right). Compared to clinical risk groups used for postoperative radiotherapy stratification in RTOG 0539, the gene expression biomarker re-classified 52.0% (N=416, Supplement Data Table 15) of retrospective validation cohort meningiomas, and 39.8% (N=41, Supplement Data Table 15) of RTOG 0539 meningiomas. Reclassified meningiomas were better stratified by gene expression risk (Fig. 8d). e, Kaplan Meier curves for PFS of patients enrolled on RTOG 0539, stratified by meningioma gene expression risk score. P values are from 2-sided Log-rank tests. 5-year PFS was 92.0%, 76.5%, and 38.6% for gene expression low, intermediate, and high risk groups, respectively (c-index 0.73). f. Panel shows Kaplan Meier curves for OS of patients enrolled on RTOG 0539, stratified by meningioma gene expression risk score. 5-year OS was 94.7%, 85.7%, and 63.0% for gene expression low, intermediate, and high risk groups, respectively (c-index 0.73). P value is from a two-sided Log-rank test. Unless specified, P values are not corrected for multiple comparisons.

Update of

  • Targeted gene expression profiling predicts meningioma outcomes and radiotherapy responses.
    Raleigh D, Chen W, Choudhury A, Youngblood M, Polley MY, Lucas CH, Mirchia K, Maas S, Suwala A, Won M, Bayley J, Harmanci A, Harmanci A, Klisch T, Nguyen M, Vasudevan H, McCortney K, Yu T, Bhave V, Lam TC, Pu J, Leung G, Chang J, Perlow H, Palmer J, Haberler C, Berghoff A, Preusser M, Nicolaides T, Mawrin C, Agnihotri S, Resnick A, Rood B, Chew J, Young J, Boreta L, Braunstein S, Schulte J, Butowski N, Santagata S, Spetzler D, Bush NAO, Villanueva-Meyer J, Chandler J, Solomon D, Rogers C, Pugh S, Mehta M, Sneed P, Berger M, Horbinski C, McDermott M, Perry A, Bi W, Patel A, Sahm F, Magill S. Raleigh D, et al. Res Sq [Preprint]. 2023 Mar 20:rs.3.rs-2663611. doi: 10.21203/rs.3.rs-2663611/v1. Res Sq. 2023. Update in: Nat Med. 2023 Dec;29(12):3067-3076. doi: 10.1038/s41591-023-02586-z. PMID: 36993741 Free PMC article. Updated. Preprint.

References

    1. Ostrom QT, Price M, Neff C, et al. CBTRUS Statistical Report: Primary Brain and Other Central Nervous System Tumors Diagnosed in the United States in 2015–2019. Neuro Oncol 2022;24(Suppl 5):v1–v95. doi:10.1093/neuonc/noac202 - DOI - PMC - PubMed
    1. Reihl SJ, Patil N, Morshed RA, et al. A population study of clinical trial accrual for women and minorities in neuro-oncology following the NIH Revitalization Act. Neuro Oncol 2022;24(8):1341–1349. doi:10.1093/neuonc/noac011 - DOI - PMC - PubMed
    1. Brastianos PK, Galanis E, Butowski N, et al. Advances in multidisciplinary therapy for meningiomas. Neuro Oncol 2019;21:I18–I31. doi:10.1093/neuonc/noy136 - DOI - PMC - PubMed
    1. Goldbrunner R, Stavrinou P, Jenkinson MD, et al. EANO guideline on the diagnosis and management of meningiomas. Neuro Oncol 2021;23(11):1821–1834. doi:10.1093/neuonc/noab150 - DOI - PMC - PubMed
    1. Louis DN, Perry A, Reifenberger G, et al. The 2016 World Health Organization Classification of Tumors of the Central Nervous System: a summary. Acta Neuropathol 2016;131(6):803–820. doi:10.1007/s00401-016-1545-1 - DOI - PubMed

LinkOut - more resources