. 2023 Dec 22;10(12):ENEURO.0290-23.2023.
doi: 10.1523/ENEURO.0290-23.2023. Print 2023 Dec.

Developing a Toolbox of Antibodies Validated for Array Tomography-Based Imaging of Brain Synapses

Affiliations

Developing a Toolbox of Antibodies Validated for Array Tomography-Based Imaging of Brain Synapses

Kristina D Micheva et al. eNeuro. .

Abstract

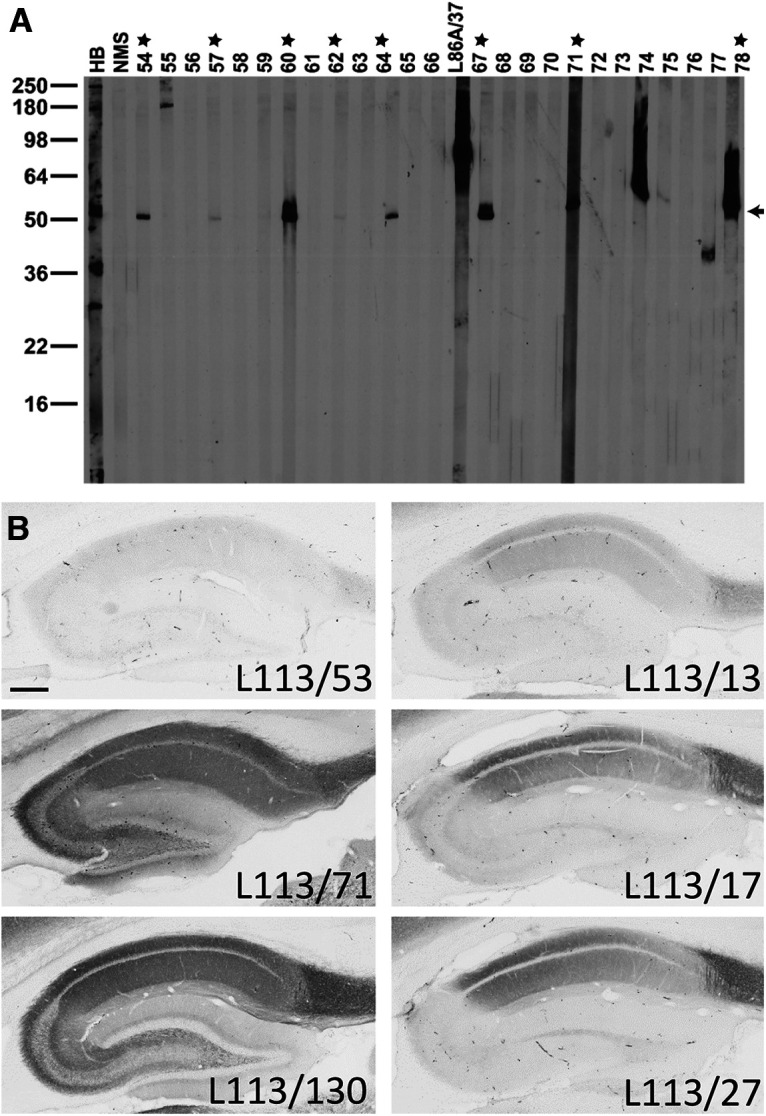
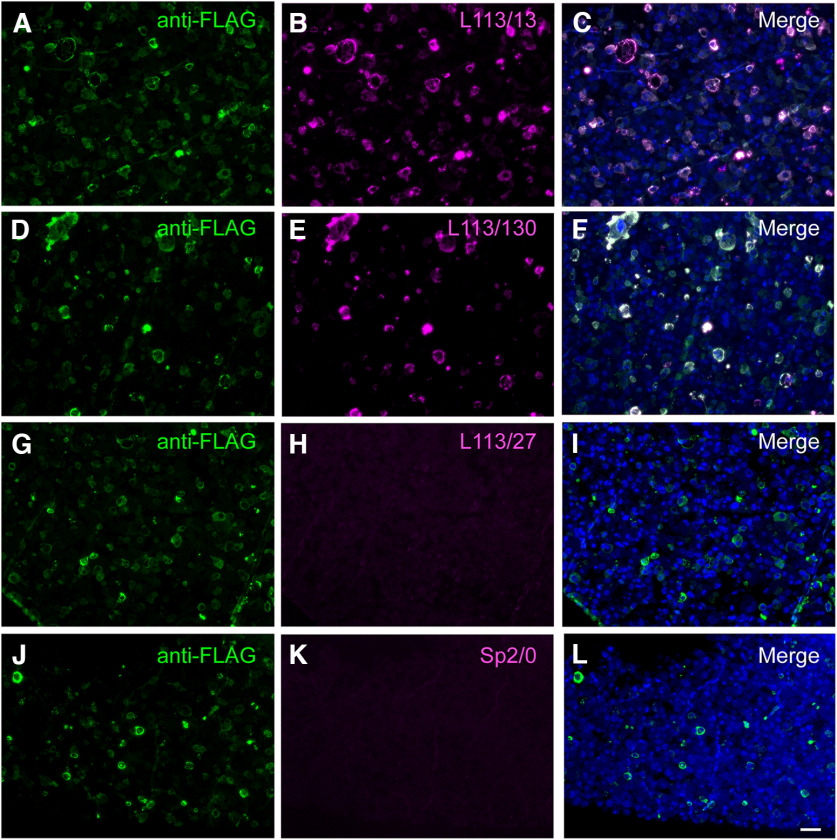
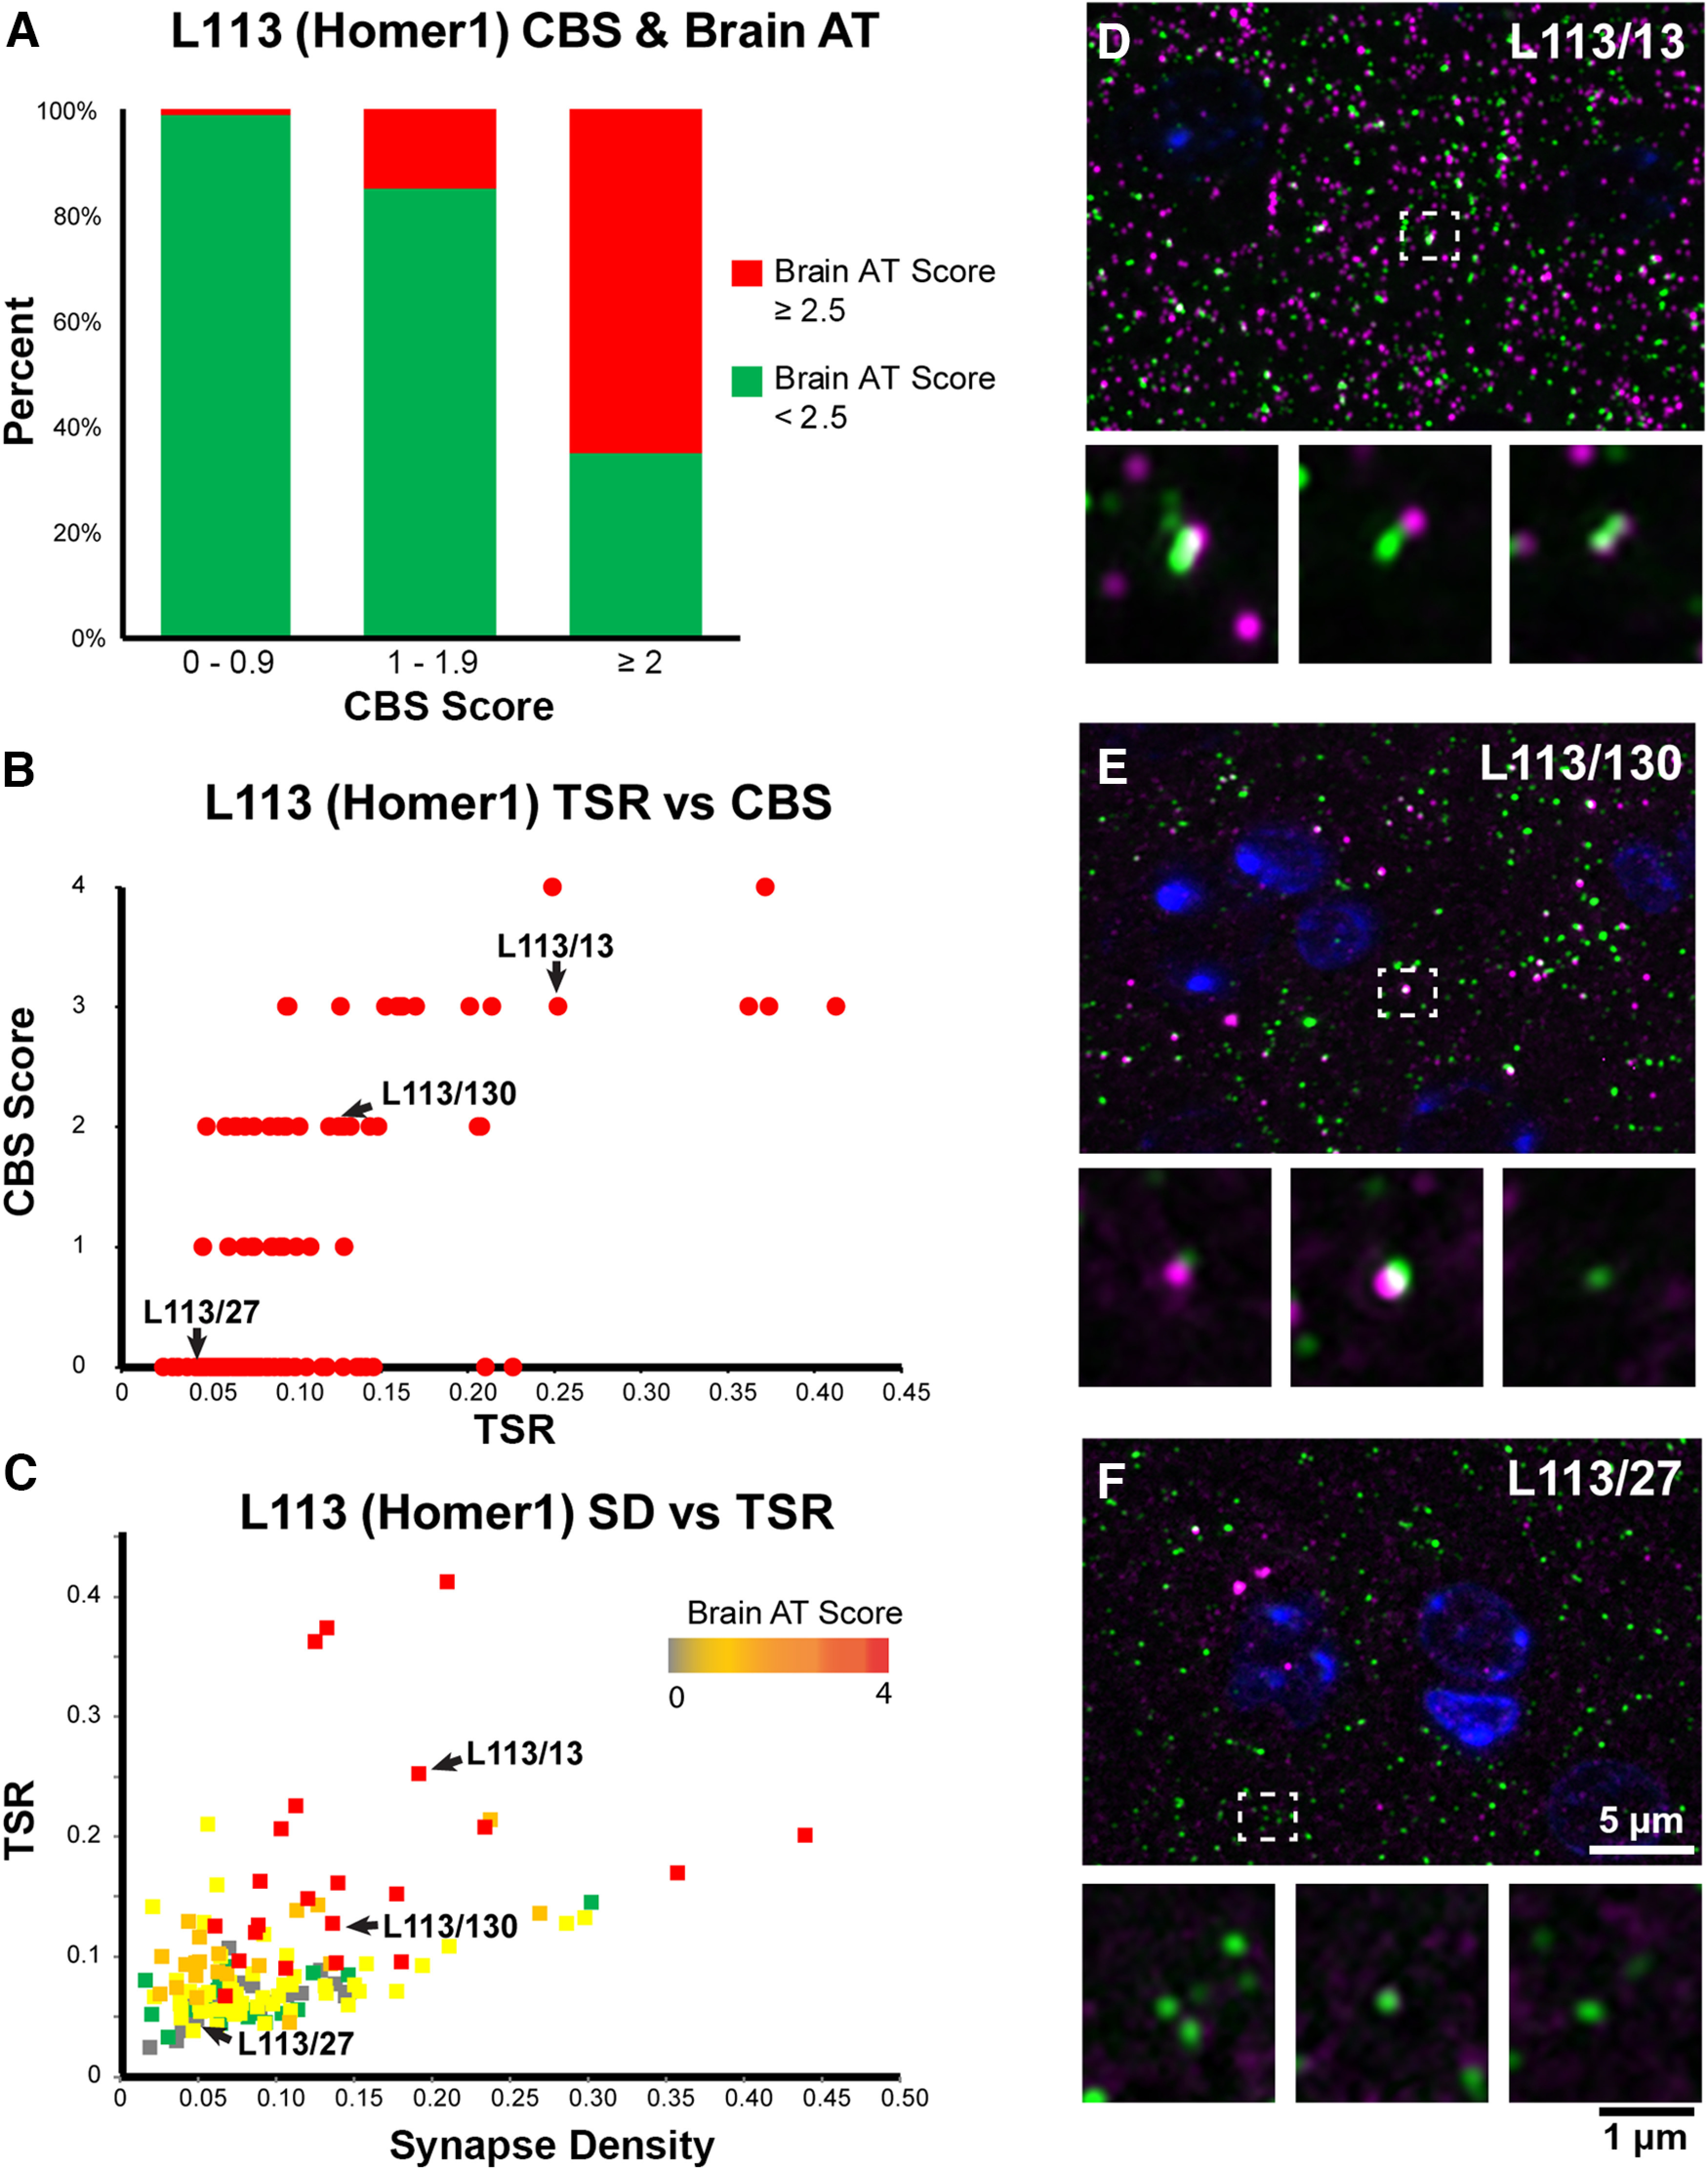
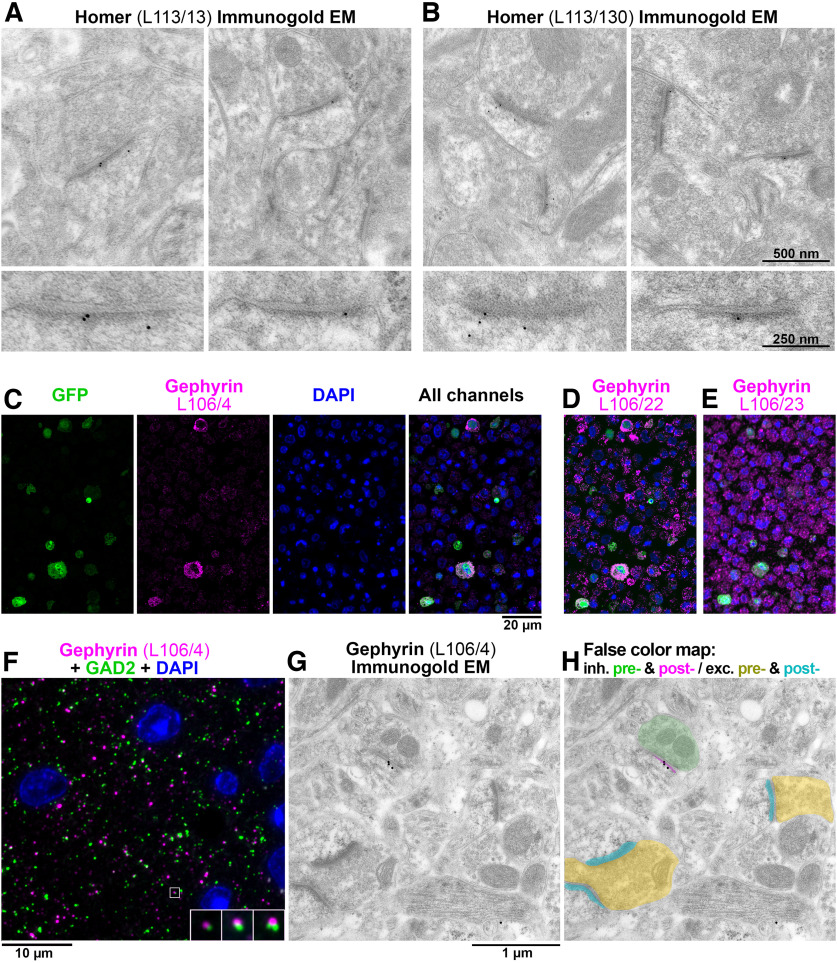
Antibody (Ab)-based imaging techniques rely on reagents whose performance may be application specific. Because commercial antibodies are validated for only a few purposes, users interested in other applications may have to perform extensive in-house antibody testing. Here, we present a novel application-specific proxy screening step to efficiently identify candidate antibodies for array tomography (AT), a serial section volume microscopy technique for high-dimensional quantitative analysis of the cellular proteome. To identify antibodies suitable for AT-based analysis of synapses in mammalian brain, we introduce a heterologous cell-based assay that simulates characteristic features of AT, such as chemical fixation and resin embedding that are likely to influence antibody binding. The assay was included into an initial screening strategy to generate monoclonal antibodies that can be used for AT. This approach simplifies the screening of candidate antibodies and has high predictive value for identifying antibodies suitable for AT analyses. In addition, we have created a comprehensive database of AT-validated antibodies with a neuroscience focus and show that these antibodies have a high likelihood of success for postembedding applications in general, including immunogold electron microscopy. The generation of a large and growing toolbox of AT-compatible antibodies will further enhance the value of this imaging technique.

Keywords: connectivity; electron microscopy; nanoscale; proteome; synaptome; ultrastructure.


Conflict of interest statement

K.D.Mi. and S.J.S. have founder’s equity interests in Aratome, LLC (Menlo Park, CA), an enterprise that produces array tomography materials and service, and are also listed as inventors on two United States patents regarding array tomography methods that have been issued to Stanford University (United States patents 7,767,414 and 9,008,378). All other authors declare no competing financial interests.

Figures

Figure 1.
Figure 1.
Initial AT evaluation strategy for identifying synaptic Abs validated in other applications. A, Common reference markers for presynaptic and postsynaptic locations and nuclei. B, Example evaluation of an Ab against GluA2 (Abcam ab206293), a glutamatergic receptor with a known postsynaptic localization at excitatory synapses. A single 70-nm section from adult mouse cortex, labeled with the GluA2 Ab (green) and synaptic markers PSD-95 (Cell Signaling 3450), synapsin (Synaptic Systems 106006), gephyrin (NeuroMab L106/93), GABA (Millipore AB175), and the nuclear label DAPI. The panel to the right is an enlarged view of the boxed area in the left panel. The GluA2 Ab was scored as excellent, based on its colocalization with PSD-95, adjacency to synapsin and minimal background label. See Extended Data Figures 1-1 and 1-2 for more details.
Figure 2.
Figure 2.
Application-specific performance of mAbs. A, Ultrathin sections from LR White-embedded mouse neocortex immunolabeled with anti-PSD-95 mAb K28/43 (green) and a reference anti-synapsin Ab (Cell Signaling #5297, magenta, top), or a reference anti-PSD-95 mAb (Cell Signaling #3450, magenta, bottom). Nuclei are labeled with DAPI (blue). To the right, examples of individual synapses are shown, with four serial sections through each. Synapses 1–3 are immunolabeled with K28/43 (green) and anti-synapsin Ab (magenta), and synapses 4–6 with K28/43 (green) and the reference anti-PSD-95 mAb (magenta). Syn., synapse. B, Immunolabeling of human neocortical samples from biopsy or autopsy with the same K28/43 mAb. While K28/43 performs well on human biopsy tissue (left), it shows very sparse labeling on autopsy tissue (middle). However, a different mAb from the same project, K28/77, gives a specific and robust signal on human autopsy tissue (right). Autofluorescent lipofuscin granules, which are much more abundant in the human tissue are seen in the green channel, within the neuronal cytoplasm surrounding the nuclei. C, Top, Mouse neocortex postfixed with osmium tetroxide and immunolabeled with an anti-PSD-95 mAb (green) and a reference anti-synapsin Ab (Cell Signaling #5297, magenta). K28/43 gives dense nonspecific label, but mAb K28/86 from the same project performs well in this preparation. C, Bottom, Immunogold electron microscopy of mouse neocortex with K28/91, two serial sections are shown. Excitatory synapses, recognized by their asymmetric synaptic junction (magenta asterisk), have associated immunogold particles, whereas inhibitory synapses (cyan asterisk, symmetric synaptic junction) do not.
Figure 3.
Figure 3.
Flow diagram of the mAb screening workflow. Flow charts illustrating steps for conventional (top) and AT-inclusive (bottom) mAb screens.
Figure 4.
Figure 4.
Conventional ELISA and COS-IF screening results for the L113 project targeting Homer1L. A, ELISA primary screen data for the project, with protein and cell ELISA data plotted on the x- and y-axes, respectively. 2944 hybridoma samples were screened by two ELISA assays, which also included positive (green) and negative (blue) control wells. The 144 candidates selected for further screening are in gray, and the red squares denote the wells with candidates (L113/13, L133/27, L113/130) that were ultimately selected as NeuroMab mAbs. B, Exemplar results of the secondary COS IF screen for the L113 project. Photomicrographs show fluorescent immunolabeling of COS-1 cells transiently transfected with Flag-tagged mouse Homer1L mammalian expression construct using a rabbit anti-Flag pAb (green; Sigma, catalog #F7425), candidate mouse mAbs (magenta) and Hoechst nuclear stain (blue). The first three rows show images from three positive candidates (L113/13, L113/27, L113/130 and) that were eventually selected as NeuroMabs, and the fourth row shows the negative control (Sp2/0 myeloma cell medium). Scale bar = 5 μm.
Figure 5.
Figure 5.
Conventional immunoblot and IHC screening results for Homer1. A, Representative immunoblot strips from the L113 screen. Values on left show the mobility of molecular weight standards in kDa. Each lane represents a replicate strip containing a crude rat brain membrane fraction probed with a different candidate or control Ab. Other lanes include antiserum from one of the immunized mice (HB), a mouse serum negative control, and a positive control NeuroMab mAb against a different target (L86A/37, AMIGO-1). Strips for candidates L113/54 to L113/78 are shown. Stars = positive candidates on strip blot. Arrow = expected electrophoretic mobility of Homer1L. B, Representative images from the L113 IHC screen. Photomicrographs show DAB/NAS immunolabeling of sagittal rat brain sections. Results from six candidate mAbs highlight a range of results from negative (L113/53) to partial (L113/17, L113/27, L113/13) to full (L113/71, L113/130) labeling, with the expected cellular and subcellular labeling pattern based on in situ hybridization and immunohistochemistry evidence gleaned from the literature and from publicly accessible in situ hybridization databases. Scale bar = 1 mm.
Figure 6.
Figure 6.
CBS assay identifies potential AT-compatible mAbs. Images of LR White embedded Homer1L-expressing transiently transfected COS-1 cells in semi-thin (400 nm) sections and labeled with candidate L113 mAbs. Only two of the three mAbs selected on the basis of their excellent performance in ELISA and conventional IHC screening were found to perform well on these AT proxy sections (L113/13; A–C) and L113/130 (D–F). mAb L113/27 does not selectively recognize the target expressing cells (G–I) and is similar in appearance to the negative control, conditioned medium from the Sp2/0 myeloma cell line (J–L). Scale bar = 50 μm.
Figure 7.
Figure 7.
CBS positive mAbs screened on brain tissue embedded for AT. A, Percent of candidate mAbs with high brain AT score among mAbs with different CBS scores. Candidate mAbs with low CBS scores (0–1 and 1–2) are very unlikely to have a high brain AT score, while the majority of candidate mAbs with high CBS scores also scored high on brain AT. B, Correlation between TSR scores which measure Ab specificity in AT brain labeling, and CBS scores. C, Target synapse density which measures the Ab sensitivity in AT brain labeling plotted against the TSR scores. D–F, Images of ultrathin sections from LR White-embedded mouse neocortex immunolabeled with the Homer1L mAbs (magenta) L113/13 (D), L113/130 (E; both CBS positive), and the CBS negative L113/27 (F), double labeled with a PSD95 Ab (green). Nuclei are labeled with DAPI (blue). The bottom of each panel includes examples of individual synapses with three serial sections through each of the AT samples. Similar to their performance in the CBS assay (Fig. 5), mAbs L113/13 and L113/130 show specific labeling on AT brain sections, while L113/27 does not detect the target protein.
Figure 8.
Figure 8.
Ab screening for immunogold electron microscopy. A, B, Immunogold EM with L113/13 (A) and L113/30 (B) mAbs on Lowicryl HM20-embedded tissue from mouse cortex. The immunogold label localizes at asymmetric postsynaptic densities. The bottom panels show a magnified and rotated view of a postsynaptic density from the top panel. C, AT CBS assay for gephyrin mAb L106/4 immunolabeling of a 400-nm section from COS-1 cells co-transfected with separate plasmids encoding gephyrin and EGFP and embedded in LR White. The gephyrin immunolabeling colocalizes at the cellular level with EGFP marker expression. Because in this case the COS-1 cells were co-transfected with two separate plasmids, the overlap is not complete and some GFP-positive cells do not label with L106/4. D, An adjacent 400-nm section immunolabeled with mAb L106/22. While this mAb recognizes the transfected cells, there is also a high level of nonspecific labeling and therefore it was rejected. E, mAb L106/23 does not label the transfected cells and was also rejected. F, AT immunofluorescence of an LR White-embedded 70-nm section from adult mouse cortex with L106/4 mAb against gephyrin (magenta), rabbit mAb GAD2 (Cell Signaling #5843, green) and DAPI (blue). The insert shows three consecutive sections through the synapse that is marked with a white box. G, Immunogold EM using the same L106/4 mAb on Lowicryl HM20-embedded tissue from mouse cortex. H, False color map of the section in G. The immunogold is associated with the postsynaptic side of the inhibitory synapse, but not excitatory synapses in the same field of view. See Extended Data Figures 8-1 and 8-2 for additional examples of Immunogold EM labeling.
Figure 9.
Figure 9.
The CBS assay has high predictive value for Ab success in AT experiments. A, Euler diagrams for projects L113 (Homer1), L109 (Calbindin), and L106 (Gephyrin). B, Table listing the percent of ELISA positive candidates giving rise to brain section AT positive mAbs (score ≥ 2.5) broken down by their performance on each validation assay. C, Ratio of the positive predictive value for AT suitable mAbs to the false omission rate shown for each validation assay. The CBS assay was most predictive for identifying brain AT positive mAbs. IF, immunofluorescence; IHC, immunohistochemistry; IB, immunoblot; AT, array tomography; CBS, cell-based proxy screen.

Update of

References

    1. Anderson JR, Jones BW, Watt CB, Shaw MV, Yang JH, Demill D, Lauritzen JS, Lin Y, Rapp KD, Mastronarde D, Koshevoy P, Grimm B, Tasdizen T, Whitaker R, Marc RE (2011) Exploring the retinal connectome. Mol Vis 17:355–379. - PMC - PubMed
    1. Bae JA, et al. (2021) Functional connectomics spanning multiple areas of mouse visual cortex. bioRxiv 454025. 10.1101/2021.07.28.454025. - DOI
    1. Baker M (2015a) Antibody anarchy: a call to order. Nature 527:545–551. 10.1038/527545a - DOI - PubMed
    1. Baker M (2015b) Reproducibility crisis: blame it on the antibodies. Nature 521:274–276. 10.1038/521274a - DOI - PubMed
    1. Begley CG, Ellis LM (2012) Drug development: raise standards for preclinical cancer research. Nature 483:531–533. 10.1038/483531a - DOI - PubMed

Publication types

Substances