. 2023 Nov 9;14(1):7266.
doi: 10.1038/s41467-023-42528-4.

trRosettaRNA: automated prediction of RNA 3D structure with transformer network

Affiliations

trRosettaRNA: automated prediction of RNA 3D structure with transformer network

Wenkai Wang et al. Nat Commun. .

Abstract

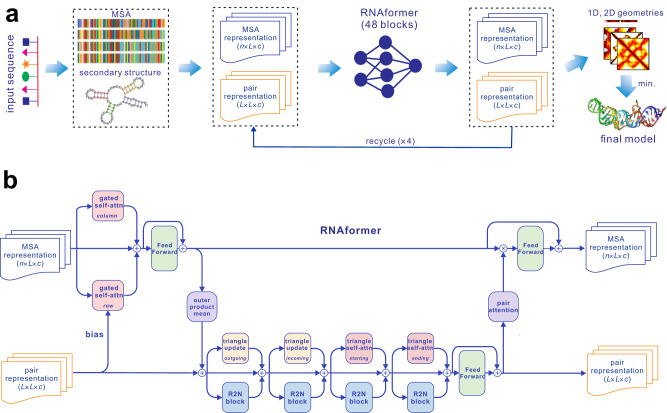
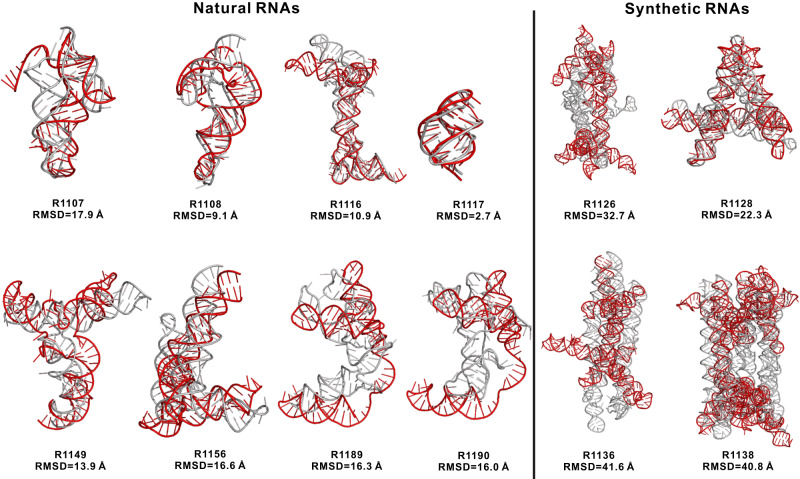
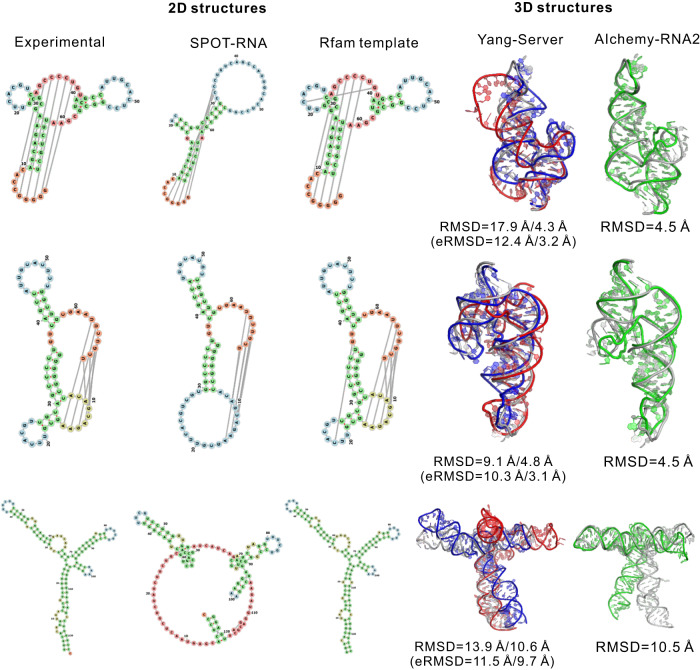
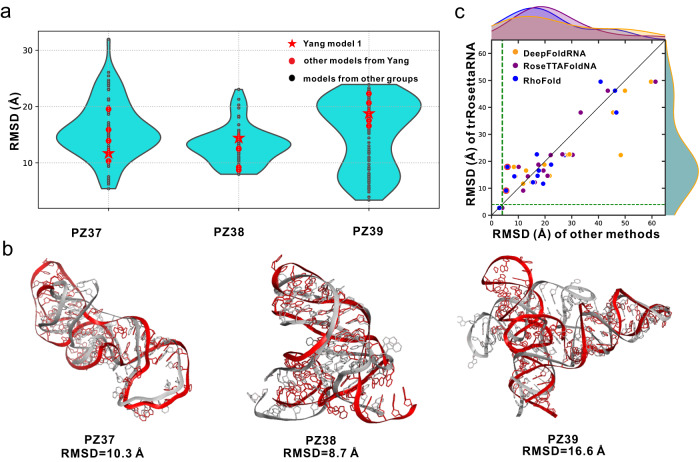
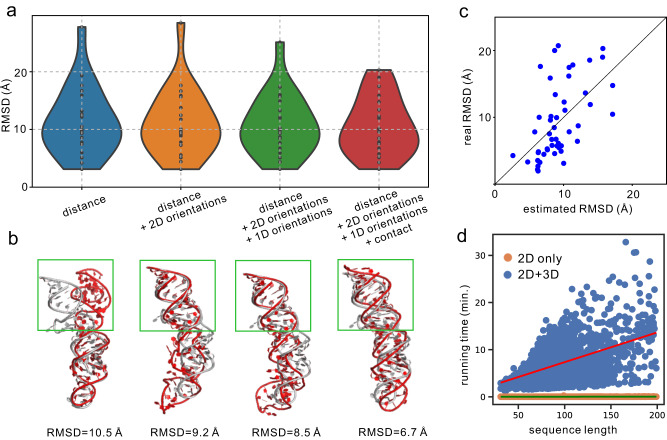
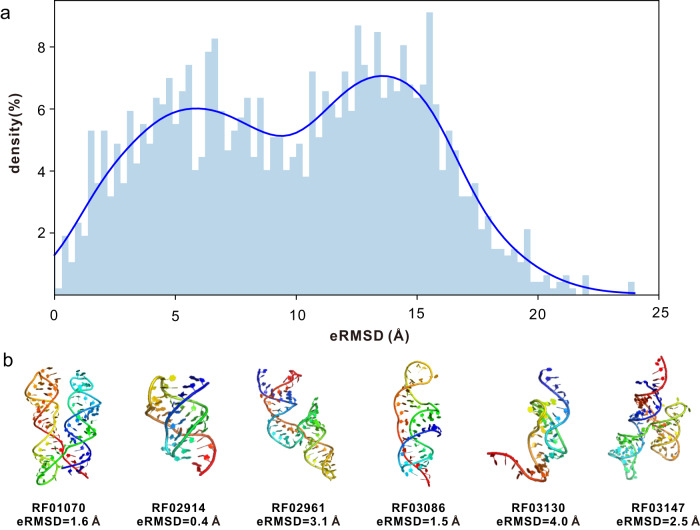
RNA 3D structure prediction is a long-standing challenge. Inspired by the recent breakthrough in protein structure prediction, we developed trRosettaRNA, an automated deep learning-based approach to RNA 3D structure prediction. The trRosettaRNA pipeline comprises two major steps: 1D and 2D geometries prediction by a transformer network; and 3D structure folding by energy minimization. Benchmark tests suggest that trRosettaRNA outperforms traditional automated methods. In the blind tests of the 15th Critical Assessment of Structure Prediction (CASP15) and the RNA-Puzzles experiments, the automated trRosettaRNA predictions for the natural RNAs are competitive with the top human predictions. trRosettaRNA also outperforms other deep learning-based methods in CASP15 when measured by the Z-score of the Root-Mean-Square Deviation. Nevertheless, it remains challenging to predict accurate structures for synthetic RNAs with an automated approach. We hope this work could be a good start toward solving the hard problem of RNA structure prediction with deep learning.


Conflict of interest statement

The authors declare no competing interests.

Figures

Fig. 1
Fig. 1. Overall architecture of trRosettaRNA.
a flowchart of trRosettaRNA. b structure of each RNAformer block. n, L, and c are the number of sequences in the MSA, the length of the query sequence, and the number of channels, respectively.
Fig. 2
Fig. 2. Yang-Server models (red) versus experimental structures (gray) for 12 CASP15 targets.
Consistent with Table 2, the best-submitted models are shown here. The 3D structures are presented using PyMOL.
Fig. 3
Fig. 3. Results for three targets from CASP15 for which the template secondary structures can be found in the Rfam database.
The RNA secondary structure visualization was employed with forna. The template search and 2D structure modelling were employed with R2DT program. For the 3D modelling results, we present the best model submitted by Yang-Server (in red), the trRosettaRNA model based on 2D templates (in blue) and the AIchemy_RNA2 best model (in green). Both predicted 3D structures are superimposed onto the experimental structures (gray). For Yang-Server models, the RMSD and eRMSD values are shown in SPOT-RNA-based/R2DT-based format.
Fig. 4
Fig. 4. Blind test results and comparison with other deep learning-based methods.
a, b blind test results on the latest three targets from RNA-Puzzles. a RMSD comparison of the models submitted by Yang group and models from other groups. b the best models submitted by Yang group (red) superposed to the experimental structures (gray). c head-to-head RMSD comparison between trRosettaRNA and other deep learning-based methods (n = 15 RNAs from the blind tests of CASP15 and RNA-Puzzles). The dashed horizontal and vertical lines correspond to an RMSD of 4 Å. The bar plots show the RMSD distributions. The red circles highlight the two cases (R1107 and R1108) in which trRosettaRNA can achieve better results with improved secondary structures. Source data are provided as a Source Data file.
Fig. 5
Fig. 5. Summary of the folding results by different restraints.
a contribution of the various restraints to the trRosettaRNA modeling accuracy in terms of the RMSD for the 20 RNA-Puzzles targets (n = 20 RNAs). b an example (PZ11) to illustrate the impact of different restraints. The predicted models (red cartoon) are superposed to the experimental structures (gray cartoon). The green square highlights the helix region which is influenced by the introduction of more restraints. c head-to-head comparison between the estimated and real RMSD for all RNAs in the benchmark datasets (n = 50 RNAs). d the relationship between the running time and the sequence length on 1752 Rfam families. The 2D geometry predictions (orange dots) were run on one GPU card. The 3D structure folding was performed on one CPU core. Source data are provided as a Source Data file.
Fig. 6
Fig. 6. Application of trRosettaRNA to Rfam families with unknown structures.
a eRMSD (i.e., estimated RMSD) distributions of the predicted structure models (n = 1752 Rfam families). b six selected example families with eRMSD <4 Å. Source data are provided as a Source Data file.

References

    1. Zhang J, Fei Y, Sun L, Zhang QC. Advances and opportunities in RNA structure experimental determination and computational modeling. Nat. Methods. 2022;19:1193–1207. doi: 10.1038/s41592-022-01623-y. - DOI - PubMed
    1. Berman HM, et al. The Protein Data Bank. Nucleic acids Res. 2000;28:235–242. doi: 10.1093/nar/28.1.235. - DOI - PMC - PubMed
    1. Rother M, Rother K, Puton T, Bujnicki JM. ModeRNA: a tool for comparative modeling of RNA 3D structure. Nucleic Acids Res. 2011;39:4007–4022. doi: 10.1093/nar/gkq1320. - DOI - PMC - PubMed
    1. Flores, S. C., Wan, Y., Russell, R. & Altman, R. B. Predicting RNA structure by multiple template homology modeling. Pac Symp Biocomput. 2010, 216-227 (2009). - PMC - PubMed
    1. Das R, Baker D. Automated de novo prediction of native-like RNA tertiary structures. Proc. Natl Acad. Sci. USA. 2007;104:14664–14669. doi: 10.1073/pnas.0703836104. - DOI - PMC - PubMed

Publication types