. 2023 Nov 9;14(1):7238.
doi: 10.1038/s41467-023-42834-x.

NULISA: a proteomic liquid biopsy platform with attomolar sensitivity and high multiplexing

Affiliations

NULISA: a proteomic liquid biopsy platform with attomolar sensitivity and high multiplexing

Wei Feng et al. Nat Commun. .

Abstract

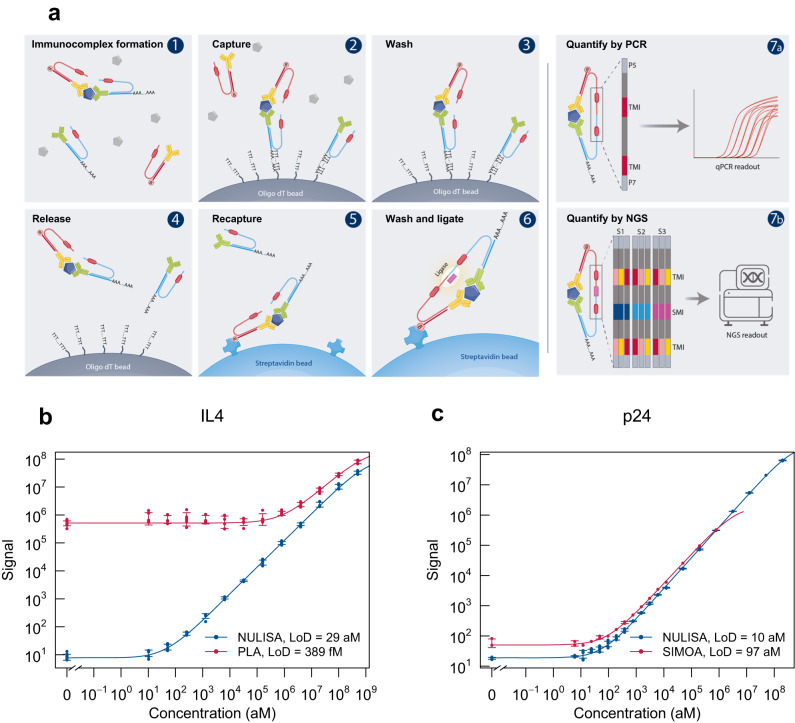
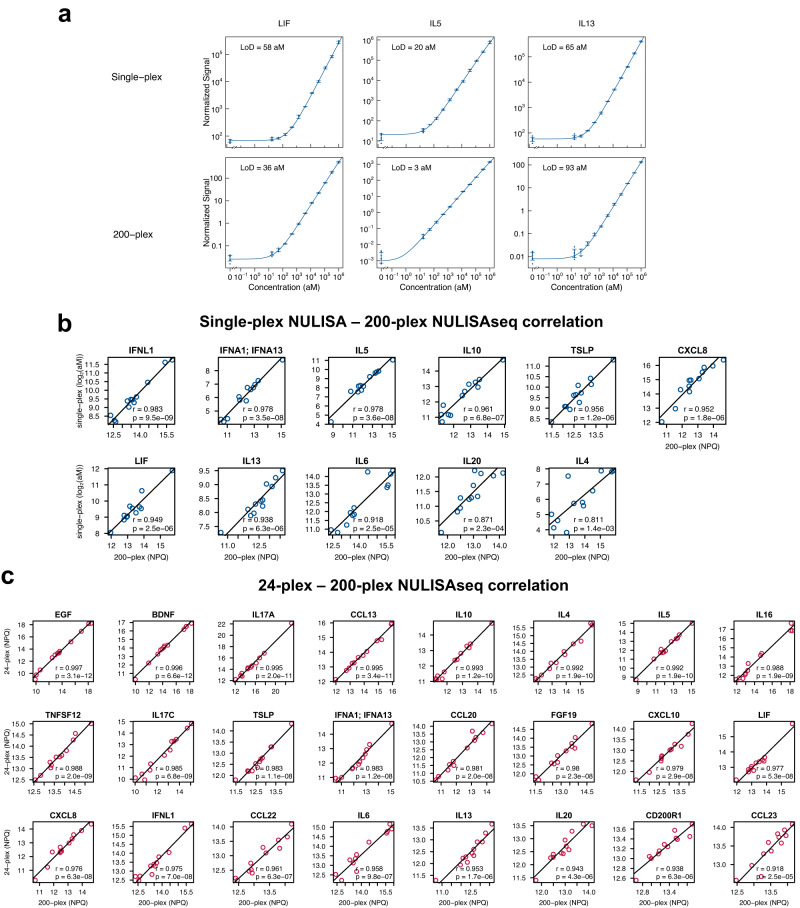
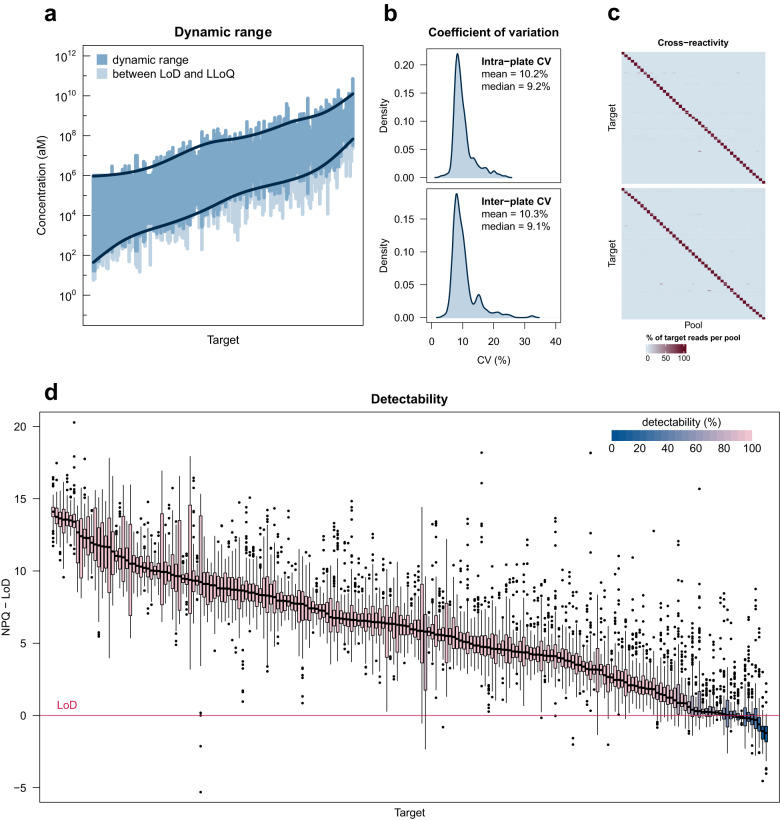
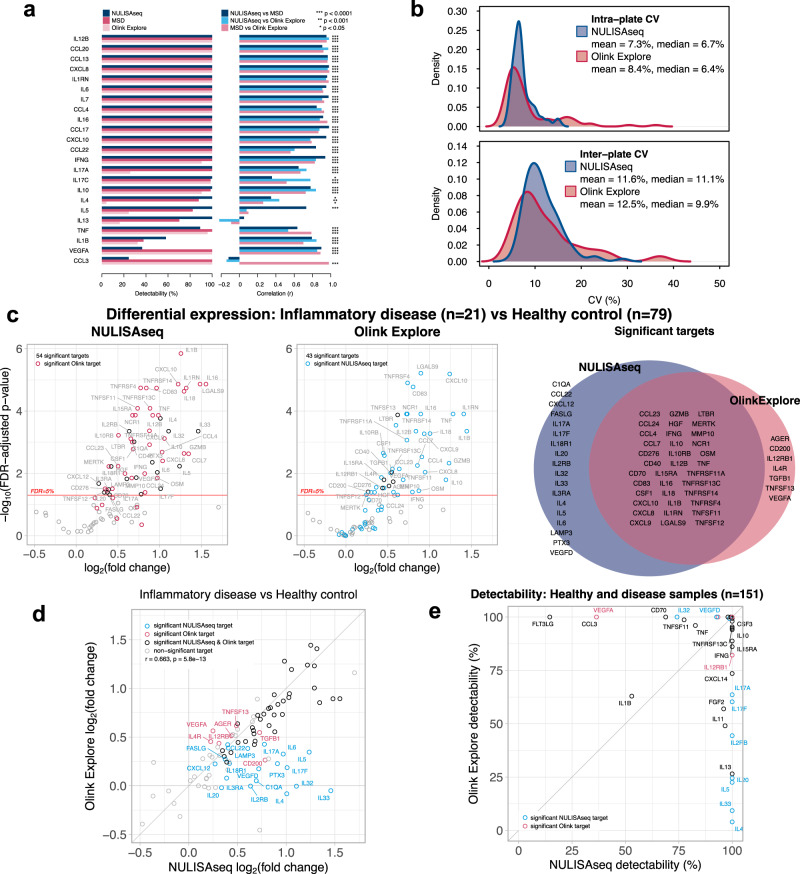
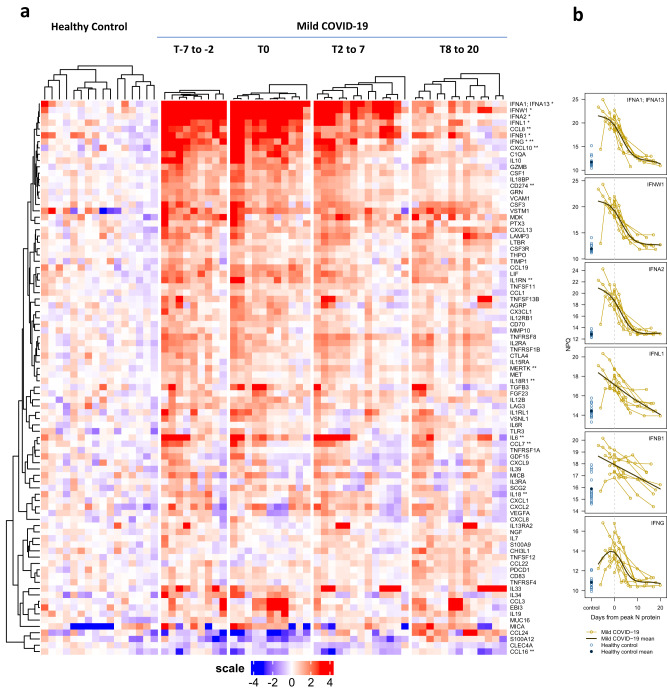
The blood proteome holds great promise for precision medicine but poses substantial challenges due to the low abundance of most plasma proteins and the vast dynamic range of the plasma proteome. Here we address these challenges with NUcleic acid Linked Immuno-Sandwich Assay (NULISA™), which improves the sensitivity of traditional proximity ligation assays by ~10,000-fold to attomolar level, by suppressing assay background via a dual capture and release mechanism built into oligonucleotide-conjugated antibodies. Highly multiplexed quantification of both low- and high-abundance proteins spanning a wide dynamic range is achieved by attenuating signals from abundant targets with unconjugated antibodies and next-generation sequencing of barcoded reporter DNA. A 200-plex NULISA containing 124 cytokines and chemokines and other proteins demonstrates superior sensitivity to a proximity extension assay in detecting biologically important low-abundance biomarkers in patients with autoimmune diseases and COVID-19. Fully automated NULISA makes broad and in-depth proteomic analysis easily accessible for research and diagnostic applications.


Conflict of interest statement

W.F., J.B., Q.H., I.S.A., A.S., A.K., K.C., M.M., X.Q., X.X., S.I., T.Y., R.N., L.W., M.Y., K.E., L.Z., W.X., C.L., C.H.P., C.P., K.Z., A.G., J.H., K.S., D.K., L.F., B.Z., S.C., Y.Y., Y.L., and X.M. are employees and stockholders of Alamar Biosciences. Y.L., W.F., A.G., Y.Y., and S.C. have submitted a patent application to US Patent and Trademark Office pertaining to the methods and compositions of NULISA technology (provisional application No. 62/943,135). The other authors do not claim competing interest.

Figures

Fig. 1
Fig. 1. NULISA design and proof of concept.
a Schematic of the NULISA workflow. (1) Immunocomplex formation; (2) first capture of immunocomplexes to dT beads; (3) bead washing to remove unbound antibodies and sample matrix components; (4) release of immunocomplexes into solution; (5) recapture of immunocomplexes onto streptavidin beads; (6) bead washing and DNA strand ligation to generate reporter DNA; (7a) detection and quantification of reporter DNA levels by qPCR; (7b) quantification of reporter DNA levels by NGS. b Standard curves for IL4 detection generated following the traditional PLA (red line) or NULISA (blue line) protocols using the same set of reagents. The serial dilution of the standard spanned from 200 pM to 10 aM. Error bars represent mean +/− one standard deviation (n = 6). c Sensitivity and dynamic range comparison between NULISA (blue line) and SIMOA (red line) using the same pair of antibodies to detect HIV p24. Error bars represent mean +/− one standard deviation (n = 3). Source data are provided as a Source data file.
Fig. 2
Fig. 2. NULISAseq sensitivity and correlation across multiplex levels.
a Comparison of the sensitivity of 200-plex and single-plex assays for LIF, IL5, and IL13 detection. Error bars represent mean +/− one standard deviation (n = 3). b Pearson correlation of protein levels measured using 200-plex and single-plex assays with 12 individual healthy donor plasma samples. The 200-plex data were normalized using internal and inter-plate controls and then log2-transformed to yield NULISA Protein Quantification (NPQ) units. Single-plex data in absolute concentration (aM) were also log2-transformed. Least-squares regression lines are shown on the plots. Two-sided tests were carried out to assess whether correlation coefficients significantly differ from zero; unadjusted p-values are shown. c Pearson correlation of protein levels measured using 200-plex and 24-plex NULISA methods with the same 12 plasma samples. Data were normalized using internal and inter-plate controls and then log2-transformed to yield NULISA Protein Quantification (NPQ) units. Least-squares regression lines are shown on the plots. Two-sided tests were carried out to assess whether correlation coefficients significantly differ from zero; unadjusted p-values are shown. The same antibody concentrations were used in all the assays. Source data are provided as a Source data file.
Fig. 3
Fig. 3. NULISAseq performance characterization.
a The dynamic range for the detection of each target is indicated by the dark blue region. Values above the limit of detection (LoD) but below the lower limit of quantitation (LLoQ) are shown in lighter blue. Targets are ordered according to the geometric mean of the LLoQ and upper limit of quantitation (ULoQ). Dark blue lines represent generalized additive model (GAM) cubic regression spline fits to the ULoQ and LLoQ. The overall dynamic range for 200-plex NULISAseq spanned 9.6 log10 values. b Density plots of intraplate CV after internal control normalization and interplate CV after internal control and intensity normalization. CV for each target was calculated using the mean CV across 10 samples with 9 technical replicates each. c Cross reactivity. Two sets of 45 random antigen pools containing 4–5 targets each were analyzed with 200-plex NULISAseq. Each cell of the heatmap represents the percent of normalized read counts for that target (rows) occurring in that pool (columns) (each row adds up to 100); scale ranges from zero (light blue) to 100 (dark red). Targets were ordered according to pool membership such that the cells on the diagonal corresponded to the assigned pools. d Detectability of 204 targets in 151 samples, including 79 from healthy controls and 72 from patients with various diseases. The y-axis represents NULISA Protein Quantification (NPQ) units minus the LoD for the respective target. Boxplots show lines at median; boxes indicate interquartile range; whiskers show values extending from interquartile range to up to 1.5 times the interquartile range; data beyond this are shown as plotted points. Boxplots are shaded using a gradient scale corresponding to detectability, where light pink represents 100% detectability and dark blue represents 0% detectability. Source data are provided as a Source data file. Source data for (a, b) are in Supplementary Data 1. Source data for (d) are provided in the Alamar_NULISAseq_Detectability_NPQ.csv file available under accession GSM7734324.
Fig. 4
Fig. 4. Comparison of NULISAseq with other assay platforms.
a Detectability and inter-platform correlation for 23 shared targets in the NULISAseq 200-plex, Olink Explore 384 Inflammation Panel, and MSD V-PLEX Human Cytokine 44-Plex assays. Two-sided tests were carried out to assess whether correlation coefficients significantly differ from zero; unadjusted p-values are shown. Exact p-values are listed in Source data file figure_4a_summary_data.csv. b Intra- and interplate CV distributions for the 92 common targets in the NULISAseq 200-plex (shown in blue) and Olink Explore 384-plex (shown in red). CV for each target was calculated as the mean CV for two independent pooled plasma samples with four technical replicates each. c Volcano plots of -log10(FDR-adjusted p-value) versus log2(fold change) levels comparing protein abundances in samples from patients with inflammatory diseases (n = 21) and healthy controls (n = 79) with NULISAseq and Olink Explore. Black open circles represent targets that were uniquely significant for the specified panel; targets that were significant in the other panel are shown as red (significant Olink target) or blue (significant NULISAseq target) open circles. The Venn diagram shows the overlap of significant targets. Two-sided significance tests were carried out to assess whether log2(fold change) differed from zero for each target; p-values were adjusted using a false discovery rate correction. d Correlation of estimated log2-fold changes between NULISAseq and Olink Explore. Targets are highlighted in blue (detected by NULISAseq only), red (detected by Olink only), black (detected by both panels), or gray (not significant for either panel). A two-sided test was carried out to assess whether the Pearson correlation coefficient significantly differs from zero. e Comparison of detectability between NULISAseq and Olink Explore, assessed using the same 79 healthy control samples and 72 samples from patients with inflammatory and other diseases. Targets are highlighted in blue (detected by NULISAseq only) or red (detected by Olink only); other targets are in black. Source data are provided as a Source data file. Source data for (be) are in Supplementary Data 2.
Fig. 5
Fig. 5. Heatmap of differential protein abundance between SARS-CoV-2-infected patients and healthy controls at different time points.
T0 (n = 9) represents time of peak expression of SARS-CoV-2 nucleocapsid protein (N-protein); T-7 to -2 (n = 11) represents 2–7 days before T0, T2 to 7 represents 2–7 days after T0 (n = 13), and T8 to 20 represents 8–20 days after T0 (n = 13). Mixed effect linear model analysis was performed for each time point comparing COVID-19 samples to healthy controls (n = 16). a A total of 88 differential abundance proteins were identified and visualized in a clustered heatmap. The heatmap displays the log2-normalized read counts (NULISA Protein Quantification, NPQ) centered relative to the mean in the healthy control samples; values above the mean are shown in red and values below the mean are shown in blue. Target names provided in the text are marked with asterisks: * indicates interferons, and ** indicates targets previously reported to be associated with COVID-19. b Individual trajectories of interferon abundance (NPQ) relative to days from peak N-protein are shown for the mild COVID group (gold lines). Trajectories are aligned based on the day of peak N-protein (dashed gray vertical line). Generalized additive models with a cubic regression spline basis were used to estimate the mean mild COVID-19 trajectory (dark brown line). Control samples (lighter blue open circles) and control group mean (dark blue solid circle) are shown to the left. Source data are provided in the Alamar_NULISAseq_COVID_NPQ.csv file available under accession GSM7734324.

Update of

References

    1. Nikanjam M, Kato S, Kurzrock R. Liquid biopsy: current technology and clinical applications. J. Hematol. Oncol. 2022;15:131. doi: 10.1186/s13045-022-01351-y. - DOI - PMC - PubMed
    1. Cescon DW, Bratman SV, Chan SM, Siu LL. Circulating tumor DNA and liquid biopsy in oncology. Nat. Cancer. 2020;1:276–290. doi: 10.1038/s43018-020-0043-5. - DOI - PubMed
    1. Anderson NL, Anderson NG. The human plasma proteome: history, character, and diagnostic prospects. Mol. Cell. Proteom. 2002;1:845–867. doi: 10.1074/mcp.R200007-MCP200. - DOI - PubMed
    1. Uhlén M, et al. The human secretome. Sci. Signal. 2019;12:eaaz0274. doi: 10.1126/scisignal.aaz0274. - DOI - PubMed
    1. Williams SA, et al. Plasma protein patterns as comprehensive indicators of health. Nat. Med. 2019;25:1851–1857. doi: 10.1038/s41591-019-0665-2. - DOI - PMC - PubMed

Publication types