. 2023 Nov 9;14(1):7249.
doi: 10.1038/s41467-023-43167-5.

Gut butyrate-producers confer post-infarction cardiac protection

Affiliations

Gut butyrate-producers confer post-infarction cardiac protection

Hung-Chih Chen et al. Nat Commun. .

Abstract

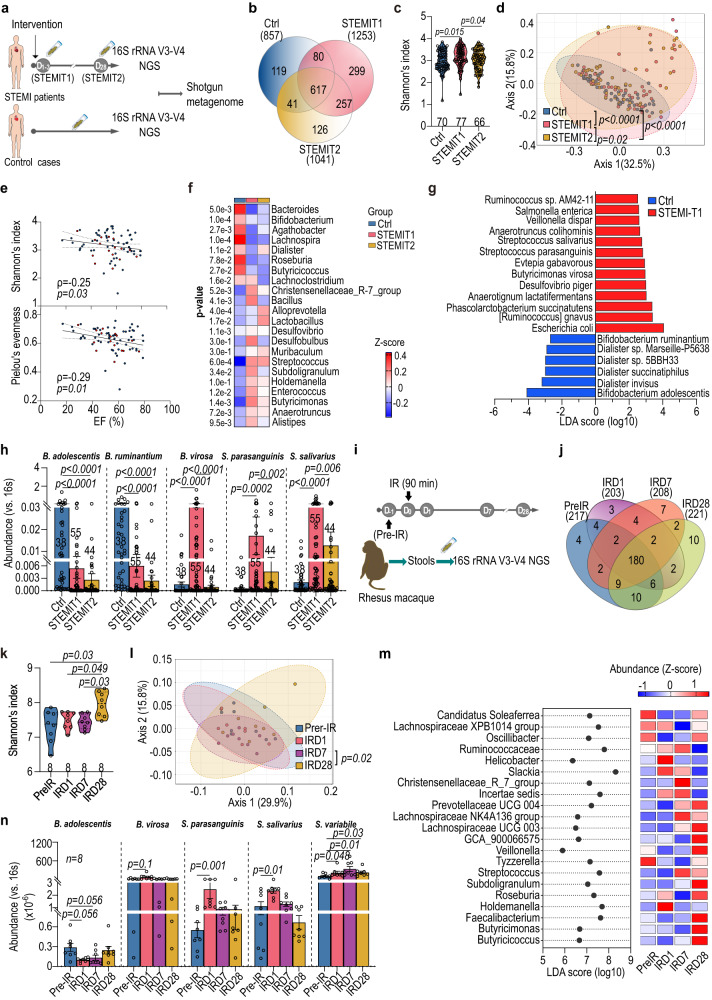
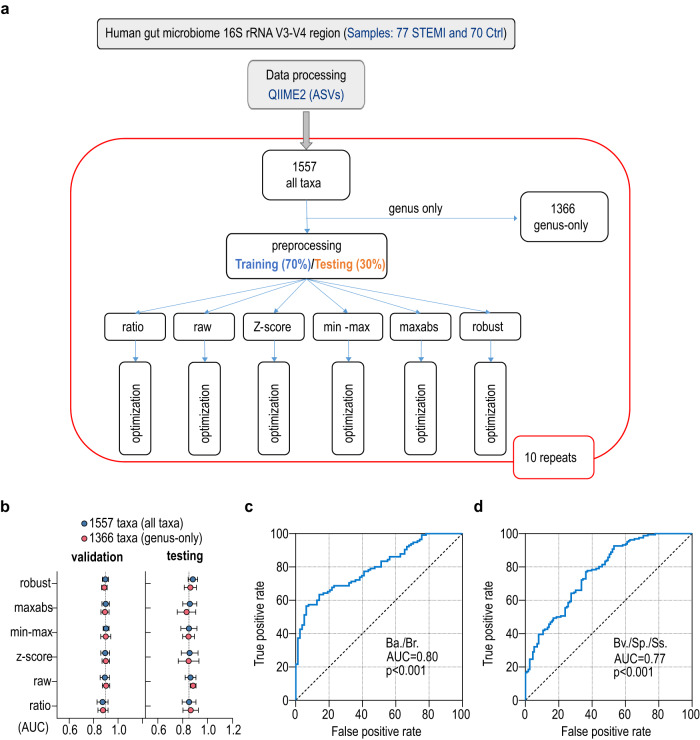
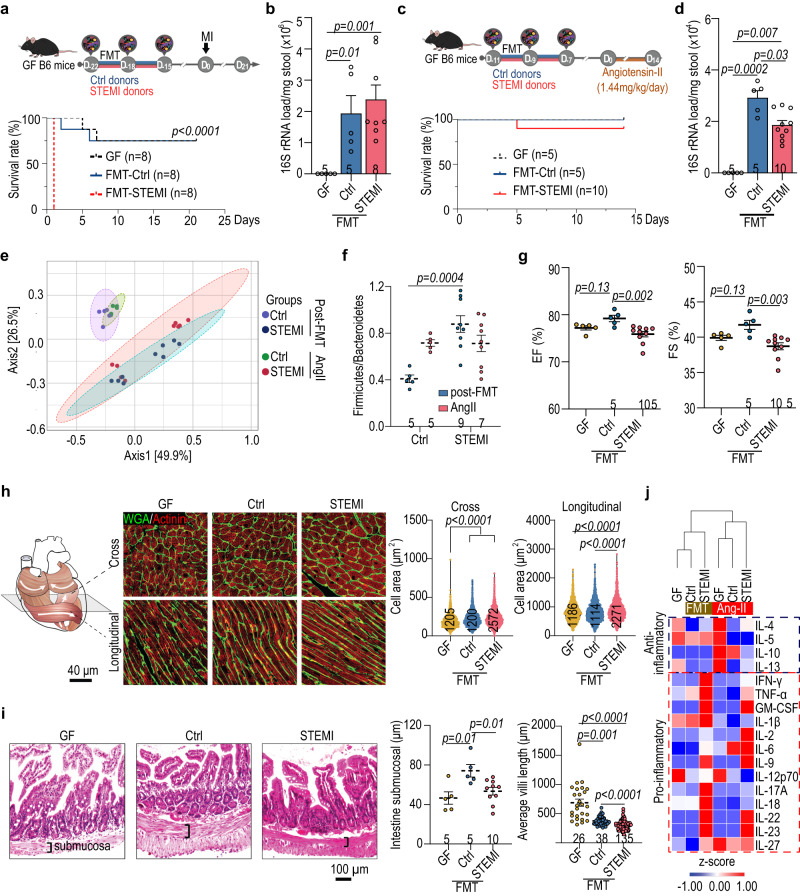
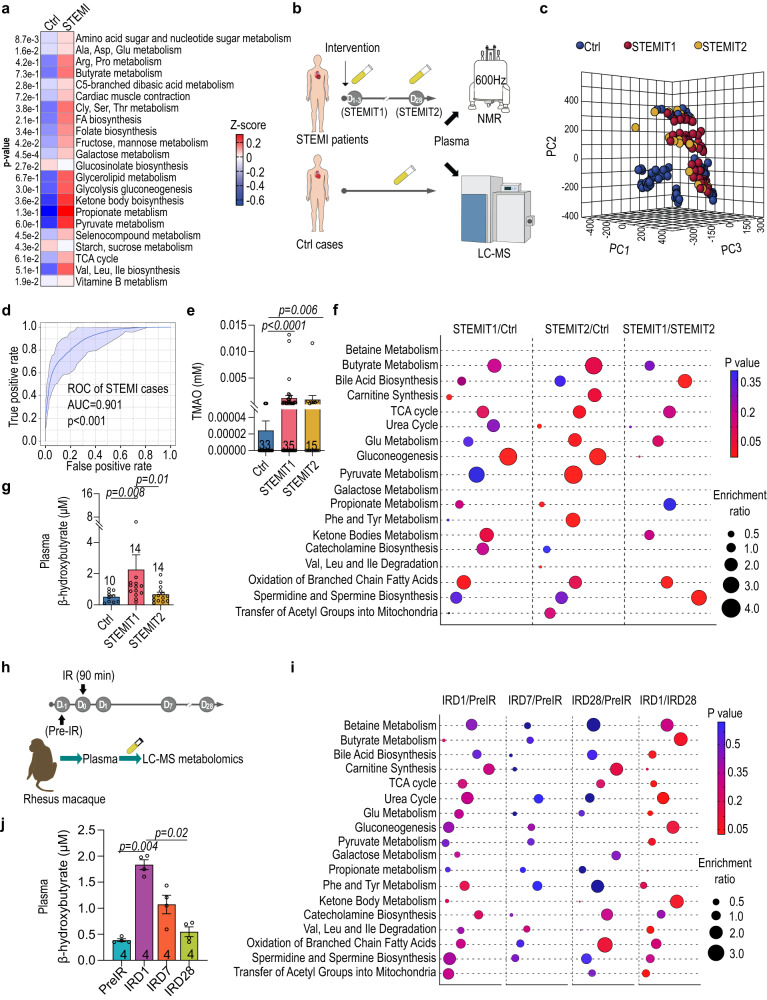
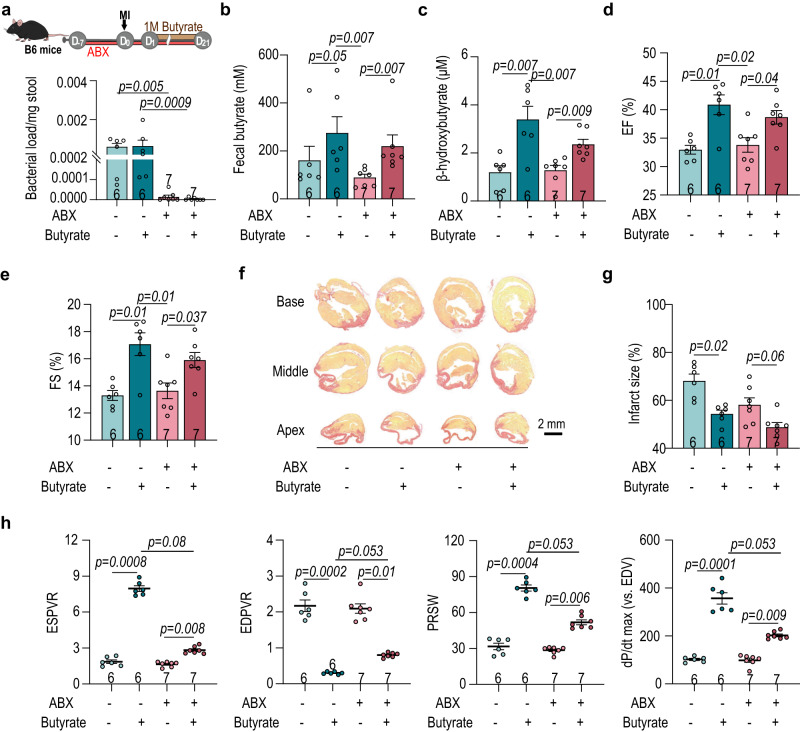
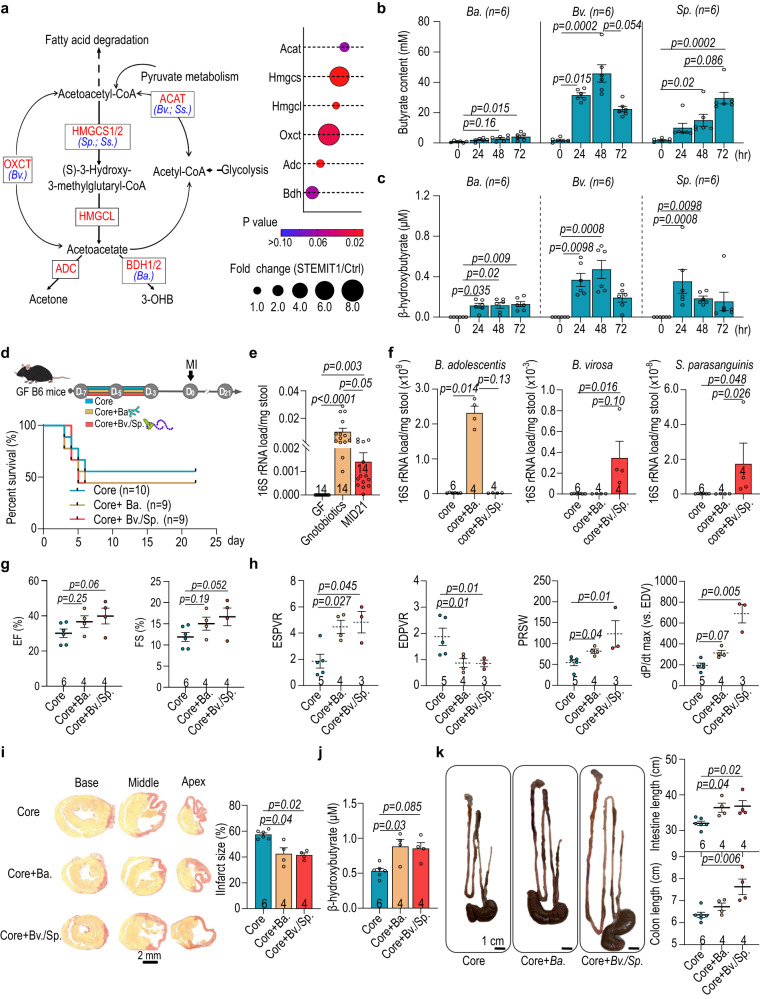
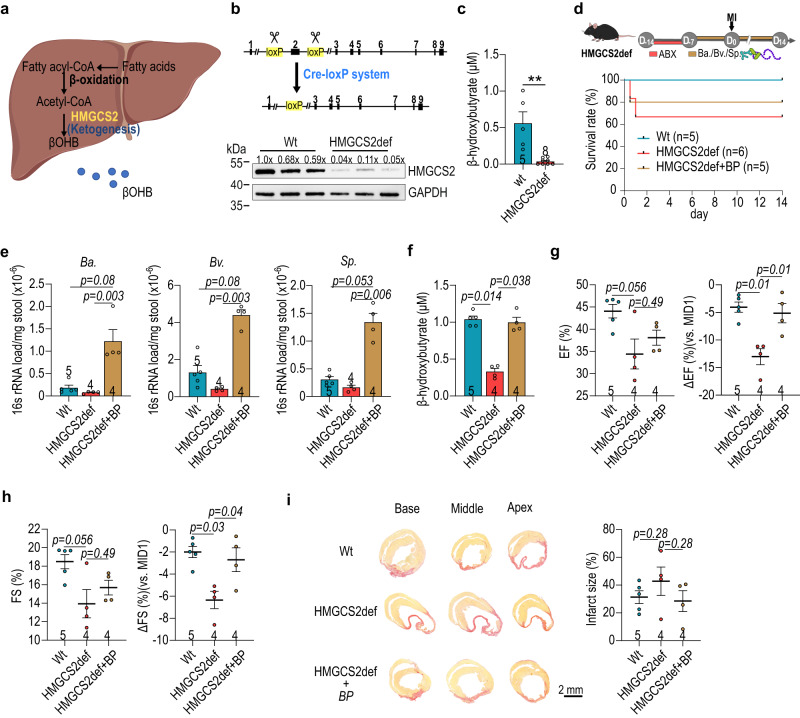
The gut microbiome and its metabolites are increasingly implicated in several cardiovascular diseases, but their role in human myocardial infarction (MI) injury responses have yet to be established. To address this, we examined stool samples from 77 ST-elevation MI (STEMI) patients using 16 S V3-V4 next-generation sequencing, metagenomics and machine learning. Our analysis identified an enriched population of butyrate-producing bacteria. These findings were then validated using a controlled ischemia/reperfusion model using eight nonhuman primates. To elucidate mechanisms, we inoculated gnotobiotic mice with these bacteria and found that they can produce beta-hydroxybutyrate, supporting cardiac function post-MI. This was further confirmed using HMGCS2-deficient mice which lack endogenous ketogenesis and have poor outcomes after MI. Inoculation increased plasma ketone levels and provided significant improvements in cardiac function post-MI. Together, this demonstrates a previously unknown role of gut butyrate-producers in the post-MI response.


Conflict of interest statement

The authors declare no competing interests.

Figures

Fig. 1
Fig. 1. Enrichment of butyrate-producing gut microbiome after cardiac injury.
a Stools from ST-elevation myocardial infarction (STEMI) patients were collected right after percutaneous intervention (PCI) (STEMIT1) and on D28 after PCI (STEMIT2). The controls (Ctrl) and STEMI stools were subjected to bf 16S rRNA V3-V4 NGS and g-h metagenome shotgun. b Venn diagram showing overlapping amplicon sequence variants (ASVs) of Ctrl, STEMIT1 and STEMIT2. c Shannon’s index of Ctrl and STEMI gut microbiota (vs. STEMIT1). d Principal co-ordinates analysis (PCoA) of weighted Unifrac of Ctrl and STEMI gut microbiota (vs. STEMIT1). e Spearman correlation of cardiac ejection fraction (EF, %) with Shannon’s index (upper) and Pielou’s evenness (lower). Blue for non-diabetic; red for diabetic. f Differentially abundant genera in Ctrl and STEMI samples. g Linear discriminant analysis (LDA) scores computed with distinct species in Ctrl and STEMIT1 via metagenomic analysis of 5 Ctrl and 11 STEMIT1 samples. h qPCR confirmation of Bifidobacterium adolescentis (B. adolescentis), Bifidobacterium ruminantium (B. ruminantium), Butyricimonas virosa (B. virosa), Streptococcus parasanguinis (S. parasanguinis) and Streptooccus salivarius (S. salivarius) abundance (vs. Ctrl for B. adolescentis, B. ruminantium; vs. STEMIT1 for B. virosa, S. parasanguinis, S. salivarius). i Nonhuman primates (NHPs) were subjected to cardiac ischemic/reperfusion (IR) injury. The stools at pre-IR, IRD1, IRD7 and IRD28 were subjected to 16S rRNA V3-V4 NGS. j Venn diagram showing overlapping ASVs in NHP stools at IR, IRD1, IRD7 and IRD28. k Shannon’s index of NHP gut microbiota in response to IR (vs. IRD28). l PCoA of weighted Unifrac of NHP gut microbiota (vs. IRD28). m LDA scores (left) and abundance (right) computed with distinct features in NHP gut microbiota in response to IR. n qPCR confirmation of B. adolescentis, B. virosa, S. parasanguinis, S. salivarius and Subdoligranulum variabile (S. variabile) abundance in NHP stools (vs. pre-IR). The number of biologically independent animals are indicated in each chart. Data in c, f, h, k, n were analyzed with Kruskal–Wallis test followed by Dunn’s correction; data in d, i were analyzed with PERMANOVA. Data are represented as mean ± SEM.
Fig. 2
Fig. 2. Microbiome-driven precision diagnostics for STEMI using machine learning.
a Workflow for supervised machine learning. b The performance (recorded as area under curve, AUC) of microbiota-based model with different algorithms for the diagnosis of myocardial infarction. n = 10-fold cross-validations. c Receiver operating characteristic (ROC) curve performance using Ctrl-predominant bacteria Bifidobacterium adolescentis (Ba.) and Bifidobacterium ruminantium (Br.). d ROC curve performance using STEMI-predominant bacteria include Streptococcus parasanguinis (Sp.), Streptooccus salivarius (Ss.) and Butyricimonas virosa (Bv.). ROC curves were analyzed with Wilson/Brown test with 95% confidence interval.
Fig. 3
Fig. 3. STEMI fecal microbiota transplantation in germ-free mice deteriorates post-injury cardiac repair.
Twelve-week-old germ-free (GF) mice were colonized with human fecal microbiota for 7 days before cardiac injury. a Experimental design for myocardial infarction (MI) model on fecal microbiota transplantation (FMT)-GF mice (upper panel). The survival rate of FMT-GF mice subjected to MI for 21 days (lower panel). Data were analyzed with log rank (Mantel–Cox) test with 95% confidence interval. b qPCR-based determination of fecal bacterial load for the FMT-GF mice subjected to MI (vs. Ctrl). c Experimental design for angiotensin II (AngII) challenge on FMT-GF mice (upper panel). The survival curve of FMT-GF mice subjected to AngII challenge for 14 days (lower panel). d The fecal bacterial load for the FMT-GF mice administrated with AngII. e Differential grouping of the gut microbiota in Ctrl and STEMI samples in unweighted principal co-ordinates analysis (PCoA). f The ratio of gut Firmicutes relative to Bacteroidetes in FMT mice after cardiac injury. g Echocardiographic analysis of left ventricular ejection fraction (EF, %) and fraction shortening (FS, %) in FMT-GF mice on day 14 after AngII challenge. h Changes in the size of cardiomyocytes in FMT mice subjected to AngII challenge for 14 days. The illustration of muscle orientation in the heart (upper left) and the representative immunofluorescent staining of cardiac tissues with WGA-488 co-stained with actinin (upper right). The statistical analysis of cardiomyocyte size is shown in the lower panel with cell number listed in the inset of each bar. i The colonic pathophysiology of GF mice receiving control and STEMI-FMT were examined with hematoxylin and eosin staining. The statistical analysis of submucosal thickness and villi length of proximal colon is shown the right panel. j The changes of anti-inflammatory and pro-inflammatory cytokines in GF mice receiving control and STEM FMT, determined using multiplex immunoassays. The number of biologically independent mice are indicated in each chart. Kruskal–Wallis test followed by FDR correction was used to analyze data in (b, d, gi) two-way ANOVA was used to analyze data in (f). Data are represented as mean ± SEM.
Fig. 4
Fig. 4. Ketone body biosynthesis and degradation pathways are enriched in STEMI patients.
a Enrichment of metabolic pathways revealed by shotgun metagenomics with Ctrl and STEMIT1 samples. b Schematic illustration of human plasma metabolomics profiling using nuclear magnetic resonance (NMR) and liquid chromatography–mass spectrometry (LC-MS). c Partial Least Squares Discriminant Analysis (PLS-DA) of Ctrl, STEMIT1 and STEMIT2 based on NMR plasma metabolite profiling. d ROC curve for STEMI prediction based on the enrichment of lactate, pyruvate, acetone, acetoacetate, glutamate, 3-hydroxybutyrate and butyrate based on NMR plasma metabolite profiling. e The plasma level of Trimethylamine-N-oxide (TMAO) in human control and STEMI samples determined with NMR (vs. Ctrl). f Metabolic pathway enrichment in the Ctrl, STEMIT1 and STEMIT2 plasma samples via LC-MS analysis. The enrichment ratio was computed by observed hits/expected hits. g The level of human plasma β-hydroxybutyrate using colorimetric assay (vs. STEMIT1). h Nonhuman primates subjected to cardiac ischemic/reperfusion (IR) injury for ninety minutes and the plasma samples were collected at −1D (pre-IR), D1 (IRD1), D7 (IRD7) and D28 (IRD28) and subjected to LC-MS metabolomics profiling. i Enrichment of the metabolic pathways of rhesus macaque at pre-IR, IRD1, IRD7 and IRD28 using LC-MS. j The level of rhesus macaque plasma β-hydroxybutyrate using colorimetric assay (vs. IRD1). The number of biologically independent samples are indicated each chart. Data in a, f, i were analyzed with two-sided unpaired Student’s t-test, data e, g, j were analyzed with Kruskal–Wallis test followed by FDR correction. ROC curves were analyzed with Wilson/Brown test with 95% confidence interval. Data are represented as mean ± SEM.
Fig. 5
Fig. 5. Butyrate supplementation confers better preservation of cardiac function after myocardial injury.
a Experimental design for the effects of butyrate on post-MI cardiac repair (upper panel) in SPF mice. Half of the mice were also treated with antibiotics (ABX) to deplete the gut microbiota. The relative bacterial load in feces on MI day 21 was determined with 16S rRNA qPCR (lower panel). b Level of fecal butyrate on MI day 21 using HPLC analysis. c Plasma level of β-hydroxybutyrate on MI day 21 using colorimetric assay. de Changes in left ventricular d EF and e FS in response to butyrate supplementation on MI day 21. Survival rate of SPF mice 21-days post-MI. f Representative images of cardiac infarct size labeled with picrosirus red and g quantification. h Catheterization analysis of post-MI cardiac function, including ESPVR, EDPVR, PRSW and dP/dt max (vs. EDV). The number of biologically independent mice are indicated in each chart. Data were analyzed with Kruskal–Wallis test followed by FDR correction. Data are represented as mean ± SEM.
Fig. 6
Fig. 6. Inoculation of B. adolescentis and B. virosa improves post-MI cardiac function in germ-free mice.
a Shotgun metagenomics analysis revealed the enrichment of ketogenesis in STEMIT1 samples. Abundance of genes encoding ketogenic enzymes in Ctrl and STEMI samples is presented in the dot plot. b Butyrate production capabilities of B. adolescentis, B. virosa and S. parasanguinis. c β-hydroxybutyrate production capabilities of B. adolescentis, B. virosa and S. parasanguinis. d Experimental design of the myocardial infarction (MI) model in gnotobiotic mice inoculated with B. adolescentis, B. virosa and S. parasanguinis (upper panel). The survival curve of gnotobioic mice subjected to MI for 21 days (lower panel). e Changes in bacterial load in gnotobiotic mice determined with 16S rRNA qPCR. f Bacterial load of B. adolescentis, B. virosa and S. parasanguinis in gnotobiotic mice. g Echocardiographic analysis of the left ventricular ejection fraction (EF, %) and fraction shortening (FS, %) in gnotobiotic mice on MI day 21. h Post-MI cardiac function analysis in gnotobiotic mice, evaluating ESPVR, EDPVR, PRSW and dP/dt max (vs. EDV) using cardiac catheterization. i Representative histology of cardiac infarct size (left panel) and statistics (right panel) in gnotobiotic mice on MI day 21. Cardiac tissues were stained with picrosirius red to label fibrosis. j Colorimetric analysis of the plasma level of β-hydroxybutyrate in gnotobiotic mice on MI day 21. k Representative images of the gut in gnotobiotic mice (left panel), intestinal length (upper right panel) and the length of colon (lower right panel) on MI day 21. The number of biologically independent samples and mice are indicated in each chart. Data were analyzed with Kruskal–Wallis test followed by FDR correction. Data are represented as mean ± SEM. ACAT Acetyl-CoA acetyltransferase, HMGCS 3-hydroxy-3-methylglutaryl-CoA synthase, HMGCL 3-hydroxy-3-methylglutaryl-coenzyme A (HMG-CoA) 2 lyase, OXCT succinyl-CoA:3-oxoacid CoA transferase (OXCT), ADC acetoacetate decarboxylase, BDH beta-hydroxybutyrate dehydrogenase, Bifidobacterium adolescentis (B. adolescentis); Butyricimonas virosa (B. virosa); Streptococcus parasanguinis (S. parasanguinis).
Fig. 7
Fig. 7. Post-MI cardioprotection of butyrate-producers in hmgcs2-Δexon2 (HMGCS2-deficient/HMGCS2def) mice.
a Schematic illustration of liver ketogenesis. b Schematic illustration of HMGCS2def mice using Cre-LoxP system (upper panel) and the level of HMGCS2 protein in liver (lower panel). c The plasma level of β-hydroxybutyrate in HMGCS2def mice before cardiac injury with colorimetric assay (Wt, n = 5; HMGCS2def, n = 8). d The schematic illustration of experimental design for butyrate-producing (Bp) bacteria transplantation in 16-week-old female HMGCS2def mice (upper panel) and the post-MI survival rate of HMGCS2def mice (lower panel). e Loading of Bifidobacterium adolescentis (B. adolescentis), Butyricimonas virosa (B. virosa) and Streptococcus parasanguinis (S. parasanguinis) in HMGCS2def stool. f The plasma level of β-hydroxybutyrate in HMGCS2def mice after MI determined with colorimetric assay. gh Left ventricular ejection fraction (EF) (g) and fraction shortening (FS) (h) of HMGCS2def mice with/without butyrate-producer inoculation after MI. i Representative images of cardiac infarct size labeled with picrosirus red and statistics. The number of biologically independent mice are indicated in each chart. ei Data were analyzed with the Kruskal–Wallis test followed by FDR correction. Data are represented as mean ± SEM.

References

    1. Riquelme E, et al. Tumor microbiome diversity and composition influence pancreatic cancer outcomes. Cell. 2019;178:795–806.e12. doi: 10.1016/j.cell.2019.07.008. - DOI - PMC - PubMed
    1. Britton GJ, et al. Microbiotas from Humans with inflammatory bowel disease alter the balance of gut Th17 and RORgammat(+) regulatory T Cells and exacerbate colitis in mice. Immunity. 2019;50:212–224.e4. doi: 10.1016/j.immuni.2018.12.015. - DOI - PMC - PubMed
    1. Tang WH, et al. Intestinal microbial metabolism of phosphatidylcholine and cardiovascular risk. N. Engl. J. Med. 2013;368:1575–1584. doi: 10.1056/NEJMoa1109400. - DOI - PMC - PubMed
    1. Yachida S, et al. Metagenomic and metabolomic analyses reveal distinct stage-specific phenotypes of the gut microbiota in colorectal cancer. Nat. Med. 2019;25:968–976. doi: 10.1038/s41591-019-0458-7. - DOI - PubMed
    1. Vich Vila A, et al. Gut microbiota composition and functional changes in inflammatory bowel disease and irritable bowel syndrome. Sci. Transl. Med. 2018;10:eaap8914. doi: 10.1126/scitranslmed.aap8914. - DOI - PubMed

Publication types

LinkOut - more resources