. 2023 Nov 9;6(1):1137.
doi: 10.1038/s42003-023-05530-6.

Increasing pulse pressure ex vivo, mimicking acute physical exercise, induces smooth muscle cell-mediated de-stiffening of murine aortic segments

Affiliations

Increasing pulse pressure ex vivo, mimicking acute physical exercise, induces smooth muscle cell-mediated de-stiffening of murine aortic segments

Cédric H G Neutel et al. Commun Biol. .

Abstract

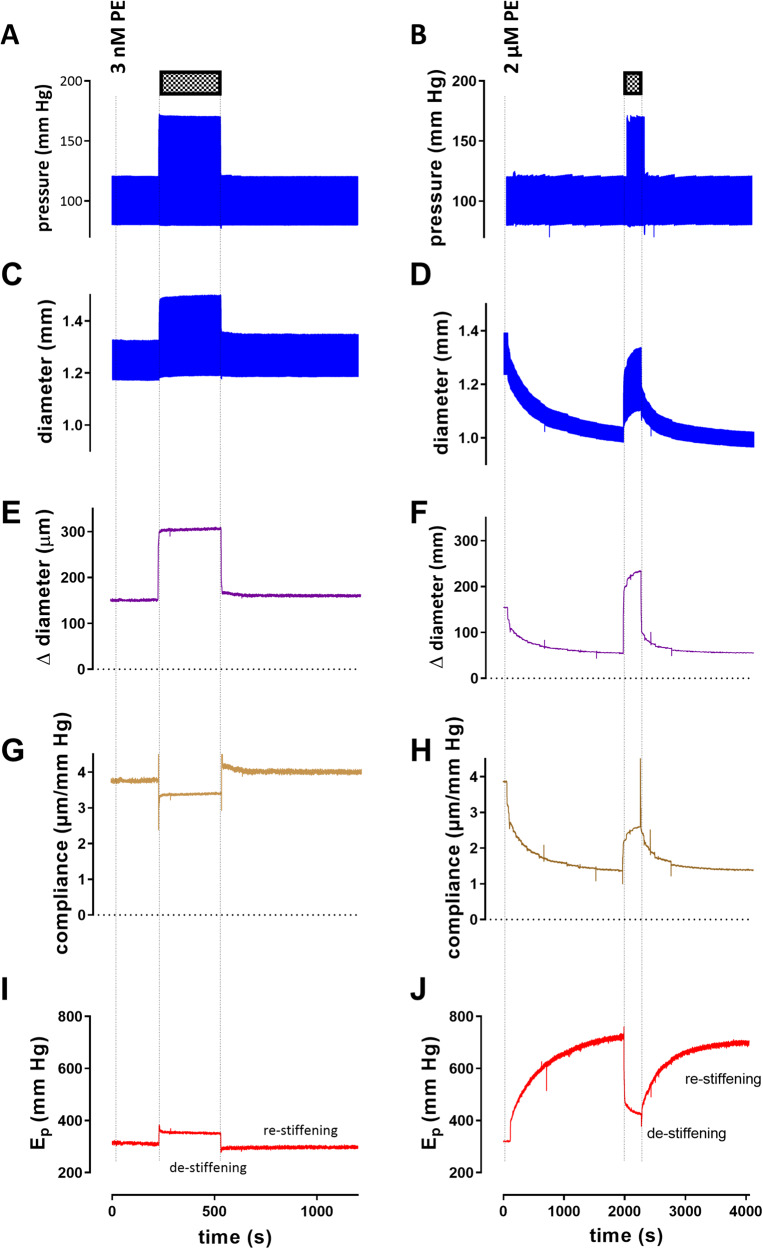
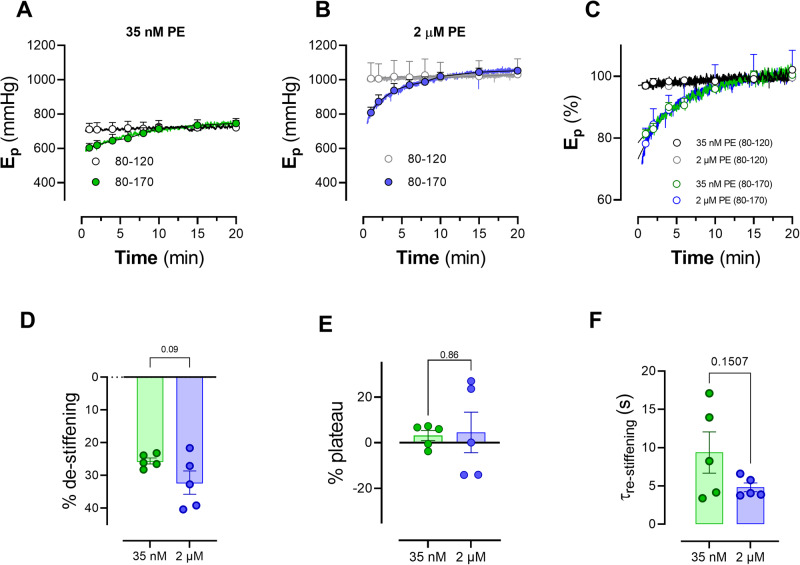
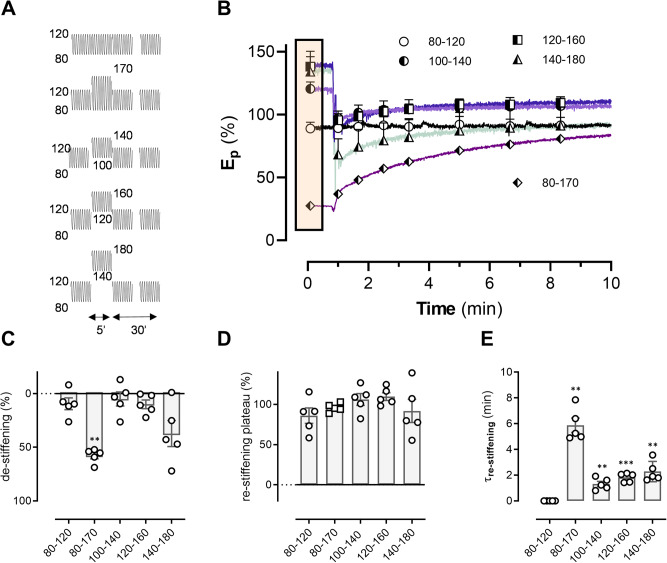
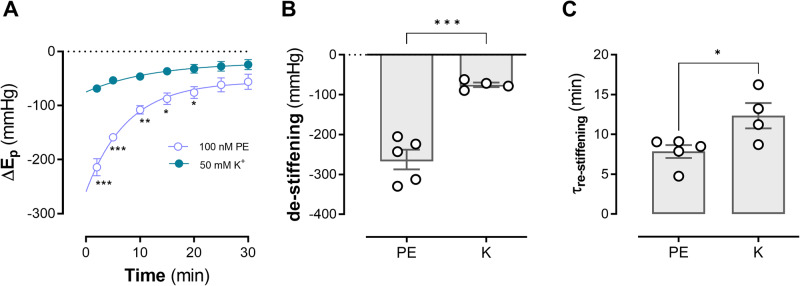
The mechanisms by which physical activity affects cardiovascular function and physiology are complex and multifactorial. In the present study, cardiac output during rest or acute physical activity was simulated in isolated aortic segments of healthy C57BL/6J wild-type mice. This was performed using the Rodent Oscillatory Tension Set-up to study Arterial Compliance (ROTSAC) by applying cyclic stretch of different amplitude, duration and frequency in well-controlled and manageable experimental conditions. Our data show that vascular smooth muscle cells (VSMCs) of the aorta have the intrinsic ability to "de-stiffen" or "relax" after periods of high cyclic stretch and to "re-stiffen" slowly thereafter upon return to normal distension pressures. Thereby, certain conditions have to be fulfilled: 1) VSMC contraction and repetitive stretching (loading/unloading cycles) are a prerequisite to induce post-exercise de-stiffening; 2) one bout of high cyclic stretch is enough to induce de- and re-stiffening. Aortic de-stiffening was highly dependent on cyclic stretch amplitude and on the manner and timing of contraction with probable involvement of focal adhesion phosphorylation/activation. Results of this study may have implications for the therapeutic potential of regular and acute physical activity and its role in the prevention and/or treatment of cardiovascular disease.


Conflict of interest statement

The authors declare no competing interests.

Figures

Fig. 1
Fig. 1. Example of an experimental protocol in which two aortic segments were stretched at a frequency of 10 Hz between 80 and 120 mm Hg in the presence 300 µM L-NAME and 3 nM PE (left) or 2 μM PE and (right).
During 5 min the pulse pressure was increased from 40 to 90 mm Hg (hatched bars), by increasing systolic pressure from 120 to 170 mm Hg and keeping diastolic pressure at 80 mm Hg (A, B). Diameters at diastolic and systolic pressures (C, D) were continuously determined. In (E) and (F), the difference between diastolic and systolic diameter is shown. When divided by the pressure difference, compliance is obtained (G, H). In (I) and (J), the Peterson modulus of elasticity (Ep) is displayed throughout the protocol. As indicated in (J), right after the conditioning period of high pulse pressure, Ep was decreased (termed “de-stiffening”), followed by a return to normal stiffness (termed “re-stiffening”). PE phenylephrine; Ep Peterson’s modulus of elasticity.
Fig. 2
Fig. 2. De-stiffening after conditioning at high stretch depends on the concentration of PE.
Time-dependent increase of Ep of aortic segments (n = 5) contracted with 35 nM (green, A) and 2 µM PE (blue, B), both in the presence of 300 µM L-NAME after a conditioning period of 10 min with PP of 40 mm Hg (80–120 mm Hg, black, gray) and 90 (80–170 mm Hg, green and blue). All Ep values in the figures are measured in isobaric conditions of 80–120 mm Hg after the conditioning period and were normalized to the Ep values at 80–120 mm Hg in the presence of 35 nM PE (black) and 2 µM PE (gray) before the conditioning period in (C). The Ep traces of (AC) are the mean trace for 5 mice and the mean ± SEM is only indicated for certain data points. Individual traces of (AC) were fitted with a mono-exponential function: Ep = Ep(0) + (Ep(30) − Ep(0)) * (1 − exp(−time/τ)) with Ep(0), Ep at time 0 min, Ep(30), Ep at time 30 min, and τ, the time constant of re-stiffening (τre-stiffening). D displays % de-stiffening which is the amount of de-stiffening (100 − (Ep(0)/Ep(30)) * 100). E shows the relative plateau attained after 20 min with respect to the pre-conditioning value of Ep. F displays time constants of re-stiffening. C Two-way ANOVA (repeated measures by both factors) with Tukey’s multiple comparisons test (*, **, ***: p < 0.05, 0.01, 0.001 versus 80–120 mm Hg). DF paired Student’s t test with the p value indicated in the figures. PE phenylephrine, Ep Peterson’s modulus of elasticity.
Fig. 3
Fig. 3. Aortic de-stiffening is dependent on pulse pressure.
Segments were contracted with 2 µM PE in the presence of L-NAME and subjected to conditioning at PP of 40, 60, 90 and 120 mm Hg as shown in the experimental protocol (A). The relative Ep-values (with respect to pre-conditioning Ep values) at PP of 40 mm Hg (80–120 mm Hg) as a function of time (B). Traces are mean traces for five mice with certain data points as mean ± SEM (symbols). A mono-exponential fit of the individual traces of (B) revealed % de-stiffening (relative amount of decrease with respect to pre-conditioning values) (C), time constant of re-stiffening (D) and final amount of stiffness (relative amount of the plateau values of the exponential fit, with respect to the pre-conditioning values (E). n = 5. One-way ANOVA with post hoc test for (CE): *, **, ns: p < 0.05, 0.01 and non-significant. Ep Peterson’s modulus of elasticity.
Fig. 4
Fig. 4. The role of mean pressure in aortic tissue de-stiffening.
Relative Ep in the presence of 300 µM L-NAME and 2 µM PE as a function of time at 80–120 mm Hg after conditioning the segments for 5 min at different pressures. Experimental protocol showing that the pulse pressure was kept constant (at 40 mm Hg) whilst the mean pressure was increased: 80–120, 100–140, 120–160 and 140–180 mm Hg. Data were compared with the higher pulse pressure of 90 mm Hg (80–170 mm Hg) (A). Ep was expressed in % with Ep before the conditioning period as 100% (B). Curves were fitted with a mono-exponential function revealing amplitude of de-stiffening (at 50 s in the graph, when segments were clamped between 80 and 120 mm Hg) (C), amount of re-stiffening (D) and time constants of re-stiffening (E). The box on plot (B) represents the conditioning period for 5 min at 80–120 mm Hg, 100–140 mm Hg, 120–160 mm Hg and 140–180 mm Hg. *, **, ***: p < 0.05, 0.01, 0.001 versus 80–170 mm Hg (n = 5). Ep Peterson’s modulus of elasticity.
Fig. 5
Fig. 5. Ep depends on the type of VSMC contraction.
Ep was measured at 80–120 mm Hg in the absence and presence of 50 mM K+ (green) and 100 nM PE (white). After conditioning at 80–170 mm Hg for 10 min, stretch was re-set to 80–120 mm Hg and the change of EpEp) was measured as a function of time in the different conditions (A). In (B), the absolute amount of de-stiffening at 80–120 mm Hg is expressed, whereas in (C) the time constant of re-stiffening for PE and K+ is shown. Two-way ANOVA with Tukey’s multiple comparison test for (A), unpaired t-test for (B, C). n = 5. *,**,***: p < 0.05, 0.01, 0.001, PE phenylephrine, K potassium(chloride), Ep Peterson’s modulus of elasticity.
Fig. 6
Fig. 6. PP2 affects de- and re-stiffening after conditioning aortic segments at high pulse pressure.
The effects of 10 μM PP2 on Ep were determined at 80–120 mm Hg in the absence (Krebs Ringer; KR) and presence of 50 mM K+ (A, n = 4) or 100 nM PE (B, n = 5). C (K+) and D (PE) show the time-dependent change of Ep (∆Ep) as a function of time in the different conditions after conditioning the segments at 80–170 mm Hg for 10 min. Two-way ANOVA with Sidak’s multiple comparison test *, **, ***: p < 0.05, 0.01, 0.001. PE phenylephrine, K+ potassium(chloride), Ep Peterson’s modulus of elasticity.
Fig. 7
Fig. 7. High pulsatility acutely and reversibly reduces FAK phosphorylation.
The phosphorylation state of whole aorta focal adhesion kinase/FAK(at Tyr397) was investigated before and after VSMC contraction and during 15 min after acute high pulsatile stretch (4 min at 80–170 mmHg diastolic and systolic pressure respectively). VSMC contraction induces pFAK whereas 1 min after acute high pulsatile stretch the amount of pFAK is decreased. pFAK increases again after 5 and 15 min, indicating the reversibility of stretch-induced FAK dephosphorylation. Samples derive from parallel experiments and gels/blots were performed in parallel as well. Statistics was performed using a one sample T-test on Log2 transformed values (hypothetical value = 0), *p < 0.05. n = 5. (p)-FAK (phosphorylated)-focal adhesion kinase.

References

    1. Green DJ, Hopman MT, Padilla J, Laughlin MH, Thijssen DH. Vascular adaptation to exercise in humans: role of hemodynamic stimuli. Physiol. Rev. 2017;97:495–528. doi: 10.1152/physrev.00014.2016. - DOI - PMC - PubMed
    1. Hawley JA, Joyner MJ, Green DJ. Mimicking exercise: what matters most and where to next. J. Physiol. 2021;599:791–802. doi: 10.1113/JP278761. - DOI - PMC - PubMed
    1. Gielen S, Schuler G, Adams V. Cardiovascular effects of exercise training: molecular mechanisms. Circulation. 2010;122:1221–1238. doi: 10.1161/CIRCULATIONAHA.110.939959. - DOI - PubMed
    1. De Moudt S, Leloup A, Van Hove C, De Meyer G, Fransen P. Isometric stretch alters vascular reactivity of mouse aortic segments. Front. Physiol. 2017;8:157. doi: 10.3389/fphys.2017.00157. - DOI - PMC - PubMed
    1. Leloup A, De Moudt S, Van Hove C, Fransen P. Cyclic stretch alters vascular reactivity of mouse aortic segments. Front. Physiol. 2017;8:858. doi: 10.3389/fphys.2017.00858. - DOI - PMC - PubMed

Publication types