. 2023 Dec;4(12):1660-1674.
doi: 10.1038/s43018-023-00657-1. Epub 2023 Nov 9.

Genomic and immune signatures predict clinical outcome in newly diagnosed multiple myeloma treated with immunotherapy regimens

Affiliations

Genomic and immune signatures predict clinical outcome in newly diagnosed multiple myeloma treated with immunotherapy regimens

Francesco Maura et al. Nat Cancer. 2023 Dec.

Abstract

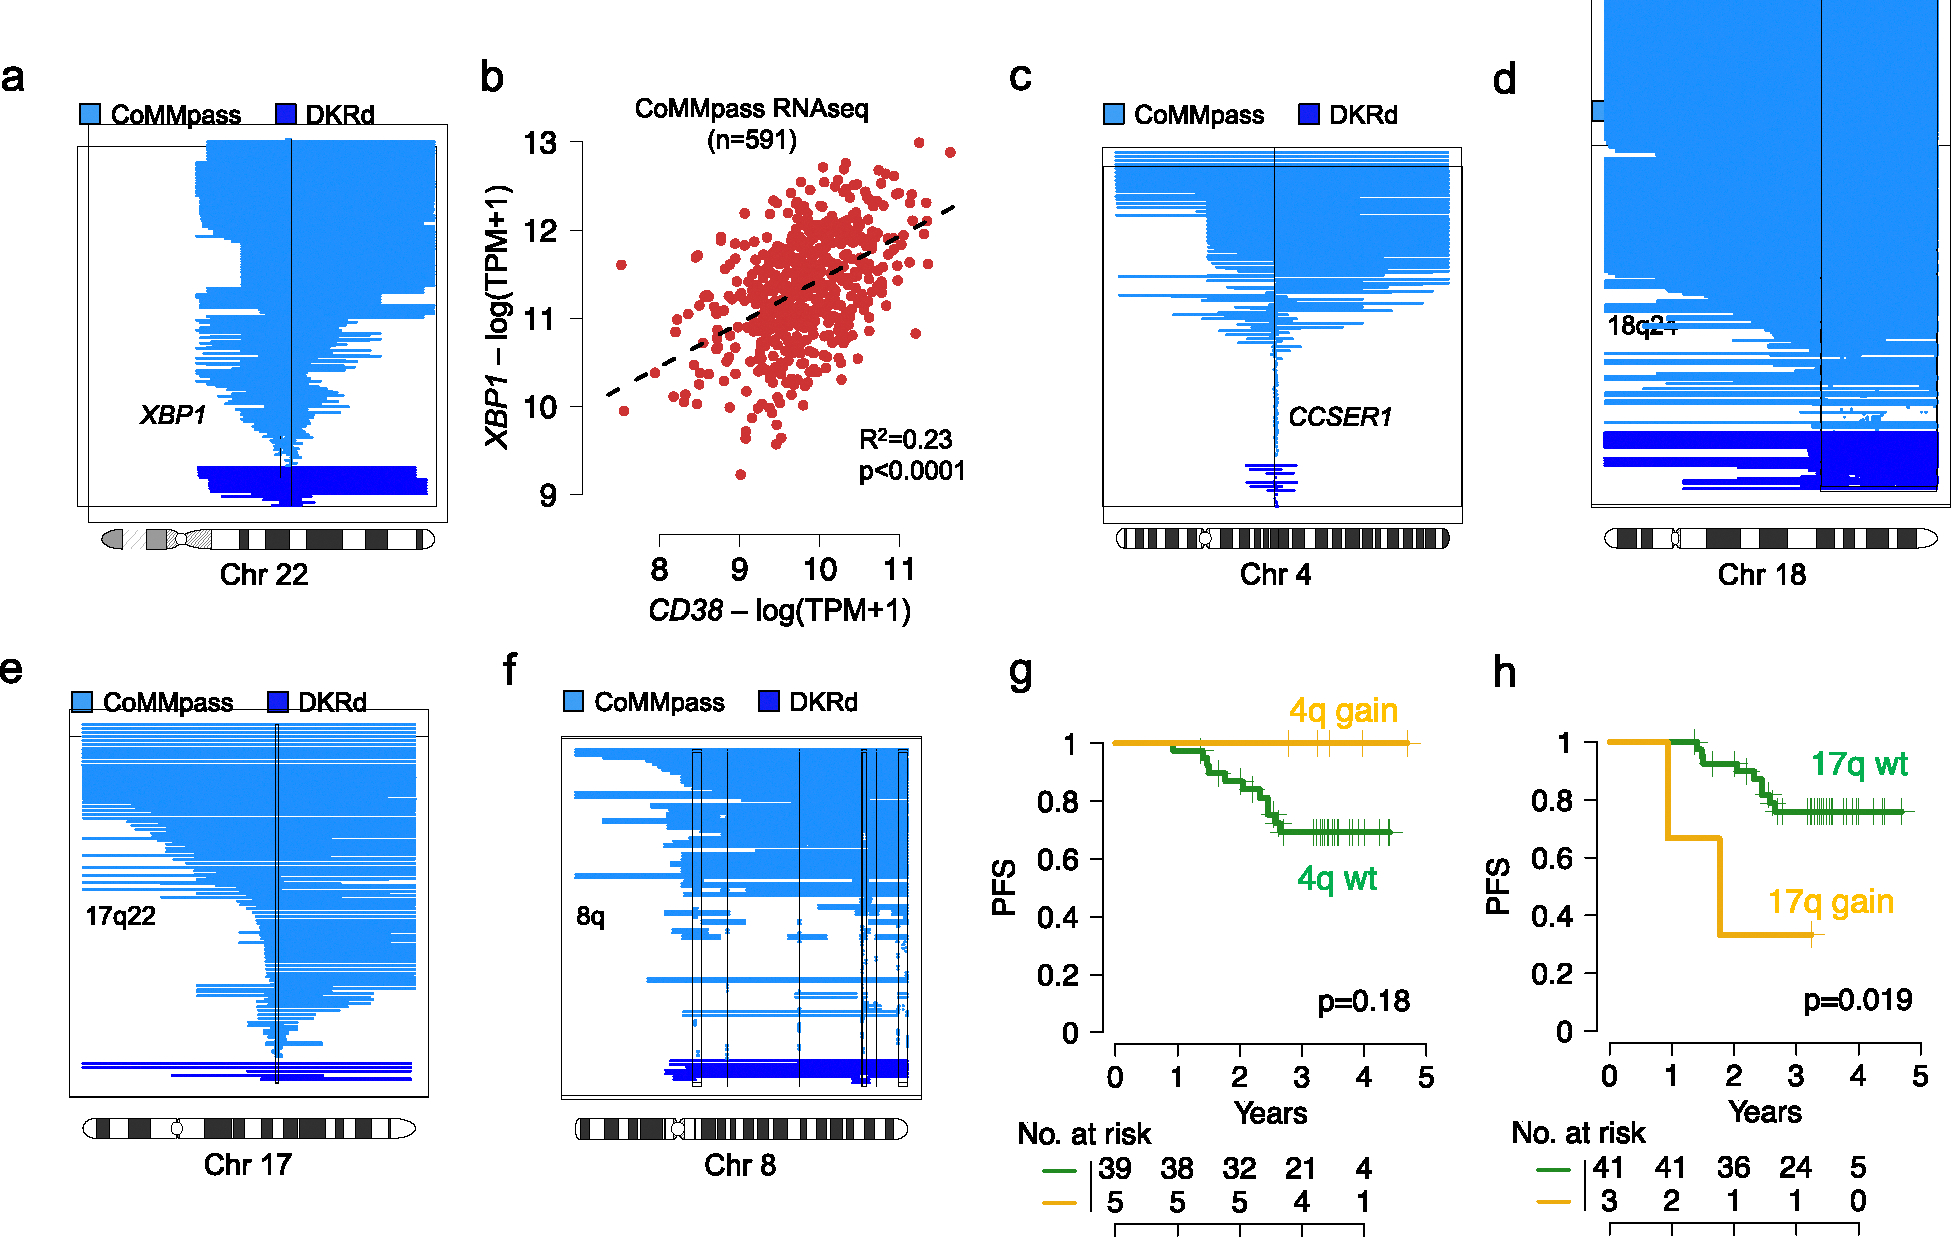
Despite improving outcomes, 40% of patients with newly diagnosed multiple myeloma treated with regimens containing daratumumab, a CD38-targeted monoclonal antibody, progress prematurely. By integrating tumor whole-genome and microenvironment single-cell RNA sequencing from upfront phase 2 trials using carfilzomib, lenalidomide and dexamethasone with daratumumab ( NCT03290950 ), we show how distinct genomic drivers including high APOBEC mutational activity, IKZF3 and RPL5 deletions and 8q gain affect clinical outcomes. Furthermore, evaluation of paired bone marrow profiles, taken before and after eight cycles of carfilzomib, lenalidomide and dexamethasone with daratumumab, shows that numbers of natural killer cells before treatment, high T cell receptor diversity before treatment, the disappearance of sustained immune activation (that is, B cells and T cells) and monocyte expansion over time are all predictive of sustained minimal residual disease negativity. Overall, this study provides strong evidence of a complex interplay between tumor cells and the immune microenvironment that is predictive of clinical outcome and depth of treatment response in patients with newly diagnosed multiple myeloma treated with highly effective combinations containing anti-CD38 antibodies.


Conflict of interest statement

CONFLICT OF INTEREST STATEMENT

O.L. has received research funding from: National Institutes of Health (NIH), National Cancer Institute (NCI), U.S. Food and Drug Administration (FDA), Multiple Myeloma Research Foundation (MMRF), International Myeloma Foundation (IMF), Leukemia and Lymphoma Society (LLS), the Paula and Rodger Riney Myeloma Foundation, Tow Foundation, Myeloma Solutions Fund, Perelman Family Foundation, Rising Tide Foundation, Amgen, Celgene, Janssen, Takeda, Glenmark, Pfizer, Seattle Genetics, Karyopharm; Honoraria/ad boards: Adaptive, Amgen, Binding Site, BMS, Celgene, Cellectis, Glenmark, Janssen, Juno, Pfizer; and serves on Independent Data Monitoring Committees (IDMCs) for clinical trials lead by Takeda, Merck, Janssen, Theradex.

G.J.M. has received funding from National Institutes of Health (NIH), National Cancer Institute (NCI), Multiple Myeloma Research Foundation (MMRF), Leukemia and Lymphoma Society (LLS), Perelman Family Foundation, Amgen, Celgene, Janssen, Takeda; Honoraria/ad boards: Adaptive, Amgen, BMS, Celgene, Janssen; and serves on Independent Data Monitoring Committees (IDMCs) for clinical trials lead by Takeda, Karyopharm and Sanofi.

M.S.: Clinical trial research support to institution: Angiocrine Bioscience, Inc.; Omeros Corporation; Amgen, Inc. Consultancy: Omeros Corporation; Angiocrine Bioscience, Inc. (past); McKinsey & Company (past). Ad-hoc advisory board: Kite – A Gilead Company (past) CME activity honorarium: i3Health (past); Medscape, LLC. (past), CancerNetwork.

G.S.: research funding to the institution from Janssen, Amgen, BMS, and Beyond Spring. DSMB for Arcellx

S.G. receives research funding from Miltenyi Biotec, Takeda Pharmaceutical Co., Celgene Corp., Amgen Inc., Sanofi, Johnson and Johnson, Inc., Actinium Pharmaceuticals, Inc., and is on the Advisory Boards for: Kite Pharmaceuticals, Inc., Celgene Corp., Sanofi, Novartis, Johnson and Johnson, Inc., Amgen Inc., Takeda Pharmaceutical Co., Jazz Pharmaceuticals, Inc., Actinium Pharmaceuticals, Inc.

U.A.S. reports research funding support from Celgene/BMS, Janssen to the institution, non-financial research support; personal fees from ACCC, MashUp MD, Janssen Biotech, Sanofi, BMS, MJH LifeSciences, Intellisphere, Phillips Gilmore Oncology Communications, i3 Health and RedMedEd outside the submitted work.

S.U. Research funding: Abbvie, Amgen, Array Biopharma, BMS, Celgene, Gilead, GSK, Janssen, Merck, Pharmacyclics, Sanofi, Seattle Genetics, SkylineDX, Takeda. Advisory/Consulting: Abbvie, Amgen, BMS, Celgene, EdoPharma, Genentech, Gilead, GSK, Janssen, K36 Therapeutics, Moderna, Novartis, Oncopeptides, Sanofi, Seattle Genetics, SecuraBio, SkylineDX, Takeda, TeneoBio.

AD served as a consultant for Incyte, EUSA Pharma, Loxo and receives research support from Roche and Takeda.

BD Honoraria and Advisory Boards from Janssen and Sanofi.

All other authors have no conflicts of interest to declare.

Figures

Extended Data Figure 1.
Extended Data Figure 1.. Outcomes and clinical features.
Clinical impact of sex (Female n=31, Male n=18), Race (African Americans n=4, White n=38), age (<65 years n=37; >65 years n=12), Isotype (IgG n=30; IgG 30; Light chain 9), and ISS (ISS1 n=22, ISS2 n=24, ISS3 n=3). PFS: progression free survival; ISS: international scoring system.
Extended Data Figure 2.
Extended Data Figure 2.. Focal and large copy number aberrations associated with poor prognosis and non-sustained MRD-negativity.
a) Copy number cumulative plot for XBP1 deletions across the CoMMpass trial (n= 752) and the (D)KRd study (n=60). b) Correlation between XBP1 and CD38 expression using CoMMpass newly diagnosed MM patients with available RNAseq data (n=591). R2 and p-value were estimated using linear regression (lm R package). c-f) Copy number cumulative plot for CCSER1 deletion, large gains on 18q24, 17q22 and 8q. In a) and c-d) vertical black lines represent the GISTIC peak positions. g-h) Clinical impact of large gains on 4q (g) and 17q (h). In g-h) dark green always reflect the wild type (WT), while the dark yellow reflect the mutated cases.
Extended Data Figure 3.
Extended Data Figure 3.. Landscape of the immune environment according to time point and response group.
Projected cells on reference UMAP by time-point and response. Each UMAP has a comparable number of cells to the normal bone marrow reference. T1=time-point 1, T2=timepoint 2, n=number of cells, ref_UMAP= reference UMAP, WNN_UMAP= Weighted Nearest Neighbor Analysis derived UMAP, Mono= monocytes, NK=natural killer, DC=dendritic-cells. Visual differences can be appreciated such as the significant reduction in B and T-cell at T2 in patients who achieve MRD-negativity. n=represent number of cells.
Extended Data Figure 4.
Random sampling of a maximum of 500, 1000, 1500, 2000, 2500, 3000, and 3500 cells per sample (samples, n=37) show similar findings in terms of cell numbers consistent with these findings being real. Two-sided p-values were estimated using Kruskal-Wallis test. Boxplots represent quartiles centered around the median.
Extended Data Figure 5.
Extended Data Figure 5.. Changes in cellular population across time and response (n=37).
Boxplot showing the differences in cellular populations between T1 (baseline) and T2 (post-therapy) in patients that achieve or fail to achieve sustained MRD-negativity. N1=sustained MRD-negativity group at T1 (n=8), N2=sustained MRD-negativity group at T2 (n=10), P1=no sustained MRD-negativity group at T1 (n=9), P2=no sustained MRD-negativity group at T2 (n=10). Two-sided p-values were estimated using Kruskal-Wallis test. Boxplots represent quartiles centered around the median. a) Memory B-cells; b) Naïve B-cells; c) B1 Progenitor cells; d) B2 progenitor cells; e) Dendritic cell Progenitor; f) megakaryocytic progenitor; g) lympho-myeloid progenitor; h) red blood cell progenitor; i) granulocyte-monocyte progenitor; j. hematopoietic stem-cell; k) gamma/delta T-cell; l) mucosae-associated T-cells; m) Regulatory T-cells; n) CD4 effector 1; o) CD4 effector 2; p) CD8 memory 1; q) CD8 memory 2; r) CD8 naïve; s. CD4 memory; t) CD4 naïve; u) CD4/CD8 ratio; v) classical dendritic cells 2; w) Plasmacytoid dendritic cells.
Extended Data Figure 6.
Extended Data Figure 6.. Heatmap representation of the NK clusters.
Three NK clusters were identified. NK-Cluster #3 and NK-Cluster 4 have a phenotype consistent with monocytes and mesenchymal stromal cells respectively. NK-Cluster #0 is characterized by high levels of IFNγ which are likely involved in the regulation of T-helpers and the differentiation of monocytes into macrophages. NK-Cluster #1 NK-cells, express CX3CR1 that encodes for a G-coupled receptor protein involved in intracellular signaling responsible for modulating cell activity towards higher active state by promoting survival, migration and proliferation. These activated NK-cells are more common at T1 in the poor responders. Interestingly a subset of them seem to express a TCR suggesting some of them be NK-T cells. NK-Cluster #2 is characterized by high XCL1 suggesting they encompass a second subset of activated NK-cells. They are associated with poor response at T2. NK-Cluster #3 expresses high levels of alarmins (S100A8 and S100A8) alongside CD14 and were therefore reclassified as monocytes. Finally, NK-Cluster #4 expresses LEPR+ suggesting it may be an MSC population. T1=timepoint 1, T2=timepoint 2.
Extended Data Figure 7:
Shannon diversity and number of T-cell clones per sample identified. a) Overall there was no significant differences in the number of clones identified, b) The Shannon diversity index was higher in good responders at T1 and decreased significantly in good responders at T2. N1=sustained MRD-negativity group at T1 (n=8), N2=sustained MRD-negativity group at T2 (n=10), P1=no sustained MRD-negativity group at T1 (n=9), P2=no sustained MRD-negativity group at T2 (n=10). Two-sided p-values were estimated using Kruskal-Wallis test. Boxplots represent quartiles centered around the median.
Extended Data Figure 8.
Extended Data Figure 8.. Monocytes and dendritic cell clustering highlight phenotypic changes.
a) Heatmap representation of the monocyte and dendritic cells. Cluster #5 and #6 are the two dendritic cell clusters (cDC2 and pDC, respectively). Cluster #7 expresses both complement, adhesion markers, and HLA consistent with them being antigen presenting cells. Cluster #3 expresses FCGR3A which encodes for the FcγRIII, also known as CD16. Cluster #0 Cluster #2 and Cluster #4 probably represent classical monocytes. Cluster #0 expresses VEGFA suggesting it may be involved in neo-angiogenesis and recruitment of immune cells. Cluster #2 expresses high levels of adhesion markers such as CXCL2 and IL1B suggesting it may be a resident monocyte. Finally, Cluster #1, expresses both classical and non-classical features, suggesting these are intermediate markers. b) Differential expression suggesting an enrichment. c) For monocyte p38MAPK activation at T1, in patients that achieved sustained MRD negativity.
Extended Data Figure 9.
Pairwise comparison of overall populations (L1) and subpopulations (L2) of samples with both timepoints available (patients n=16). Impressions are similar in both analyses with decrease in B-cells, T-cells, and NK cells at T2 albeit less apparent in patients who failed to achieve sustained MRD-negativity and increase in monocytes at the second time-point in patients who achieved sustained MRD-negativity. P-values were estimated using Wilcoxon-paired test.
Extended Figure 10.
Extended Figure 10.
Identification of response associated immune-signatures. Partition Around Medoids (PAM) bi-plot representation. Blue-lines indicate loading vectors (NK= NK cells, Mono=Monocytes, T=T-cells), Confidence ellipse. T1=first timepoint, T2=second timepoint).
Fig. 1.
Fig. 1.. Clinical impact of mutational signatures on progression free survival (PFS).
a) PFS for the entire cohort (n=49). b) Impact of sustained MRD-negativity (n= 24) and non-sustained MRD negativity (n=25) on PFS. c) PFS for patients with (n=9) and without (n=40) high-risk cytogenetic aberrations (HRCA) treated with DKRd. d) Boxplot showing the association between high single base substitution (SBS) mutational burden and PFS in patients treated with DKRd with available WGS data (n=44). P-value was estimated using Wilcoxon test. Boxplot is presented as mean values +/− standard deviation. e) SBS mutational signatures landscape across the entire study cohort (n=44 WGS). Samples are divided in progressed and not progressed and ordered according to APOBEC contribution (i.e. SBS2 + SBS13). GC: germinal center. ROS: radical oxygen stress. f) Kaplan Meier curve comparing high (n=22) vs low (n=22) APOBEC mutational activity on PFS. g) Kaplan-Meier curve showing the impact of SBS9 on PFS. Patients were divided in two groups: SBS9 high (4th quartile, n=12) and SBS9 low (1st-3rd quartile; n=32). The association between SBS9 and shorter PFS is likely the results of the known low SBS9 contribution among patients with high APOBEC. In b), c) p-values were estimated using log-rank test. In f) and g) two-sided p values were generated using coxph and APOBEC as linear variable. For graphical purpose we created a Kaplan Meier curve dividing patients according to the APOBEC median. PD: progressors; no-PD: non progressors.
Fig. 2.
Fig. 2.. Impact of recurrent copy number variants on progression free survival (PFS).
a) Heatmap summarizing the distribution of the copy number aberrations with a significant impact on PFS and/or on the rate of sustained MRD-negativity. Light red for XBP1 deletion reflects the three cases with copy neutral loss of heterozygosity (CN-LOH) on XBP1. Samples are order according to hierarchical clustering using ward method. b) Cumulative plot for deletions on 1p across 44 WGS. c-e) Kaplan Meier curves showing the impact of 1p22 (RPL5; c), 16q12.1 (CYLD; d), and 22q.11.2 (XBP1; e) on PFS. P-values were calculated using logrank test. f-g) Boxplot showing enrichment of CYLD (f) and XBP1 (g) among patients that achieved a response (n=20) vs the non-responders (n=7) after DKRd in the Kydar study. Two-side p-value was estimated using Wilcoxon test. R: responders; NR: non responders. Boxplot is presented as mean values +/− standard deviation. h) Cumulative copy number plot showing focal deletions on IKZF3. PD: progressive disease, CR: remission. i) Kaplan Meier curve showing the impact of IKZF3 focal loss on PFS in the CoMMpass trial. P-value were calculated using logrank test. In c-e) and i) dark green always reflect the wild type (WT), while the dark yellow reflect the mutated cases.
Fig. 3.
Fig. 3.. Impact of recurrent large copy number variants and structural variants on progression free survival (PFS).
a-b) Kaplan Meier curves showing the impact of CCSER1 deletion (a), and KLF2 SV (b) on PFS. c) Boxplot showing enrichment of KLF2 among patients that did not respond (NR) compared to the responders (R) to DKRd in the Kydar study. Two-sided p -value was estimated using Wilcoxon test. Boxplot is presented as mean values +/− standard deviation. d-f) Kaplan-Meier curves showing the impact of MYC SV (d), 8q gain (e), and 18q gain (f) on PFS. In a-b) and d-f) dark green always reflect the wild type (WT), while the dark yellow reflect the mutated cases. P-values were calculated using logrank test. g) Gene ontology pathway enrichment tested for the 4 large chromosomal gains vs wild type in the CoMMpass trial and for the responders vs non-responders in the Kydar trial.
Fig. 4.
Fig. 4.. Landscape of the immune environment according to time point and response group.
a) Boxplot showing the changes in overall populations between T1 and T2 in patients that achieve or fail to achieve sustained MRD-negativity. b) Projected cells on reference UMAP by timepoint and response. Each UMAP has a comparable number of cells. Visual differences can be appreciated such as the significant reduction in B and T-cell at T2 in patients who achieve sustained MRD-negativity. in a-b) T1=timepoint 1 (n=17), T2=timepoint 2 (n=20), N1=sustained MRD-negativity group at T1 (n=9), N2=sustained MRD-negativity group at T2 (n=10), P1=no sustained MRD-negativity group at T1 (n=8), P2=no sustained MRD-negativity group at T2 (n=10), n=number of cells, ref_UMAP= reference UMAP, CD=cluster of differentiation, Mono= monocytes, NK=natural killer, cDC2=classical Dendritic cells 2, gdT=γ/δ T-cells, HSC= Hematopoietic stem-cells, LMPP= Lympho-myeloid primed progenitor, MAIT= mucosae associated invariant T cell, pDC= plasmacytoid Dendritic cells, Prog=Progenitor, DC=dendritic-cell, Mk=Megakaryocyte, RBC=Erythrocytes, T-reg=regulatory T-cell.
Fig. 5.
Fig. 5.. Analysis of NK subpopulations.
a-b) Boxplot showing the changes in NK-cells according to response and timepoint. c) UMAP colored by NK Clusters and three feature UMAP plots highlighting the main characteristic of each NK-Cluster. d) Boxplot representing the proportions of NK-Cluster #0, NK-Cluster #1, and NK-Cluster #2 and change according to response. In a-b) and d) Two-sided p-values were estimated using the Kruskal-Wallis test. Boxplots represent quartiles centered around the median. N1=sustained MRD-negativity group at T1 (n=9), N2=sustained MRD-negativity group at T2 (n=10), P1=no sustained MRD-negativity group at T1 (n=8), P2=no sustained MRD-negativity group at T2 (n=10)
Fig. 6.
Fig. 6.. Analysis of Monocyte subpopulations
a) Boxplot showing the changes in Monocytes according to response and timepoint. b) UMAP colored by Monocyte Clusters (left) and UMAP colored by Monocyte annotation (L2, right). c) Feature plot highlighting the main characteristic of each cluster. d) Boxplot representing the proportions of each Monocytic cluster (#0,#1,#2,#3,#4,#7). In a) and d) Two-sided p-values were estimated using the Kruskal-Wallis test. Boxplots represent quartiles centered around the median. N1=sustained MRD-negativity group at T1 (n=9), N2=sustained MRD-negativity group at T2 (n=10), P1=no sustained MRD-negativity group at T1 (n=8), P2=no sustained MRD-negativity group at T2 (n=10)
Fig. 7.
Fig. 7.. Impact of immune microenvironment on depth of response.
a) Hierarchical clustering based on the immune population for patients with samples collected both at T1 (baseline) and T2 (post-treatment). b) Cartoon summarizing the intrinsic and extrinsic features associated with depth of response and clinical outcome in NDMM treated with daratumumab based regimens. The cartoon was generated using Biorender.

References

    1. Rajkumar SV Multiple myeloma: 2020 update on diagnosis, risk-stratification and management. Am J Hematol 95, 548–567 (2020). - PubMed
    1. Shah UA & Mailankody S Emerging immunotherapies in multiple myeloma. BMJ 370, m3176 (2020). - PubMed
    1. Costa LJ, et al. Daratumumab, Carfilzomib, Lenalidomide, and Dexamethasone With Minimal Residual Disease Response-Adapted Therapy in Newly Diagnosed Multiple Myeloma. J Clin Oncol, JCO2101935 (2021). - PubMed
    1. Derman BA, et al. Elotuzumab and Weekly Carfilzomib, Lenalidomide, and Dexamethasone in Patients With Newly Diagnosed Multiple Myeloma Without Transplant Intent: A Phase 2 Measurable Residual Disease-Adapted Study. JAMA Oncol (2022). - PMC - PubMed
    1. Diamond B, et al. Dynamics of minimal residual disease in patients with multiple myeloma on continuous lenalidomide maintenance: a single-arm, single-centre, phase 2 trial. Lancet Haematol 8, e422–e432 (2021). - PubMed