. 2023 Dec;24(12):2091-2107.
doi: 10.1038/s41590-023-01655-2. Epub 2023 Nov 9.

Regulatory T cell-derived IL-1Ra suppresses the innate response to respiratory viral infection

Affiliations

Regulatory T cell-derived IL-1Ra suppresses the innate response to respiratory viral infection

Jason W Griffith et al. Nat Immunol. 2023 Dec.

Abstract

Regulatory T (Treg) cell modulation of adaptive immunity and tissue homeostasis is well described; however, less is known about Treg cell-mediated regulation of the innate immune response. Here we show that deletion of ST2, the receptor for interleukin (IL)-33, on Treg cells increased granulocyte influx into the lung and increased cytokine production by innate lymphoid and γδ T cells without alteration of adaptive immunity to influenza. IL-33 induced high levels of the interleukin-1 receptor antagonist (IL-1Ra) in ST2+ Treg cells and deletion of IL-1Ra in Treg cells increased granulocyte influx into the lung. Treg cell-specific deletion of ST2 or IL-1Ra improved survival to influenza, which was dependent on IL-1. Adventitial fibroblasts in the lung expressed high levels of the IL-1 receptor and their chemokine production was suppressed by Treg cell-produced IL-1Ra. Thus, we define a new pathway where IL-33-induced IL-1Ra production by tissue Treg cells suppresses IL-1-mediated innate immune responses to respiratory viral infection.


Conflict of interest statement

Competing Interest Statement: The authors declare no competing interests.

Figures

Extended Data Figure 1.
Extended Data Figure 1.. Deletion of Treg cells in Foxp3DTR mice.
(a-j) Wild-type (WT) C57BL/6J controls (white circles), Foxp3ERT2Cre controls (grey circles) and Foxp3DTR mice (green circles) were infected with 0.3LD50 PR8 influenza and all strains were treated with DT on day 2 post infection to deplete Treg cells in the Foxp3DTR mice, and harvested on day 5 (WT n=9, Foxp3ERT2Cre n=10, Foxp3DTR n=16), 7 (WT n=11, Foxp3ERT2Cre n=11, Foxp3DTR n=9), and 10 (WT n=10, Foxp3ERT2Cre n=9, Foxp3DTR n=5) post-infection. Uninfected mice treated with DT and harvested 5 days later were indicated on the X axis as (WT n=7, Foxp3ERT2Cre n=4, Foxp3DTR n=4). (a) Representative gating strategy to determine the number of i.v. Ab alveolar macrophages (SiglecF+CD11chi), eosinophils (SiglecF+CD11clo-int), DCs (SiglecFCD11chi, MHCIIhi), inflammatory monocytes (SiglecF-CD11clo-intCD11b+CD64+F4/80int-hiLy6C+) and neutrophils (CD11cMHCIIF480CD64CD11b+Ly6G+) in the lung during influenza infection. BAL was assessed in a similar manner except that all cells in the BAL were negative for the i.v. Ab. The ratio of Ly6G+CD11b+ neutrophils compared to total viable i.v. Ab parenchymal cells was also assessed. (b) Total number of viable cells that were defined as lung parenchymal cells by i.v. Ab staining. (c) Total number of viable BAL cells. (d) Total number of Ly6C+ monocytes in the BAL. Total number of IFNγ+ (e) and IL-17+ (f) CD4+ T cells as well as IFNγ+ CD8+ T cells (g) and IL-17-producing γδ T cells (h) as determined by intracellular cytokine staining. IFNγ Foxp3ERT2Cre n=10, Foxp3DTR n=10) (i) and CXCL5 (Foxp3ERT2Cre n=6, Foxp3DTR n=6) (j) levels in the BAL on day 5 as measured by ELISA and normalized to total protein (DT in these experiments was given on days 2 and 4 post infection). (k) Survival in the WT controls (black) and Foxp3DTR (green) mice after infection of an LD50 dose of PR8 influenza and administration of one dose of DT on day 9 of infection. Uninfected Foxp3DTR mice treated with DT were also included (grey line). Unless otherwise indicated, data are pooled from 2–3 experiments and each dot represents one mouse. Statistics for b-h by two-way ANOVA with Šídák's multiple comparisons test and for i,j Two-tailed unpaired students T-test. Statistical significance for the survival experiment (k) was assessed by Log-Rank (Mantel-Cox) test. Data presented in box and whiskers plots: whiskers are max and min, box 25–75 percentile and line is median. P values indicated in the figure.
Extended Data Figure 2.
Extended Data Figure 2.. ST2+ Treg cells expand in the lung and BAL early during influenza.
(a-i) Foxp3YFPCre mice were infected with influenza and harvested on the indicated day of infection. (a) Representative gating strategy used to analyze lung parenchymal (i.v. Ab) Treg cells and the expression of ST2 and CXCR3. (b-d) Representative flow cytometry, number and percentage of Treg cells to CD4+ T cells in the lung i.v. Ab+ blood compartment (b), the lung i.v. Ab parenchyma (c) and the BAL (d) (Representative experiment of 2 performed, day 0: n=3, day 4: n=4, lung day 7: n=5, BAL day 7 n=6, lung day 11: n=4, BAL day 11: n=6, day 14: n=3). (e) Representative flow cytometry (left) and total number (right) of ST2+ (blue) and CXCR3+ (red) and ST2CXCR3 CD3+CD4+Foxp3+ Treg cells isolated from the BAL on the indicated day post influenza infection (Representative experiment of 2 performed, day 0: n=5, day 4: n=3, day 7: n=6, day 11: n=5). (f) Representative flow cytometry comparing ST2 and CXCR3 expression on parenchymal and blood Treg cells isolated from lungs harvested on indicated day post influenza infection. (g) Representative flow cytometry (top) and % positive cells (bottom) for CD69 expression on parenchymal and blood Treg cells isolated from the lung of influenza infected mice on day 5 of infection (Representative experiment of 2 performed, n=4). (h) Representative flow cytometry of ST2 and Helios expression on parenchymal CD3+CD4+Foxp3+ Treg cells isolated from the lung from mice on the indicated day of infection. (i) Representative flow cytometry of ST2 and KLRG1 expression (top) or CXCR3 and KLRG1 expression (bottom) on parenchymal CD3+CD4+Foxp3+ Treg cells isolated from the lung from mice on the indicated day of infection. All statistics were calculated by ordinary one-way ANOVA with Tukey’s multiple comparisons except for (g) which used an unpaired two-tailed t-test. For line graphs: Error bars, mean ± SD. For box and whiskers plots: whiskers are max and min, box 25–75 percentile and line is median. P values are indicated in plots.
Extended Data Figure 3.
Extended Data Figure 3.. Conditional deletion of ST2 on Treg cells altered Treg cell activation and the innate immune response to infection.
(a-h) Foxp3YFPCre controls (white) and Il1rl1fl/fl littermate controls (grey) and Il1rl1fl/flFoxp3YFPCre mice (blue) were infected with 0.3LD50 PR8 influenza and harvested on the indicated day post infection. (a) Treg cells (left) and Foxp3CD4+ T cells (right) were sorted from the lungs on day 7 of infection and subjected to RT-qPCR for analysis of Il1rl1 mRNA levels (Each dot represents the mean of 1 experiment, Foxp3YFPCre n=4, Il1rl1fl/flFoxp3YFPCre n=3). (b) MFI of CD69 expression (left; Foxp3YFPCre n=5, Il1rl1fl/flFoxp3YFPCre n=5) and % cells positive for Ki67(right; Foxp3YFPCre n=6, Il1rl1fl/flFoxp3YFPCre n=5) on CD3+CD4+Foxp3+ Treg cells in the lung parenchyma on day 4 of infection. (c) MFI of KLRG1 (left) and Foxp3 (right) expression of CD3+CD4+Foxp3+ Treg cells on day 7 of infection in the indicated mouse strains (Il1rl1fl/fl n=4, Foxp3YFPCre n=6, Il1rl1fl/flFoxp3YFPCre n=4). (d) Representative flow cytometry and total number of CD3+CD4+Foxp3+ Treg cells in the lung that stained positive for the indicated cytokines on day 9 of influenza infection in Foxp3YFPCre (white, n=8) and Il1rl1fl/fl (grey, n=3) littermate controls and Il1rl1fl/flFoxp3YFPCre (blue, n=6) mice. (e) Flow cytometry was used to quantify the number of SiglecFCD11cloCD11b+CD64F4/80-Ly6G+ neutrophils in the BAL (far left), SiglecF+CD11clo eosinophils in the BAL (left), SiglecFCD11cCD11b+CD64+F4/80int-hiLy6C+ inflammatory monocytes in the BAL (right) and, SiglecF+CD11chi alveolar macrophages in the BAL (far right) in the lung on the indicated day post infection in Foxp3YFPCre (white, day 0 n=3, day 4 n=6, day 7 n=13, day 9 n=14, day 11 n=14) and Il1rl1fl/fl(grey, day 7 n=8, day 9 n=3, day 11 n=2) controls and Il1rl1fl/flFoxp3YFPCre (blue, day 0 n=4, day 4 n=9, day 7 n=12, day 9 n=11, day 11 n=12) mice. (f) Cytokine and chemokine levels in the BAL of Foxp3YFPCre control (white, n=16) and Il1rl1fl/flFoxp3YFPCre (blue, n=11) mice on day 7 of influenza infection as assessed by Luminex. (g) Representative flow cytometry of ST2 expression of CD45+Lineage-Thy1.2+ innate lymphoid cells (left, numbers indicate percentage of ST2+ cells with STD) and quantification of the total number of CD45+Lineage-Thy1.2+ST2+ ILC2s (right). Foxp3YFPCre (white; n=5) and Il1rl1fl/fl(grey; n=6) controls and Il1rl1fl/flFoxp3YFPCre (blue; n=4) mice. (h) Total number of CD3-NK1.1+ NK cells in the lung on the indicated day of infection. Unless otherwise indicated, data are pooled from 2–3 experiments and each dot represents one mouse. All statistics were calculated by ordinary one-way ANOVA with Tukey’s multiple comparisons except for (a,b) which used an unpaired two-tailed t-test and (h) which was calculated by unpaired t-test with Holm-Sidak adjustment for multiple comparisons. For box and whiskers plots: whiskers are max and min, box 25–75 percentile and line is median. P values as indicated in plots.
Extended Data Figure 4.
Extended Data Figure 4.. Deletion of ST2 in Treg cells increased the innate immune response to influenza and improved viral control.
(a-f) Foxp3ERT2Cre control (light grey) treated with tamoxifen and Il1rl1fl/flFoxp3ERT2Cre (black/blue) treated with oil as another control were compared with Il1rl1fl/flFoxp3ERT2Cre mice (light blue) treated with tamoxifen to specifically delete the Il1rl1 gene in Treg cells. After a 14-day tamoxifen washout, mice were infected with influenza and analyzed on day 7. (a) Representative flow cytometry of ST2 and CXCR3 expression on lung (i.v. Ab-) Treg cells. (b) MFI of ST2 expression on lung Treg cells (i.v. Ab-, CD3+CD4+Foxp3+) (Foxp3ERT2Cre +TAM n=13, Il1rl1fl/flFoxp3ERT2Cre +oil n=12, Il1rl1fl/flFoxp3ERT2Cre +TAM n=13). (c) MFI of ST2 expression on lung eosinophils (i.v.Ab-, SiglecF+, CD11clo) (Foxp3ERT2Cre +TAM n=4, Il1rl1fl/flFoxp3ERT2Cre +oil n=4, Il1rl1fl/flFoxp3ERT2Cre +TAM n=5). (d) MFI of ST2 expression on innate lymphoid cells (CD45+, Lineage-, Thy1.2+)(Foxp3ERT2Cre +TAM n=8, Il1rl1fl/flFoxp3ERT2Cre +oil n=9, Il1rl1fl/flFoxp3ERT2Cre +TAM n=9). (e) The number of neutrophils and eosinophils in the BAL (Foxp3ERT2Cre +TAM n=13, Il1rl1fl/flFoxp3ERT2Cre +oil n=12, Il1rl1fl/flFoxp3ERT2Cre +TAM n=13). (f) The number of lung IL-17+γδ T cells and lung IL-5+ ILC2s as assessed by flow cytometry (Foxp3ERT2Cre +TAM n=9, Il1rl1fl/flFoxp3ERT2Cre +oil n=8, Il1rl1fl/flFoxp3ERT2Cre +TAM n=8). (g) Influenza Polymerase levels as determined by RT-qPCR in the lungs of Foxp3YFPCre controls (white; day 0 n=9, day 4 n=23, day 7 n=24, day 11 n=31), Il1rl1fl/fl (grey; day 7 n=7, day 11 n=4) littermate controls and Il1rl1fl/flFoxp3YFPCre mice (blue; day 0 n=4, day 4 n=16, day 7 n=21, day 11 n=19) infected with 0.3LD50 PR8 influenza. (h) Matrix Protein 1 RNA levels as determined by RT-qPCR in the lungs of Foxp3YFPCre controls (white; day 0 n=3, day 4 n=16, day 7 n=16, day 11 n=23) and Il1rl1fl/flFoxp3YFPCre mice (blue; day 0 n=4, day 4 n=12, day 7 n=12, day 11 n=11) infected with 0.3LD50 PR8 influenza. (i) Weight loss in Foxp3YFPCre (white) controls and Il1rl1fl/flFoxp3YFPCre mice (blue) after influenza infection (Error bars, mean± SEM). Unless otherwise indicated, data are pooled from 2–4 experiments and each dot represents one mouse. Statistics for b-f were calculated by ordinary one-way ANOVA with Tukey’s multiple comparisons. Statistics for g and h were calculated by unpaired t-tests with Holm-Sidak adjustment for multiple comparisons. Statistics for i were calculated by two-way ANOVA with Šídák's multiple comparisons test. For box and whiskers plots: whiskers are max and min, box 25–75 percentile and line is median. P values are indicated in plots.
Extended Data Figure 5.
Extended Data Figure 5.. Deletion of Myd88 in Treg cells phenocopied the immune response to influenza in the Il1rl1fl/flFoxp3YFPCre mice.
(a-i) Foxp3YFPCre controls (white) and myd88fl/flFoxp3YFPCre mice (purple) were infected with 0.3LD50 dose PR8 influenza and harvested on the indicated day post infection. (a) Treg cells and Foxp3 CD4+ T cells were sorted from the lungs on day 7 of infection and Myd88 expression was analyzed by RT-qPCR (Each dot represents the pooled mean of 1 experiment: Foxp3YFPCre n=4, myd88fl/flFoxp3YFPCre n=3). (b) The indicated cell types were sorted from the lungs on day 7 of infection and Myd88 expression was analyzed by RT-qPCR (Each dot represents the pooled mean of 1 experiment: Foxp3YFPCre n=3, myd88fl/flFoxp3YFPCre n=2). (c) Representative flow cytometry of ST2 and CXCR3 expression on lung parenchymal (i.v. Ab) CD3+CD4+Foxp3+ Treg cells on day 7 of influenza infection. (d) Total number of lung parenchymal (i.v. Ab) CD3+CD4+Foxp3+ Treg cells in the indicated strains on the indicated day of influenza infection (left) and the percentage of Treg cells expressing ST2 in the same mice (right) (Foxp3YFPCre, day 0 n=3, day 4 n=11, day 7 n=10, day 9 n=6; myd88fl/flFoxp3YFPCre, day 0 n=6, day 4 n=11, day 7 n=8, day 9 n=5). (e-f) Representative flow cytometry (left) and number (right) of CD11cSiglecFCD11b+CD64LygG+ neutrophils (e) and SiglecF+CD11clo eosinophils (f) in the BAL on the indicated day of infection (Foxp3YFPCre, day 0 n=5, day 4 n=8, day 7 n=5, day 9 n=4, day 11 n=6; myd88fl/flFoxp3YFPCre, day 0 n=6, day 4 n=11, day 7 n=9, day 9 n=4, day 11 n=6). (g-i) Representative flow cytometry at day 7 (left) and total number on the indicated day of infection (right) of IL-17+ γδ T cells in the lungs (g) on the indicated day of infection. (h-i) Number of IFNγ+CD4+ T cells (h) and IFNγ+CD8+ T cells (i) in the lungs of the indicated Foxp3YFPCre control and Myd88fl/flFoxp3YFPCre mice on the indicated day of influenza infection(Foxp3YFPCre, day 0 n=4, day 4 n=11, day 7 n=5, day 9 n=10; myd88fl/flFoxp3YFPCre, day 0 n=6, day 4 n=11, day 7 n=5, day 9 n=10). Unless otherwise indicated, data are pooled from 2–3 experiments and each dot represents one mouse, except for a,b where each dot represents the mean value from an individual experiment. Statistics for (a) were calculated by an unpaired two-tailed t-test. Statistics for (b-i) were calculated by unpaired t-test with Holm-Sidak adjustment for multiple comparisons. For box and whiskers plots: whiskers are max and min, box 25–75 percentile and line is median. P values are indicated in plots.
Extended Data 6.
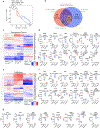
Extended Data 6.. Distinct gene expression patterns in ST2+ and CXCR3+ Treg cells in the lung of influenza infected mice.
(a-g) Bulk RNAseq was performed on spleen Treg cells from uninfected mice (black) and on sorted ST2+ (blue) and CXCR3+ (red) Treg cells isolated from the pooled lungs of Foxp3YFPCre mice on day 7 of influenza infection and performed in 3 independent experiments (n=3). (a) Principal component analysis of the different Treg cell populations. (b) Venn diagram of differentially expressed genes in the ST2+ and CXCR3+ Treg subsets compared to each other and to naïve total spleen Treg cells. (c) Heat map of selected transcription factor expression in the indicated Treg cell populations performed in triplicate. (d) Transcription factor RNA levels in the indicated cell populations: As above, spleen Treg cells from uninfected mice (spleen), sorted ST2+ Treg cells (ST2+) and CXCR3+ Treg cells (CXCR3+) isolated from the lungs of pooled Foxp3YFPCre mice on day 7 of influenza infection. (e) Heat map of selected trafficking gene expression in the indicated Treg cell populations. (f) Selected trafficking gene RNA expression levels in the indicated Treg cell populations. (g) Selected Treg cell effector gene RNA expression levels in the indicated Treg cell populations. Floating bars: min to max, line median. All statistics were calculated by unpaired two tailed t-test. P values indicated in figure.
Extended Data 7.
Extended Data 7.. IL-1Ra is a critical mediator of inflammatory responses to influenza.
(a-k) Il1rn+/+ littermate controls (white circles, n=8) and Il1rn–/– mice (yellow circles, n=7) were infected with influenza and harvested on day 7. (a-b) The percentage (left) and number (right) of CD11b+Ly6G+ neutrophils in the lung parenchyma (a) and BAL (b). (c) RNA levels of Cxcl5 relative to β2M in the lungs on day 7 of infection as determined by RT-qPCR. (d-e) The percentage (left) and number (right) of SiglecF+CD11clo eosinophils in the lung parenchyma (d) and BAL (e). (f) Percentage (left) and number (right) of IL-17-producing γδT cells in the lung as assessed by ICS staining on day 7 of infection. (g-h) Percentage and number of CD4+ T cells (g) and CD8+ T cells (h) in the lung that were positive for IFNγ and IL-17 expression as assessed by ICS. (i-k) Percentage and number of CD4+Foxp3+ Treg cells in the lung parenchyma was determined (i) as well as the percentage and number of Treg cells that expressed ST2 (j). (k) Influenza Nucleoprotein (left) and Polymerase (right) RNA levels in the lungs on day 7 of influenza infection. (l) Survival of the indicated strains after 0.3LD50 dose influenza. Unless otherwise indicated, data are pooled from 2–3 experiments and each dot represents one mouse. All statistics were calculated by unpaired two-tailed t-test except the survival experiment (l) which was assessed by Log-Rank (Mantel-Cox) test. Box and whiskers plots: whiskers are max and min, box 25–75 percentile and line is median. P values are indicated in plots.
Extended Data 8.
Extended Data 8.. Deletion of Il1rn in Treg cells affected the innate but not adaptive response to influenza.
(a-g) Foxp3YFPCre controls (white) and Il1rnfl/fl (grey) littermate controls and Il1rnfl/flFoxp3YFPCre (orange) mice were infected with 0.3LD50 PR8 influenza and harvested on the indicated day post infection. (a-b) Representative flow cytometry of the percentage of CD11b+Ly6G+ neutrophils (a) and SiglecF+CD11clo eosinophils (b) compared to total viable cells (left) and total number of neutrophils (right) in the BAL in Foxp3YFPCre controls (white, day 0 n=6, day 5 n=7, day 7 n=20, day 9 n=16) and Il1rnfl/fl (grey, day 0 n=8, day 5 n=10, day 7 n=14, day 9 n=6) littermate controls and Il1rnfl/flFoxp3YFPCre (orange, day 0 n=7, day 5 n=9, day 7 n=12, day 9 n=11) mice on day 7 of infection. (c) Representative flow cytometry of the percentage of IL-17+ γδ T cells (right) and total number of IL-17+ γδ T cells (left) in the lung of Foxp3YFPCre controls (n=7) and Il1rnfl/fl (grey, n=10) littermate controls and Il1rnfl/flFoxp3YFPCre (orange, n=9) mice on day 5 of influenza as determined by ICS. (d) Number of IFNγ+CD4+ T cells (left) and IFNγ+CD8+ T cells (right) in the lung as assessed by ICS in Foxp3YFPCre controls (white, n=8) and Il1rnfl/flFoxp3YFPCre (orange, n=8) mice on day 7 of infection. (e-f) Percentage (left) and number (right) of total CD4+Foxp3+ Treg cells (e) and ST2+ Treg cells (f) in the lung parenchyma assessed by flow cytometry in Foxp3YFPCre controls (white, n=14) and Il1rnfl/flFoxp3YFPCre (orange, n=11) mice on day 7 of infection. (g) Influenza NP RNA levels in the lungs determined by RT-qPCR on day 7 of influenza infection in Foxp3YFPCre controls (white, n=10) and Il1rnfl/flFoxp3YFPCre (orange, n=12) mice were infected with 0.3LD50 PR8 influenza. (h) The number of neutrophils (left) and eosinophils (right) in the BAL on day 7 of 0.3LD50 dose PR8 influenza infection of Il1rnfl/flFoxp3ERT2Cre mice treated with either tamoxifen (maroon, n=10) or oil as indicated (grey, n=9). (i) mRNA levels of Il1rn in the indicated cell types sorted from the lungs of Il1rnfl/fl littermate controls (grey, n=3) and Il1rnfl/flFoxp3YFPCre (orange, n=2) infected with 0.3LD50 dose PR8 influenza. (j) mRNA levels of Il1rn in the indicated cell types sorted from the lungs of day 7 infected Il1rnfl/fl littermate controls (grey, n=3) and Il1rnfl/flLysMCre (purple, n=3) infected with 0.3LD50 dose PR8 influenza. (k) Foxp3YFPCre controls (white, n=14), Il1rl1fl/fl littermate controls (gray, n=9) and Il1rl1lfl/flFoxp3YFPCre (blue n=7) mice were infected with 0.3LD50 dose PR8 influenza and administered i.p. and i.n. PBS diluent and another group of Il1rl1lfl/flFoxp3YFPCre mice were treated with i.p. and i.n. IL-1Ra (blue/orange, n=5) and harvested on day 5 post infection to determine the total number (top) and percentage (bottom) of neutrophils in the BAL. Unless otherwise indicated, data are pooled from 2–3 experiments. Each dot represents one mouse, except for experiments i and j where each dot represents the pooled mean from an experiment. Statistics for (a-b) were calculated by unpaired t-test with Holm-Sidak adjustment for multiple comparisons. Statistics for (d-f, h, j) were calculated by unpaired Student’s t-test. Statistics for (c, g, k) were calculated by ordinary one-way ANOVA with Tukey’s multiple comparisons. i was calculated by two-way ANOVA with Šídák's multiple comparisons test. Column Plots: mean with Standard Deviation. Box and whiskers plots: whiskers are max and min, box 25–75 percentile and line is median. P values are indicated in plots.
Extended Data 9.
Extended Data 9.. IL-1 may mediate innate inflammatory responses to influenza via IL-1R1-expressing fibroblasts.
(a-b) Il1rl1fl/flFoxp3YFPCre (blue circles day 5 n=7, day 7 n=9, day 9 n=13, day 11 n=3), Il1rl1fl/flFoxp3YFPCreIl1a/b-/- (blue and olive circles, day 5 n=11, day 7 n=7, day 9 n=9, day 11 n=4), and Il1a/b-/- (olive circles, day 5 n=6, day 7 n=5, day 9 n=3, day 11 n=3) and Foxp3YFPCre control (white circles, day 5 n=7, day 7 n=14, day 9 n=16, day 11 n=5) mice were infected with 0.3LD50 dose PR8 influenza. (a) Total number of CD11b+Ly6G+ neutrophils in the BAL on the indicated day. (b) Total number of SiglecF+CD11clo eosinophils in the BAL on the indicated day. (c) Total number of IL-17+ γδ T cells in the lungs on day 5 of influenza infection (Foxp3YFPCre n=7, Il1rl1fl/flFoxp3YFPCre n=7, Il1rl1fl/flFoxp3YFPCreIl1a/b-/- n=9). (d) Representative flow cytometry (left) and total number (right) of IL-5+- and IL 13-producing ILC2s (CD45+Thy1.2+Lin-CD3-CD4-ST2+) in the lungs on day 7 of influenza infection (Foxp3YFPCre n=6, Il1rl1fl/fl n=8, Il1rl1fl/flFoxp3YFPCre n=5, Il1rl1fl/flFoxp3YFPCreIl1a/b-/- n=6, and Il1a/b-/- n=5). (e) Influenza NP RNA levels (copies per ng RNA) in the lungs on day 7 of influenza infection (n=5–20 mice per group as represented by dots). (f) Bubble plot of the indicated gene expression of reanalyzed scRNA-Seq dataset clusters from CD45- lung mesenchymal cells derived from Dalghren et al. (GEO accession GSE125492) and Tsukui et al. (GEO accession GSE132771) from the indicated cell clusters shown in Figure 8d. (g) Cell sorting strategy to isolate lung CD45-CD31-EpCAM+ epithelial cells, CD45-EpCAM-CD31+ endothelial cells, CD45-PDGFRa+PDPN+Ly6C-Sca1- fibroblasts and CD45-PDGFRa+PDPN+Ly6C+Sca1+ adventitial fibroblasts. (h) Representative expression and Geometric mean MFI of IL-1R1 expression on CD45-EpCAM-CD31+ endothelial cells, CD45-CD31-EpCAM+ epithelial cells and CD45-PDGFRa+PDPN+ fibroblasts isolated from the lungs of naïve mice (n=4 in this representative experiment of 2 performed). (i) Fibroblasts were isolated from the lungs of naïve mice and stimulated with either control media or 10ng/ml IL-1βfor 6hrs and then the expression of the indicated genes were analyzed using RT-qPCR (replicates, n=4). Unless otherwise indicated, data are pooled from 2–3 experiments. For a-e and h each dot represents one mouse. Statistics for (a-b) were calculated by unpaired t-test with Holm-Sidak adjustment for multiple comparisons. Statistics for (c-e, h) were calculated by ordinary one-way ANOVA with Tukey’s multiple comparisons. (i) was calculated by unpaired students t-test. Column Plots: mean with Standard Deviation. Box and whiskers plots: whiskers are max and min, box 25–75 percentile and line is median. P values are indicated in plots.
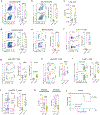
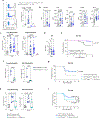
Figure 1.
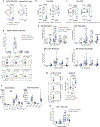
Figure 1.. Early deletion of Treg cells during influenza increased lung granulocytes and improved survival.
(a-f) WT (C57BL/6J) control (white circles), Foxp3ERT2Cre control (grey circles) and Foxp3DTR mice (green circles) were infected with influenza. All strains were treated with diphtheria toxin (DT) on day 2 post-infection to deplete Treg cells in the Foxp3DTR mice and were harvested on day 5 (WT n=9, Foxp3ERT2Cre n=10, Foxp3DTR n=16), 7 (WT n=11, Foxp3ERT2Cre n=11, Foxp3DTR n=8), and 10 (WT n=10, Foxp3ERT2Cre n=9, Foxp3DTR n=5) post-infection. DT treated mice without infection (indicated by ) and harvested on day 5 were included as additional controls (WT n=7, Foxp3ERT2Cre n=4, Foxp3DTR n=4). (a) Schematic of experimental outline. (b) Representative flow cytometry (left) and total number (right) of i.v. Ab CD4+ Foxp3+ Treg cells in the lung parenchyma on the indicated day of infection. (c-d) Representative flow cytometry of the percentage of neutrophils (i.v. Ab CD11b+Ly6G+) (left) and the total number of neutrophils (i.v. Ab CD11c-SiglecF-CD64-F4/80-CD11b+Ly6G+) (right) in the lung parenchyma (c) and BAL (d). The mean percentage ± SD of cells for all mice studied is indicated within the flow plots. (e-f) Representative flow cytometry of the percentage and total number of eosinophils (i.v. AbSiglecF+CD11clo) in the lung parenchyma (e) and BAL (f). The mean percentage ± SD of cells for all mice studied is indicated within the flow plots. (g) Survival of WT control (black) and Foxp3DTR (green) mice infected with an LD50 dose of PR8 influenza and given one dose of DT on the day of infection. (h) Total number of neutrophils (CD11c-SiglecF-CD64-F4/80-CD11b+GR-1+) in the lung parenchyma and BAL on day 5 in Foxp3ERT2Cre control mice treated with 100μg isotype control IgG (grey, n=8) and Foxp3DTR mice treated with either 100μg of 1A8 antibody (green, black hash, n=7) or IgG control (green, n=6) on days -1, +1, and +3. All mice were infected with an LD50 dose of PR8 influenza and treated with DT on day 2. (i) Survival after an LD50 dose of PR8 influenza. All groups (Foxp3ERT2Cre controls and Foxp3DTR mice) received DT on day 2 of infection. On days -1,+1, +3, +5 of infection a group of Foxp3DTR mice were treated with 100μg 1A8 antibody while the remaining mice were treated with 100μg isotype IgG control. Unless otherwise indicated, data are pooled from 2–3 experiments and each dot represents one mouse. Statistics for (b-f) and (h) were calculated by ordinary one-way ANOVA with Tukey’s multiple comparisons test for each time point. Statistical significance for the survival experiments (g, i) was assessed by Log-Rank (Mantel-Cox) test. Data presented in box and whiskers plots: whiskers are max and min, box 25–75 percentile and line is median. P values shown in plots.
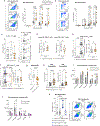
Figure 2.
Figure 2.. ST2 is expressed on a population of Treg cells in the lung early during influenza infection.
(a-d) Foxp3YFPCre mice were infected with influenza and lungs were harvested for analysis at the indicated time points post infection. (a) Representative flow cytometry of ST2 (blue) and CXCR3 (red) expression on intraparenchymal i.v. Ab,CD3+CD4+Foxp3+ Treg cells (left). Quantification of the total number (top) and percentage (bottom) of Treg cells expressing ST2 (blue) and CXCR3 (red) and neither marker (ST2-CXCR3-, grey) or both markers (ST2+CXCR3+, white) in the lung parenchyma (Representative experiment of 2 performed, day 0: n=6, day 4: n=4, day 7: n=5, day 11: n=5). (b) Representative histogram of GATA3 and T-bet expression as assessed by flow cytometry in ST2+ (blue), CXCR3+ (red), or ST2-CXCR3- (black) Treg cells, FMO staining control is in grey. (c) Levels of Gata3, Tbx21, Rorc mRNA determined by RT-qPCR in the indicated ST2+ (blue), CXCR3+ (red), or ST2-CXCR3- (grey) Treg cell populations sorted from the lungs of day 7 infected mice. Experiment was performed 3 times with pooled samples and each dot represents the mean data from one experiment. (d) Representative histogram (left) and percent cells positive for CD69 expression (right) as assessed by flow cytometry in ST2+ (blue), CXCR3+ (red), and ST2-CXCR3- (grey) Treg cells isolated from the lung on day 5 of influenza infection (Representative experiment of 2 performed, n=5). (e) Representative histogram (left) and percent cells positive for Ki-67 expression (right) as assessed by flow cytometry in ST2+ (blue), CXCR3+ (red), and ST2-CXCR3- (grey) Treg cells isolated from the lung of day 5 influenza infection (Representative experiment of 2 performed, n=4). (f) Representative flow cytometry (left) and cell numbers (right) of ST2+ (blue), CXCR3+ (red), and ST2-CXCR3- (grey) Treg cells that are positive for I-A(b) NP311–325+ tetramer staining (n=7). Unless otherwise indicated, data are pooled from 2–3 experiments and each dot represents one mouse. All statistics were calculated by ordinary one-way ANOVA with Tukey’s multiple comparisons. Column plots: Error bars, mean ± SD, Box and whisker plots: whiskers are max and min, box 25–75 percentile and line is median. P values shown in plots.
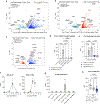
Figure 3.
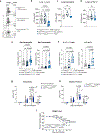
Figure 3.. Deletion of ST2 on Treg cells increased innate immune responses in the lung to influenza.
(a-d) Foxp3YFPCre controls (white) and Il1rl1fl/fl littermate controls (grey) and Il1rl1fl/flFoxp3YFPCre mice (blue) were infected influenza and harvested on the indicated day post infection. (a) Representative flow cytometry of Foxp3 and ST2 on i.v.Ab-CD3+CD4+ T cells in the lung parenchyma, demonstrating specific ST2 deletion on Foxp3+ Treg cells in Il1rl1fl/flFoxp3YFPCre mice on day 7 of infection. (b) Total number of CD3+CD4+Foxp3+ Treg cells in the lung parenchyma on day 0 (Foxp3YFPCre n=3; Il1rl1fl/flFoxp3YFPCre n =4), 4 (Foxp3YFPCre n=7; Il1rl1fl/flFoxp3YFPCre n =9), 7 (Il1rl1fl/fl n= 5; Foxp3YFPCre n=14; Il1rl1fl/flFoxp3YFPCre n =12), 9 (Il1rl1fl/fl n= 3; Foxp3YFPCre n=16; Il1rl1fl/flFoxp3YFPCre n =13) and 11 (Il1rl1fl/fl n= 3; Foxp3YFPCre n=13; Il1rl1fl/flFoxp3YFPCre n =12) post-infection. (c-d) Total number of SiglecF-CD11c-CD11b+CD64-F4/80-Ly6G+ neutrophils (c)and SiglecF+CD11clo eosinophils (d) in the lung parenchyma on day 0 (Foxp3YFPCre n=3; Il1rl1fl/flFoxp3YFPCre n =4), 4 (Foxp3YFPCre n=7; Il1rl1fl/flFoxp3YFPCre n =9), 7 (Il1rl1fl/fl n= 7; Foxp3YFPCre n=13; Il1rl1fl/flFoxp3YFPCre n =12), 9 (Il1rl1fl/fl n= 2; Foxp3YFPCre n=14; Il1rl1fl/flFoxp3YFPCre n =11) and 11 (Il1rl1fl/fl n= 2; Foxp3YFPCre n=15; Il1rl1fl/flFoxp3YFPCre n =12) post-infection. (e) Foxp3ERT2Cre control mice treated with tamoxifen (light grey, n=13), Il1rl1fl/fl Foxp3ERT2Cre mice treated with oil (black and blue, n= 12) and Il1rl1fl/fl Foxp3ERT2Cre mice treated with tamoxifen (light blue, n=12) were infected with influenza 2 weeks after tamoxifen washout and the number of neutrophils (left) and eosinophils (right) in the lung parenchyma was assessed on day 7 of infection. (f) Levels of the indicated cytokines and chemokines were assessed in the BAL on day 7 of influenza infection by Luminex (Foxp3YFPcre n=19, Il1rl1fl/flFoxp3YFPCre n=14) or ELISA for CXCL5 (Foxp3YFPcre n=10, Il1rl1fl/flFoxp3YFPCre n=7). (g) Representative flow cytometry (left) and quantification of the total number (right) of IL-17-producing γδ T cells and CD4+ T cells in the lung on day 5 of influenza infection in Foxp3YFPcre (n=7) and Il1rl1fl/flFoxp3YFPCre (n=5) mice. (h) Representative flow cytometry (left) and total number (right) of IL-5 and IL-13 producing ILC2s (CD45+lineage-CD3-CD4-Thy1.2+ST2+) and CD4+ T cells in the lungs of day 7 influenza infected mice (Il1rl1fl/fl n= 6; Il1rl1fl/flFoxp3YFPCre n =4). (i-j) Representative flow plots for IFNγ and IL-17 ICS and total number of IFNγ positive CD3+CD4+ T cells (i) and IFNγ positive CD3+CD8+ T cells (j), on day 0 (Foxp3YFPCre n=3; Il1rl1fl/flFoxp3YFPCre n =4), 4 (Foxp3YFPCre n=17; Il1rl1fl/flFoxp3YFPCre n =14), 7 (Foxp3YFPCre n=10; Il1rl1fl/flFoxp3YFPCre n =11), and 11 (Foxp3YFPCre n=9; Il1rl1fl/flFoxp3YFPCre n =9) post-infection. Unless otherwise indicated, data are pooled from 2–3 experiments and each dot represents one mouse. Statistical significance assessed by unpaired Student’s t-tests with Holm-Sidak adjustment for multiple comparisons for (b, c, d, i, and j). Ordinary one-way ANOVA with Tukey’s multiple comparisons was performed for (e, g, and h). Students unpaired t-test was performed on (f). Box and whisker plots: whiskers are max and min, box 25–75 percentile and line is median. P values shown in plots.
Figure 4.
Figure 4.. Deletion of ST2 on Treg cells improved viral control and survival to influenza.
(a) Influenza nucleoprotein (NP) RNA levels determined by RT-qPCR in the lungs on the indicated day of influenza infection in Foxp3YFPCre control (white circles; day 0 n=7, day 4 n=23, day 7 n=14, day 11 n=19) and Il1rl1fl/fl (grey circles; day 7 n=7, day 11 n=4) control mice compared with Il1rl1fl/flFoxp3YFPCre (blue circles; day 0 n=4, day 4 n=15, day 7 n=16, day 11 n=19) mice. (b) Influenza NP and NS1 RNA levels as determined by RT-qPCR in the lungs on day 7 of infection in Foxp3ERT2Cre control (n=12) and Il1rl1fl/fl Foxp3ERT2Cre mice (n=14) treated with tamoxifen 2 weeks prior to infection. (c) Survival of Foxp3YFPCre controls (black) and Il1rl1fl/fl littermate controls (gray, dashed) and Il1rl1fl/flFoxp3YFPCre (blue, dashed) mice infected with LD50 dose of PR8 influenza. (d) Foxp3+ Treg cells were sorted from the lungs of day 7 infected Foxp3YFPCre (white circles, n=4) and Il1rl1fl/flFoxp3YFPCre (blue circles, n=3) mice and analyzed for Areg RNA expression by RT-qPCR (n=mean of 1 independent experiment). (e) RNA was harvested from the lung of Foxp3YFPCre control (white circles, n=13) and Il1rl1fl/flFoxp3YFPCre (blue circles, n=13) mice infected with influenza and analyzed for total lung mRNA expression of Areg. (f) Representative H&E stains of lungs from control mice and Il1rl1fl/flFoxp3YFPCre mice infected with influenza. (g) Blinded pathologist review of the extent of inflammation scores in the lungs of control mice (Il1rl1fl/fl and Foxp3YFPCre, white circles; day 0 n=5, day 4 n=9, day 7 n=6, n=11) and Il1rl1fl/flFoxp3YFPCre mice (blue circles; day 0 n=6, day 4 n=4, day 7 n=3, n=6) infected with influenza. Unless otherwise indicated, data are pooled from 2–3 experiments and each dot represents one mouse. Statistical significance assessed by unpaired Student’s t-tests with Holm-Sidak adjustment for multiple comparisons for (a). Unpaired students t-test was performed on (b, d, e and g). Survival (c) was assessed by Log-Rank (Mantel-Cox) test. Box and whisker plots: whiskers are max and min, box 25–75 percentile and line is median. P values shown in plots.
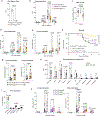
Figure 5.
Figure 5.. Neutrophils mediated improved survival in influenza-infected Il1rl1fl/flFoxp3YFPCre mice.
(a-d) Foxp3YFPCre control (white), Il1rl1fl/flFoxp3YFPCre mice (blue), Il1rl1fl/flFoxp3YFPCreTcrd-/- (blue/pink) and Tcrd-/- (pink) mice were infected with influenza and harvested on the indicated day post infection. (a) Representative flow cytometry (left) and total number (right) of CD3+ γδ T cells in the lung on day 7 of infection in Foxp3YFPCre (n=15), Il1rl1fl/flFoxp3YFPCre (n=16), Il1rl1fl/flFoxp3YFPCreTcrd-/- (n=17) and Tcrd-/- (n=4) mice. (b) Cytokine levels for IL-17a, Il-5, IL-13, IL-33, and IL-1β in the BAL on day 7 of infection in Foxp3YFPCre (n=15), Il1rl1fl/flFoxp3YFPCre (n=11), and Il1rl1fl/flFoxp3YFPCreTcrd-/- (n=8) mice. (c) Total number of neutrophils (left) and eosinophils (right) in the lung on day 7 of infection in the indicated strains in Foxp3YFPCre (n=15), Il1rl1fl/flFoxp3YFPCre (n=16), Il1rl1fl/flFoxp3YFPCreTcrd-/- (n=17) and Tcrd-/- (n=4) mice. (d) RT-qPCR for the influenza NP gene on day 7 of influenza infection in in Foxp3YFPCre (n=10), Il1rl1fl/flFoxp3YFPCre (n=8), and Il1rl1fl/flFoxp3YFPCreTcrd-/- (n=12). I Survival after LD50 PR8 influenza infection in the indicated strains. (f) Il1rl1fl/flFoxp3YFPCre mice were infected with influenza and treated with 100μg IgG control (blue, n=3) or 100μg of the TRFK5 anti-IL-5 antibody (forest green, n=4) on days 4–8 of infection and the number of eosinophils in the lung and BAL were assessed by flow cytometry on day 8. (g) Il1rl1fl/flFoxp3YFPCre and Il1rl1fl/fl control mice were infected with LD50 dose PR8 influenza and treated with either anti-IL-5 antibody or IgG control on days 4–10 as indicated and survival was monitored. (h) The number of neutrophils (CD11c-SiglecF-CD64-F4/80-CD11b+GR-1+) was enumerated in the lung parenchyma and BAL on day 4 of LD50 PR8 infection of Il1rl1fl/fl control mice treated with 100μg of isotype control IgG (grey, n=5) or Il1rl1fl/flFoxp3YFPCre treated with either 100μg of anti-Ly6G antibody 1A8 (blue, n=5) or IgG control (teal, n=5) on day -1, +1, +3. (i) Il1rl1fl/flFoxp3YFPCre and Il1rl1fl/fl control mice were infected with LD50 dose PR8 influenza and treated with either 100μg of the anti-Ly6G antibody 1A8 or isotype IgG control on day -1, +1, +3, +5 of infection and survival was monitored. Unless otherwise indicated, data are pooled from 2–3 experiments and each dot represents one mouse. Statistical significance assessed by ordinary one-way ANOVA with Tukey’s multiple comparisons except for (f), which was assessed by Student’s unpaired t-test, and (e, g, i), which was assessed by Log-Rank (Mantel-Cox) test. Box and whisker plots: whiskers are max and min, box 25–75 percentile and line is median. P values shown in plots.
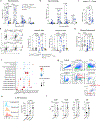
Figure 6.
Figure 6.. Treg cells produce IL-1Ra in response to IL-33-induced ST2 signaling.
(a-c) CD3+CD4+Foxp3YFP+ Treg cells were sorted from spleens of naïve Foxp3YFPCre mice and CD3+CD4+Foxp3YFP+ Treg cells expressing ST2 (blue) or CXCR3 (red) were sorted from the lungs of Foxp3YFPCre mice (pooled from up to 10 mice) on day 7 of 0.3LD50 PR8 influenza infection for transcriptome analysis by RNAseq. (a) Volcano plot comparing gene expression in splenic Treg cells from naïve mice versus lung ST2+ Treg cells from day 7 influenza infected mice. Significant differential gene expression [<0.05 log2 false discovery rate (FDR) cutoff] between ST2+ [positive log2 fold change (FC)] and splenic Treg cells (negative log2 FC) Tregs are depicted in blue and aqua, respectively. Highlighted genes have been associated with Treg or lymphocyte function. Data are pooled from 3 independent experiments. (b) Volcano plot comparing gene expression in splenic Treg cells from naïve mice versus lung CXCR3+ Treg cells from day 7 influenza infected mice. Significant differential gene expression [<0.05 log2 false discovery rate (FDR) cutoff] between ST2+ [positive log2 fold change (FC)] and splenic Treg cells (negative log2 FC) Tregs are depicted in blue and aqua, respectively. Data are pooled from 3 independent experiments. (c) Volcano plot comparing gene expression in ST2+ Treg cells and CXCR3+ Treg cells from the lungs of day 7 infected mice. Significant differential gene expression [<0.05 log2 false discovery rate (FDR) cutoff] between ST2+ [positive log2 fold change (FC)] and CXCR3+ (negative log2 FC) Tregs are depicted in blue and red, respectively. Data are pooled from 3 independent experiments. (d) Il1rn mRNA levels measured by RT-qPCR in the indicated sorted T cell population from the lungs and spleens of day 7 influenza infected Foxp3YFPCre control mice (white) and Myd88fl/flFoxp3YFPCre mice (purple). Each dot represents the mean of one experiment performed in triplicate from a pooled sample of up to 10 mice (n=2–3 independent experiments). (e) Il1rn mRNA levels measured by RT-qPCR in sort total Treg cells isolated from the lungs of Foxp3YFPCre control (white), Il1rl1fl/flFoxp3YFPCre (blue), and Myd88fl/flFoxp3YFPCre mice (purple) on the indicated day post infection with 0.3LD50 influenza. Each dot represents the mean of one experiment performed in triplicate from a pooled sample of 2 to 4 mice (n=2–3 independent experiments). (f) Time course of IL-33 levels in the BAL as measure by Luminex assay (left, n=3–4 per day) and IL-1Ra in the BAL as measured by ELISA (right, day 0 n=4, day 3 n=3, day 5 n=4, day 7 n=9, day 9 n=11) on the indicated day of influenza infection in control Foxp3YFPcre mice. (g) IL-1ra protein secretion from Treg cells. ST2+, CXCR3+ and ST2-CXCR3- Treg cells (CD4+Foxp3YFP+) were sorted from pooled spleens of 10–15 naïve Foxp3YFPCre mice that had been treated with IL-33 to expand the number of ST2+ Treg cells. Sorted cells were then stimulated ex vivo with IL-2/IL-7 alone or with IL-33 and IL-2/IL-7 and the production of IL-1Ra in the supernatant was measured by ELISA after 72 hrs. Each dot represents the mean of one experiment, n=3. ND = none detected. (h) Il1rn mRNA levels measured by RT-qPCR in the lung on day 7 of influenza infection in Il1rl1fl/fl control (grey, n=7), Foxp3YFPCre control (white, n=18) and Il1rl1fl/flFoxp3YFPCre mice (blue, n=13). Unless otherwise indicated, data are pooled from 2–3 experiments. In (d, e and g) each dot represents the mean of an experiment. Statistical significance for (d, e, h) assessed by one-way ANOVA with Tukey’s multiple comparisons. Column Plots: mean with Standard Deviation. Line Plots: mean with Standard Deviation. Box and whisker plots: whiskers are max and min, box 25–75 percentile and line is median. P values shown in plots.
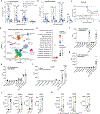
Figure 7.
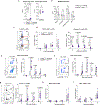
Figure 7.. Deletion of IL-1Ra in Treg cells increased innate immunity to influenza.
(a-e) Il1rnfl/flFoxp3YFPCre mice (orange circles) with a conditional deletion of Il1rn in Treg cells were infected with 0.3LD50 PR8 influenza and compared to both Foxp3YFPCre control mice (white circles) and Il1rnfl/fl littermate control mice (gray circles). (a) Il1rn mRNA levels in Treg cells sorted from day 7 infected Il1rnfl/flFoxp3YFPCre mice (orange circles, n=2) compared to Foxp3YFPCre control mice (white circles, n=3) as assessed by RT-qPCR. (b) Total lung Il1rn mRNA levels measured by RT-qPCR on the indicated day of influenza infection (Il1rnfl/fl day 0 n=8, day 5 n=10, day 7 n=6, day 9 n=6; Foxp3YFPCre, day 0 n=14, day 5 n=5, day 7 n=15, day 9 n=10; Il1rnfl/flFoxp3YFPCre, day 0 n=7, day 5 n=8, day 7 n=12, day 9 n=6). (c) IL-1Ra BAL protein levels measured by ELISA on day 5 of infection (Il1rnfl/fl n=5; Foxp3YFPCre n=10; Il1rnfl/flFoxp3YFPCre n=9). (d-e) Number of SiglecF-CD11c-CD11b+CD64-F4/80-Ly6G+ neutrophils (D) and +CD11clo eosinophils (E) in the lung parenchyma (Il1rnfl/fl day 0 n=8, day 5 n=10, day 7 n=11, day 9 n=5; Foxp3YFPCre, day 0 n=6, day 5 n=7, day 7 n=20, day 9 n=15; Il1rnfl/flFoxp3YFPCre, day 0 n=7, day 5 n=9, day 7 n=11, day 9 n=11). (f) Survival of Foxp3YFPCre controls (black), Il1rnfl/fl littermate controls (gray, dashed) and Il1rnfl/flFoxp3YFPCre (orange) mice infected with LD50 dose PR8 influenza. (g) Il1rnfl/flFoxp3ERT2Cre mice were treated with tamoxifen (maroon, n=10) for 5 days to delete Il1rn in Treg cells or oil (grey, n=9) as a control and after14 day tamoxifen washout were infected with influenza. On day 7 post-infection the number of neutrophils (left) and eosinophils (right) in the lung was quantified by flow cytometry. (h-i) The indicated cell populations were sorted from the lungs of naïve mice or on day 7 of infection and analyzed by RT-qPCR for il1rn expression (h) and fold upregulation between day 0 (n=2–3) and day 7 (n=3–4) indicated (i). ST2+ Treg cell data was previously shown in Figure 6d and was included as a comparison. (j) Lung (left) and BAL (right) neutrophil numbers after infection of Il1rnfl/fl littermate control mice (gray circles, day 0 n=5, day 4 n=27, day 7 n=14, day 11 n=8), Il1rnfl/flLysMCre mice (pink circles, day 0 n=4, day 4 n=12, day 7 n=10, day 11 n=12), and Il1rnfl/flFoxp3YFPCre mice (orange circles, day 4 n=9, day 7 n=11, day 11 n=3) with influenza. Unless otherwise indicated, data are pooled from 2–3 experiments. For experiments b-e, g and j and each dot represents one mouse, while for a, h and i each dot represents the mean of one experiment. For statistical significance: (a, g) were assessed by unpaired Student’s t-test. (b,d,e, j) were assessed by unpaired t-tests with Holm-Sidak adjustment for multiple comparisons, (c, i) were calculated by Ordinary one-way ANOVA with Tukey’s multiple comparisons, (h) was calculated by two-way ANOVA with Šídák's multiple comparisons test and the survival experiment in (f) was assessed by Log-Rank (Mantel-Cox) test. Column Plots: mean with Standard Deviation. Box and whisker plots: whiskers are max and min, box 25–75 percentile and line is median. P values shown in plots.
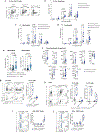
Figure 8.
Figure 8.. Adventitial fibroblasts express high levels of IL-1R1 and are suppressed by Treg cell produced IL-1Ra.
(a-b) Il1rl1fl/flFoxp3YFPCre (blue circles, day 5 n=7, day 7 n=7, day 9 n=11, day 11 n=3), Il1rl1fl/flFoxp3YFPCreIl1a/b-/- (blue and olive circles, day 5 n=9, day 7 n=5, day 9 n=8, day 11 n=4), and Il1a/b-/- (olive circles, day 5 n=4, day 7 n=4, day 9 n=3, day 11 n=3) as well as control Foxp3YFPCre (white circles, day 5 n=7, day 7 n=11, day 9 n=16, day 11 n=5) mice were infected with 0.3LD50 dose PR8 influenza and harvested for analysis. (a) Total number of CD11b+Ly6G+ neutrophils in the lung. (b) Total number of SiglecF+CD11clo eosinophils in the lung. (c) Survival of Foxp3YFPCre controls (black), Il1r1lfl/flFoxp3YFPCre (blue) and Il1r1lfl/flFoxp3YFPCreIl1a/b-/- (blue and olive hashes) mice infected with LD50 dose of PR8 influenza. (d,e) UMAP visualization (d) of reanalyzed scRNA-Seq dataset clusters from CD45- lung mesenchymal cells derived from naïve mice in Dalghren et al. (GEO accession GSE125492) and Tsukui et al. (GEO accession GSE132771) and bubble plot of Il1rl1, Il33 and Ccl11 expression in the different cell clusters (E). (f-h) mRNA expression of Il33 (f), Ccl11 (g) and Il1r1 (h) as assessed by RT-qPCR in the indicated cell populations sorted from the lungs of naïve mice (each dot is the mean of 1 sort experiment n=3–8 per cell type). (i) mRNA expression of Cxcl5 in the indicated cell populations sorted from naive or day 7 PR8 influenza infected mice (each dot is the mean of 1 sort experiment n=3–6 per cell type). (j) Lung fibroblasts were stimulated with 10ng/ml of IL-1βfor 24hrs and the production of indicated chemokine or cytokine (n=4 for each group). (k) Ly6C+Sca1+ Fibroblasts were isolated from Il1rnfl/fl littermate control mice (gray circles) and Il1rnfl/flFoxp3YFPCre mice (orange circles) on day 5 after infection and analyzed for Ccl11 (n=3 each group), Cxcl5 (n=4 each group) and Il33 (n=5 for Il1rnfl/fl, n=3 for Il1rnfl/flFoxp3YFPCre mice) mRNA expression levels using RT-qPCR. Unless otherwise indicated, data are pooled from 2–3 experiments. For (a,b) each dot represents one mouse, while for (f-i) and (k) each dot represents the mean pool result of one experiment and for (j) each dot represents a replicate and is representative of one of the two experiments performed. For statistical significance: (a,b) were assessed by unpaired t-tests with Holm-Sidak adjustment for multiple comparisons, (i) was calculated by two-way ANOVA with Šídák's multiple comparisons test (j-k) were calculated by unpaired Student’s t-test and the survival experiment in (f) was assessed by Log-Rank (Mantel-Cox) test. Column Plots: mean with Standard Deviation. Box and whisker plots: whiskers are max and min, box 25–75 percentile and line is median. P values shown in plots.

References

    1. Iwasaki A. & Pillai PS Innate immunity to influenza virus infection. Nature reviews. Immunology 14, 315–328 (2014). - PMC - PubMed
    1. Biondo C, Lentini G, Beninati C. & Teti G. The dual role of innate immunity during influenza. Biomed J 42, 8–18 (2019). - PMC - PubMed
    1. Josefowicz SZ, Lu LF & Rudensky AY Regulatory T cells: mechanisms of differentiation and function. Annu Rev Immunol 30, 531–564 (2012). - PMC - PubMed
    1. Betts RJ et al. Influenza A virus infection results in a robust, antigen-responsive, and widely disseminated Foxp3+ regulatory T cell response. Journal of virology 86, 2817–2825 (2012). - PMC - PubMed
    1. Panduro M, Benoist C. & Mathis D. Tissue Tregs. Annu Rev Immunol 34, 609–633 (2016). - PMC - PubMed

Methods References:

    1. Horai R. et al. Production of mice deficient in genes for interleukin (IL)-1alpha, IL-1beta, IL-1alpha/beta, and IL-1 receptor antagonist shows that IL-1beta is crucial in turpentine-induced fever development and glucocorticoid secretion. J Exp Med 187, 1463–1475 (1998). - PMC - PubMed
    1. Itohara S. et al. T cell receptor delta gene mutant mice: independent generation of alpha beta T cells and programmed rearrangements of gamma delta TCR genes. Cell 72, 337–348 (1993). - PubMed
    1. Rahman AH et al. Antiviral memory CD8 T-cell differentiation, maintenance, and secondary expansion occur independently of MyD88. Blood 117, 3123–3130 (2011). - PMC - PubMed
    1. Borges CM et al. Regulatory T cell expressed MyD88 is critical for prolongation of allograft survival. Transpl Int 29, 930–940 (2016). - PMC - PubMed
    1. Lamacchia C, Palmer G, Seemayer CA, Talabot-Ayer D. & Gabay C. Enhanced Th1 and Th17 responses and arthritis severity in mice with a deficiency of myeloid cell-specific interleukin-1 receptor antagonist. Arthritis Rheum 62, 452–462 (2010). - PubMed

Substances