. 2023 Dec;24(12):2121-2134.
doi: 10.1038/s41590-023-01663-2. Epub 2023 Nov 9.

CD3ζ ITAMs enable ligand discrimination and antagonism by inhibiting TCR signaling in response to low-affinity peptides

Affiliations

CD3ζ ITAMs enable ligand discrimination and antagonism by inhibiting TCR signaling in response to low-affinity peptides

Guillaume Gaud et al. Nat Immunol. 2023 Dec.

Erratum in

Abstract

The T cell antigen receptor (TCR) contains ten immunoreceptor tyrosine-based activation motif (ITAM) signaling sequences distributed within six CD3 subunits; however, the reason for such structural complexity and multiplicity is unclear. Here we evaluated the effect of inactivating the three CD3ζ chain ITAMs on TCR signaling and T cell effector responses using a conditional 'switch' mouse model. Unexpectedly, we found that T cells expressing TCRs containing inactivated (non-signaling) CD3ζ ITAMs (6F-CD3ζ) exhibited reduced ability to discriminate between low- and high-affinity ligands, resulting in enhanced signaling and cytokine responses to low-affinity ligands because of a previously undetected inhibitory function of CD3ζ ITAMs. Also, 6F-CD3ζ TCRs were refractory to antagonism, as predicted by a new in silico adaptive kinetic proofreading model that revises the role of ITAM multiplicity in TCR signaling. Finally, T cells expressing 6F-CD3ζ displayed enhanced cytolytic activity against solid tumors expressing low-affinity ligands, identifying a new counterintuitive approach to TCR-mediated cancer immunotherapy.


Conflict of interest statement

Competing interests

G.G., J.D., C.S.H. and P.E.L. are inventors on an NIH patent using ITAM-mutated CD3ζ to enhance the function of cytotoxic T cells and other immune cells; Patent #: 63/113,428. The remaining authors declare no competing interests.

Figures

Extended Data Fig. 1 |
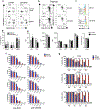
Extended Data Fig. 1 |. 6Y and 6F CD3ζ protein variants are expressed at the same level in peripheral T cells and 6Y and 6F(i) mice have similar phenotypes.
CD8+ T Cells from 6Y/6Y dLck-Cre- [6Y] and 6Y/6Y dLck-Cre + [6F(i)] mice were analyzed for CD3ζ expression by: (a) Intracellular staining with anti-CD3ζ and FACS acquisition (representative plot on left, summary graph on right), or (b) Western blot with anti-CD3ζ after cell lysis using the indicated detergents. (c) Surface TCRβ levels (MFI) were determined by antibody staining and FACS (representative plot on left, summary graph on right). d-g, Phenotype of 6Y/6Y OX40-Cre- [6Y] and 6Y/6Y OX40-Cre + [6F(i)] mice. (d) Flow cytometry analysis of CD4/8 populations in Thymus, Spleen and Lymph nodes. (e) Flow cytometry analysis of naïve/memory and Treg populations in Spleen. (f,g) Plots showing the percentage of indicated cell populations in the thymus (f) and Lymph node/Spleen (g) of 6Y and 6F(i) mice. Data are expressed as mean value ± SD). Plots shown are representative of at least three experiments with two mice per genotype.
Extended Data Fig. 2 |
Extended Data Fig. 2 |. Phenotype of OTI 6Y/6Y dLck-Cre- [OTI-6Y] and OTI 6Y/6Y dLCK-Cre + [OTI-6F(i)] mice.
(a,b) Flow cytometry analysis of Spleen and Lymph nodes (a) or thymus (b). Data are representative of at least three experiments with two mice per genotype. (c) Intracellular staining showing expression of CD3ζ-6F-Myc in double positive (CD4+ CD8+ ; DP), immature (CD24High TCRβlow) and mature (CD24Low TCRβHigh) CD8 SP thymocytes and peripheral CD8+ T cells from OTI-6Y and OTI-6F(i) mice. (d) Cellularity of thymus, or pooled axillary, brachial and inguinal lymph nodes (LN) and spleen of OTI-6Y and OTI-6F(i) mice. Data are expressed as mean value ± SD (n = 6 mice from three independent experiments). (e) CD8+ T cells from OTI 6Y/6Y dLck-Cre- [6Y] and OTI 6Y/6Y dLck-Cre + [OTI-6F(i)] mice were analyzed for key threshold TCR signaling regulators by FACS analysis. Data are expressed as mean value ± SD (n = 4 mice from two independent experiments). (f ) CD5, CD44, CD25 and CD69 activation marker expression, and CTV dilution (proliferation), by/of peripheral naive OTI-6Y and OTI-6F(i) CD8+ T cells stimulated with increasing amounts of anti-CD3 (μg/ml) alone (left panel) or in combination with anti-CD28 (1 μg/ml) (right panel). Data are expressed as mean value ± SD (n = 3 biological replicates). Data representative of three independent experiments. (g) OTI WT [OTI + / + ], OTI 6Y/6Y dLck-Cre- [OTI-6Y] and OTI-6Y/6Y dLck-Cre + [OTI-6F(i)] T cells were co-cultured with APC pulsed with 10−8 M or 10−10 M of the indicated peptide for 24 h and the expression of the indicated activation markers was analyzed by FACS. Data are expressed as mean value ± SD (n = 3 biological replicates). Data representative of two independent experiments. *P < 0.05, **P < 0.01, ***P < 0.001, ns not significant.
Extended Data Fig. 3 |
Extended Data Fig. 3 |. 6F-CD3ζ-expressing CD8+ T cells have a lower threshold of activation by low affinity antigens. Related to Fig. 2.
CD8+ T cells from OTI 6Y/6Y dLck-Cre- [OTI-6Y] and OTI 6Y/6Y dLck-Cre + [OTI-6F(i)] mice were co-cultured with APC pulsed with 106 M of the indicated peptide and accumulation of: (a) IL-2, (b) IFNγ, (c) IL-6, or (d) TNFα was assessed in the culture supernatants at the indicated times. Heatmaps of cytokine expression are shown on top. Bottom, Graphs of cytokine measurements are shown as Log10(cytokine/LOD), where LOD is the limit of detection. Data are represented as mean ± SEM. Statistical significance determined by two-way ANOVA corrected with Sidak test for multiple comparison. Data are representative of 8 independent experiments. (e) OTI 6Y/6Y [OTI-6Y] and OTI 6Y/6Y Ert2-Cre + [OTI-6F(i)] CD8+ T cells were treated in vitro with 4-OH tamoxifen for 48 hr before stimulation experiments. T cells were co-cultured with APC pulsed with 106 M of the indicated peptide and accumulation of IL-2, IFNγ, IL-6 or TNFα was assessed in the culture supernatants. Graphs of cytokine measurements are shown as mean of logarithm of concentrations over the whole time-course of the experiment, normalized by the lower limit of detection (LOD) in supernatant. N = 3 biological replicates from three independent experiments. Data are represented as mean ± SEM. Statistical significance determined by two-way ANOVA corrected with Sidak test for multiple comparison. *p < 0.05, **p < 0.01, ***p < 0.001, ****p < 0.0001, ns, not significant.
Extended Data Fig. 4 |
Extended Data Fig. 4 |. The enhancing effect of 6F-CD3ζ on TCR signaling in response to low affinity ligands is diminished when the ligand concentration (avidity) is increased. Related to Fig. 2.
4-OH tamoxifen treated OTI 6Y/6Y [OTI-6Y] and OTI 6Y/6Y Ert2-Cre + [OTI-6F(i)] CD8+ T cells (a) or OTI 6Y/6Y [OTI-6Y], OTI 6Y/6Y dLck-Cre + [OTI-6F(i)], and germline OTI 6F/6F [OTI-6F] CD8+ T cells (b) were stimulated with APC pulsed with the indicated concentration of peptides and analyzed for cytokine production in the supernatant (a) or CD69 surface expression by FACS (b). Statistical significance determined by unpaired two-sided t-test analysis (a) or two-tailed ANOVA test analysis (b). Data are represented as Mean ± SEM. N = 3 biological replicates, Data representative of three independent experiments. *p < 0.05, **p < 0.01, ***p < 0.001, ****p < 0.0001, ns, not significant. Data are from three independent experiments. c, d, e, 6F-CD3ζ-expressing T cells have a lower threshold of activation toward low affinity antigens. Related to Fig. 3. (c) Proliferation of CD8+ T cells from OTI 6Y/6Y dLck-Cre- [OTI-6Y] and OTI 6Y/6Y dLck-Cre + [OTI-6F(i)] mice co-cultured for 72 h with APC pulsed with 106 M of the indicated peptide assessed by Cell Trace Violet (CTV) dilution. Summary of experiments are shown in the graph below. N = 5 biological replicates from 2 independent experiments. Data are represented as Mean ± SEM. Statistical significance determined by two-way ANOVA corrected with Sidak test for multiple comparison. (d), OTI CD8+ T cells from OTI 6Y/6Y [OTI-6Y] or OTI 6Y/6Y dLck-Cre + [OTI-6F(i)] mice were stimulated for 2 minutes with peptide-pulsed APCs. Graph represents the percentage of pZAP-70 (Y319), pLAT (Y171) or pErk1/2 (T202/Y204) positive cells from intracellular staining. Data were analyzed by unpaired t-test (two tailed) and are represented as mean ± SEM. *P < 0.05, **P < 0.01, ***P < 0.001, ****P < 0.0001. (e), OTI-6Y and OTI 6Y/6Y Ert2-Cre + [OTI-6F(i)] CD8+ T cells were treated in vitro with 4-OH tamoxifen for 3 days, stimulated for 2 min with the indicated Kb peptide-tetramers, lysed and analyzed by PAGE and immunoblot with the indicated antibodies. Data are representative of three independent experiments.
Extended Data Fig. 5 |
Extended Data Fig. 5 |. Analysis of the cytokine release profile of germline OTI-6F CD8+ T cells over a 72 hr time course. Related to Fig. 4.
(a) Distribution of cytokine secretion levels of effector OTI-6Y or OTI-6F (germline) CD8+ T cells pre-stimulated with 10−6 M-6 N4 antigen + APCs for 6 days then re-stimulated with APC + 10−6 M antigens of varying affinities.(b) Mutual information (antigen classes) between antigen quality and all secreted cytokines for each genotype. While OTI-6Y T cells can distinguish more than four classes of antigen across the 6 peptide affinities tested, OTI-6F T cells only distinguish two. Data are expressed as MI estimator ± SD.(c) Summary plots of cytokine secretion showing scaled mean over time. Data are represented as mean ± SD. (d) Mutual information (antigen classes) between antigen quality and each secreted cytokine for each genotype. Data are expressed as MI estimator ± SD. ([n = 14 OTI-6Y (OTI 6Y/6Y) or n = 10 OTI-6F (OTI 6F/6F) biological replicates].
Extended Data Fig. 6 |
Extended Data Fig. 6 |. Analysis of the cytokine release profiles of OTI-6F(i) CD8+ blasts restimulated with 10−6 M peptide (a-c) or 10−9 M peptide (d-f) over a 72 h time course. Related to Fig. 4.
(a-c), OTI-6Y (OTI 6Y/6Y dLckCre-) and OTI-6F(i) (OTI 6Y/6Y dLckCre+) CD8+ T cells were co-cultured with APC pulsed with 10 −6 M N4 peptide for 6 days then re-stimulated with APC + 10−6 M antigens of varying affinities. (a) Distribution of cytokine secretion levels. Data are represented as mean ± SD. (b) Summary plots of cytokine secretion showing scaled mean over time. (c) Mutual information (antigen classes) between antigen quality and each secreted cytokine for each genotype. N = 3 biological replicates. Data are expressed as MI estimator ± SD.(d-f) OTI-6Y and OTI-6F(i) CD8+ T cells were co-cultured with APC pulsed with 10 −6 M N4 peptide for 6 days then re-stimulated with APC + 10−9 M antigens of varying affinities. (d) Distribution of cytokine secretion levels. Data are represented as mean ± SD. (e) Summary plots of cytokine secretion showing scaled mean over time. (f ) Mutual information (antigen classes) between antigen quality and each secreted cytokine for each genotype. N = 3 biological replicates. Although MI/Antigen class plots are similar for OTI-6Y and OTI-6F(i) T cells due to the enhanced response of OTI-6F(i) T cells to low affinity ligands, OTI-6F(i) T cells exhibit reduced discrimination of mid-high affinity ligands. Data are expressed as MI estimator ± SD.
Extended Data Fig. 7 |
Extended Data Fig. 7 |. Activated and expanded 6F-CD3ζ-expressing CD8+ T cells exhibit a lower threshold of activation toward low affinity peptides. Related to Fig. 8.
OTI-6Y [OTI 6Y/6Y-Ert2-cre-]; OTI-6F(i) [OTI 6Y/6Y Ert2-Cre+]; and OTI-6F germline [OTI 6F/6F] T cells were treated in vitro with 4-OH tamoxifen for 48 hr then activated in vitro with 0.5x10⁻⁶ M N4 peptide for 6 days before secondary stimulation experiments. (a), FACS analysis showing CD62L vs CD44 surface staining, or (b), CD5 and TCRβ surface staining (Mean Fluorescence Intensity; MFI) of OTI CD8+ T cells of the indicated genotypes after in vitro activation and expansion. (c,d) Activated and expanded OTI CD8 T cells were re-stimulated with APC pulsed with the indicated peptides and analyzed by FACS for CD25 surface expression (c) or IFNγ expression (d) by intracellular staining. Bar graph plots show MFI of CD25 (left) or % IFNγ+ cells (right) from experiments shown in (c) and (d), respectively. Statistical significance determined by unpaired t-test analysis. *p < 0.05, **p < 0.01, ***p < 0.001,****p < 0.0001, ns, not significant. Data are representative of at least two experiments. (e) OTI CD8+ T cells of the indicated genotypes were treated in vitro with 4-OH tamoxifen for 48 h and activated with 0.5x10⁻⁶ M N4 peptide for 6 days before experiments. OTI-6Y [OTI 6Y/6Y Ert2-cre-]; OTI-6F(i) [OTI 6Y/6Y Ert2-cre+]. Shown are in vitro killing assays of OTI CD8+ T cells from the indicated mice against B16 F10-N4 (left) or B16 F10-V4 (right) target cells at the indicated effector-to-target ratios by xCELLigence RTCA (Agilent). Data are represented as mean ± SD.
Extended Data Fig. 8 |
Extended Data Fig. 8 |. 6F-CD3ζ-expressing CD8+ T cells exhibit higher cytotoxicity toward tumor cells expressing low affinity (V4) ligand. Related to Fig. 8.
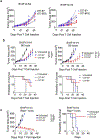
(a) Plot showing individual tumor measurements related to Fig. 8b. (b) C57B6 mice were injected with pre-activated (0.5x10⁻⁶M N4 peptide) OT1-6Y or OTI-6F CD8+ T cells 7 days after B16F10-V4 melanoma implantation. Results shown are representative of 3 experiments. Top, measurement of the size of B16F10-N4 or B16F10-V4 tumors implanted into C57B6 mice. Bottom, survival curves of experiment shown above. Data are represented as mean ± SD (c) Left, Rag2−/− mice that were injected with pre-activated (0.5x10⁻⁶M N4 peptide) OT1-6Y or OTI-6F CD8+ T cells 7 days after B16F10 melanoma implantation. Right, survival curves of experiments shown on left. Results shown are representative of 3 experiments. Data are represented as mean ± SD. *P < 0.05, **P < 0.01, ***P < 0.001, ****P < 0.0001, ns, not significant.
Extended Data Fig. 9 |
Extended Data Fig. 9 |. Retroviral (RV) transduction of 6F-CD3ζz into WT (+/+) OTI CD8+ T cells enhances TCR-mediated anti-tumor responses. Related to Fig. 8.
(a-c) WT (+/+) OTI CD8+ T cells stimulated with N4 peptide (0.5x10⁻⁶M) and APCs were transduced with retroviruses (RV) expressing 2A-epitope tagged 6Y-CD3ζ (6Y) or 6F-CD3ζ (6F) before addition to tumor cell cultures. (a) Transduced OTI T cells were analyzed by FACS for the indicated markers. RV-encoded LNGFR was used to assess transduction efficiency. (b), Transduced OTI CD8+ T cells were analyzed by immunoblot for the presence of TCR associated 2A-tagged RV-encoded 6Y or 6 F CD3ζ after immunoprecipitation with anti-TCRβ and PAGE to confirm incorporation of transduced ζ chains into the TCR. IP-immunoprecipitated, CL-cell lysate. Data are representative of two independent experiments.(c) Plot showing individual tumor measurements related to Fig. 8d.
Extended Data Fig. 10 |
Extended Data Fig. 10 |. OTI CD8+ T cells heterozygous for the CD3ζ-6F allele [6F/+(i)] display an intermediate phenotype compared to OTI-6Y and OTI-6F(i) T cells. Related to Fig. 8.
(a) CD8+ T cells from OTI 6Y/6Y dLck-Cre-[OTI-6Y], OTI-6Y/+ dLck-Cre + [OTI-6F/+(i)] and OTI-6Y/6Y dLck-Cre + [OTI-6F(i)] mice were co-cultured with APC pulsed with 10−8 M of the indicated peptide and accumulation of cytokines was assessed in the culture supernatants at 16 h. N = 3 biological replicates. Data are represented as mean ± SD. Statistical significance determined by two-way ANOVA corrected with Sidak test for multiple comparison. Data are representative of 2 independent experiments. (b) Ratio of IL-2 and IFNγ concentrations (‘antagonism ratio’) for all agonist (N4; 108 M) / antagonist (V4, G4, E1; 106 M) combinations. N = 3 biological replicates. Data are represented as mean ± SD. Data are representative of 2 independent experiments. (c) Expression of CD3ζ with mutation of the ITAM tyrosines (Y) to phenylalanine (F) or alanine (A) or deletion of the ITAMs (truncated) enhances OTI CD8+ T cell cytotoxic responses. OTI (+/+) CD8+ T cells were stimulated with N4 peptide then transduced with retroviruses expressing 6Y, 6F, 6A (where all 6 ITAM tyrosines have been mutated to alanine) or a truncated CD3ζ chain lacking the 3 ITAMs. Shown are in vitro tumor killing assays at 10:1, 5:1 or 2.5:1 effector-to-target ratios by xCELLigence RTCA (Agilent). *P < 0.05, **P < 0.01, ***P < 0.001, ****P < 0.0001, ns, not significant.
Fig. 1 |
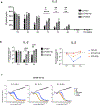
Fig. 1 |. 6F(i)-CD3ζz T cells exhibit enhanced activation responses to some LCMV ligands.
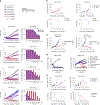
a, Top, targeting strategy to generate CD3ζ 6Y-6F Cre-inducible ‘switch’ mice. Bottom, expression of 6Y-CD3ζ (FLAG-tagged) and 6F-CD3ζ (Myc-tagged) in CD4+ and CD8+ T cells assessed using intracellular staining. 6Y (germline 6Y/6Y), 6F (germline 6F/6F) and 6F(i) (Ert2-Cre+ 6Y/6Y) T cells were cultured in vitro with 4-OH tamoxifen (4-OHT) for 2 days before fluorescence-activated cell sorting (FACS) analysis. b, Top, proliferation of naive 6Y, 6F and tamoxifen-induced 6F(i) (Ert2-Cre) CD8+ T cells stimulated with increasing amounts of plate-bound anti-CD3 alone or in combination with anti-CD28 assessed by cell trace violet (CTV) dilution. Bottom, combined data from three experiments. c,d, CD5 (c) and CD69 (d) activation marker expression by tamoxifen-treated naive peripheral CD8+ T cells from 6Y, 6F and 6F(i) (Ert2-Cre) mice in response to increasing amounts of anti-CD3 (ng ml−1) alone or in combination with anti-CD28 (1 μg ml−1). For (b-d), statistical comparisons are 6Y to 6F(i) (top) or 6Y to 6F (bottom). e, Activation (phosphorylation) of signaling effectors in naive 6Y, 6F and 6F(i) (dLck-Cre) CD8+ T cells stimulated with 10 μg ml−1 anti-CD3 antibody for the indicated time and analyzed by immunoblot. f, 6Y, 6F and 6F(i) (OX40-Cre) mice were infected with LCMV Armstrong and spleen T cells were collected and analyzed for cytokine expression 8 days later after peptide restimulation. n = 4 for each group. Data were analyzed using a two-tailed, unpaired t-test and are represented as the mean ± s.e.m. NS, not significant, *P < 0.05, **P < 0.01, ***P < 0.001, ****P < 0.0001. The results shown are representative of at least three experiments.
Fig. 2 |
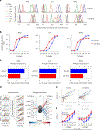
Fig. 2 |. 6F-CD3ζ-expressing T cells have a lower threshold of activation to low-affinity antigens but are not overtly self-reactive.
a, 1/Ligand potency of the different OTI-APLs relative to N4 (refs. 37,39). b, Left, heatmap of IL-2 production by OTI-6Y, OTI-6F or OTI-6F(i) (dLck-Cre) CD8+ T cells cocultured with APC pulsed with 1 μM of the indicated peptides. Right, time course of IL-2 production after stimulation with N4 or G4 peptides. n = 6 biological replicates from two independent experiments. c, Cytokine concentrations in the supernatant of stimulated OTI CD8+ T cell cultures as detailed in b averaged over the entire time course. n = 3 biological replicates. In b,c data are shown as the mean ± s.e.m. and are representative of eight independent experiments. Statistical significance was determined using a two-way analysis of variance (ANOVA) with Šidák correction for multiple comparisons. d, In vivo proliferation of CTV-loaded, 4-OH tamoxifen treated Thy1.1 OTI+/+ and Thy1.2 OTI-6F(i) (Ert2-Cre) CD8+ T cells coinjected into Thy1.1/1.2 hosts at a 1:1 ratio followed by injection with (1 μM) peptide-pulsed APCs 24 h later. Spleen and lymph node T cells were analyzed 6 days after injection of APCs. Data shown are representative of two experiments. e, Cytokine response of naive OTI-6Y or OTI-6F(i) (dLck-Cre) CD8+ T cells stimulated with APC pulsed with 1 μM Catnb for 72 h. f, OTI-6Y or OTI-6F(i) (dLck-Cre) CD8+ T cells were preactivated for 6 days with 0.5 μM N4 peptide plus APCs. The graph represents the percentage of CD25high T cells in response to APCs pulsed with the indicated concentration of N4 agonist or Catnb for 48 h. n = 3 biological replicates. Data are shown as the mean ± s.d. and are representative of two independent experiments. Statistical significance was determined using a two-way ANOVA with Šidák correction for multiple comparisons. g, 4-OH tamoxifen treated 6Y (Thy1.2) or 6F(i) (Ert2-Cre) (Thy1.2) naive T cells were coinjected with Thy1.1 (WT+/+) naive T cells at a 1:1 ratio into Rag2−/− mice. The Thy1.2/Thy1.1 ratio of T cells from lymph nodes was analyzed 6 days after injection. n = 4 biological replicates. Data are shown as the mean ± s.d. h, Bone marrow chimeras were generated with a 1:1 mixture of CD45.1 WT+/+ T-depleted bone marrow cells and either CD45.2 6F(i) (Ert2-Cre) or CD45.2 WT+/+ T-depleted bone marrow cells. Twelve weeks later, mice received tamoxifen by oral gavage once daily for 5 days and were then euthanized 2 weeks after the last gavage. The graph shows the percentage of naive and memory CD45.2+CD8+ T cells from lymph nodes. n = 3 biological replicates. The results shown are representative of two experiments. Data are shown as the mean ± s.d. Statistical significance was determined using a two-tailed, unpaired t-test. *P < 0.05, **P < 0.01, ***P < 0.001, ****P < 0.0001. NP, no peptide.
Fig. 3 |
Fig. 3 |. 6F-CD3ζ-expressing T cells display enhanced TCR signaling when stimulated with low-affinity peptides.
a, 4-OH tamoxifen treated OTI-6Y and OTI-6F(i) (Ert2-Cre) CD8+ T cells were stimulated with (1 μM) N4 or G4 peptide-pulsed APCs for 48 h. The FACS plot shows the IRF4 mean fluorescence intensity (MFI) from intracellular staining. Bar graph on right shows data from 3 independent experiments. b, 4-OH tamoxifen treated OT-6Y, OT-6F and OTI-6Y(i) (Ert2-Cre) CD8+ T cells were stimulated for 2 min with (1 μM) peptide-pulsed APCs. The bar graph shows the percentage of pLAT (pY171)-positive cells from the intracellular staining and FACS analysis. Data are from 3 independent experiments. In a,b, data are shown as the mean ± s.d. Statistical significance was determined using a two-way ANOVA with Šidák correction for multiple comparisons. c, Naive OTI-6Y and OTI-6F(i) (dLck-Cre) CD8+ T cells were stimulated with the indicated Kb peptide tetramers, lysed and analyzed using polyacrylamide gel electrophoresis (PAGE) and immunoblotting. Data are representative of three independent experiments. d, Calcium flux from OTI-6Y and OTI-6F(i) (dLck-Cre) naive CD8+ T cells loaded with indo-1 then stimulated with the indicated Kb peptide tetramers followed by ionomycin. Data are representative of two experiments. Statistical significance was determined using an unpaired t-test. **P < 0.01.
Fig. 4 |
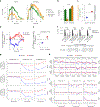
Fig. 4 |. Antigen-stimulated OTI-6F(i) CD8+ T cells exhibit reduced ligand discrimination.
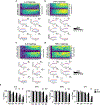
a, Averaged distribution of normalized cytokine secretion of 4-OH tamoxifen treated naive OTI-6Y or OTI-6F(i) (Ert2-Cre) CD8+ T cells stimulated with APC + 1 μM antigen of varying affinities. n = 3 biological replicates. The data shown are representative of two independent experiments. b, Plots of cytokine secretion for IFNγ, IL-2 or TNF averaged over the 72-h time course. n = 3 biological replicates. Data are shown as the mean ± s.d. and are representative of at least three independent experiments. c, Mutual information (antigen classes) between antigen quality and each secreted cytokine for each genotype. Data are expressed as the MI estimator ± s.d. n = 3 biological replicates representative of at least three independent experiments. d, Cytokine secretion dynamics of naive OTI T cells in response to antigens of six different affinities were preprocessed (left) and then projected into a compressed two-dimensional space (LS1, LS2) through the application of the weight matrix obtained from a three-layer neural network trained to predict antigen quality (right) (n = 3 biological replicates). e, Time trajectories of LS1 and LS2 for each antigen in 4-OH tamoxifen treated OTI-6Y and OTI-6F(i) (Ert2-Cre) CD8+ T cells. f, LS1 and LS2 values at 36 h as a function of antigen affinity. n = 3 biological replicates. Data are shown as the mean ± s.d. and are representative of at least three independent experiments.
Fig. 5 |
Fig. 5 |. 6F-CD3ζ TCRs do not recruit or retain SHP1 and are associated with more pZAP-70 after pMHC engagement.
OTI-6Y and OTI-6F(i) (dLck-Cre) naive CD8+ T cells were stimulated for 2 min with the indicated Kb peptide-loaded tetramers (a,dg) or left unstimulated (b,c). Cell lysates were incubated with the indicated antibodies; immunoprecipitated proteins or total cell lysates were analyzed using SDS–PAGE and immunoblotted with the indicated blotting antibodies. a, OTI-6Y and OTI-6F(i) CD8+ T cells were stimulated with peptide-loaded tetramers and tyrosine phosphorylated CD3 subunits co-immunoprecipitated with TCRβ were detected by 4G10 blot. b, association of ZAP-70 with CD3ζ in unstimulated OTI-6Y and OTI-6F(i) CD8+ T cells determined by ZAP-70 immunoprecipitation and CD3ζ blotting. c, association of ZAP-70 with 6Y or 6F(i) TCRs in unstimulated OTI-6Y and OTI-6F(i) CD8+ T cells by TCRβ immunoprecipitation and ZAP-70 blotting. d, OTI-6Y and OTI-6F(i) CD8+ T cells were stimulated with peptide-loaded tetramers and ZAP-70 association with the TCR was assessed by CD3ε immunoprecipitation and ZAP-70 blotting. e,f, OTI-6Y and OTI-6F(i) CD8+ T cells were stimulated with peptide-loaded tetramers and TCR associated pZAP-70 was detected by CD3ε immunoprecipitation and p(Y319) ZAP-70 blotting. g, quantitation of p(319)ZAP-70 and association of pZAP-70 with pCD3 subunits in peptide-loaded tetramer stimulated OTI-6Y and OTI-6F(i) CD8+ T cells by p(Y319)ZAP-70 immunoprecipitation. h,i, OTI-6Y and OTI-6F(i) CD8+ T cells were stimulated with peptide loaded tetramers and TCR associated SHP1 was evaluated by TCRβ co-immunoprecipitation and SHP1 blotting.
Fig. 6 |
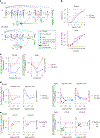
Fig. 6 |. 6F-CD3ζ-expressing T cells have a higher threshold for antagonism.
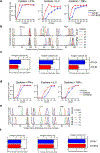
a, IL-2 secretion dynamics over 72 h for naive OTI-6Y or OTI-6F(i) (dLck-Cre) CD8+ T cells incubated with APCs pulsed with either an agonist alone (N4) or agonist plus antagonist (N4 + V4) at the indicated concentrations (n = 3 biological replicates). b, At 18 h, IL-2 levels were markedly lower in OTI-6Y T cells stimulated with both N4 and V4 compared to N4 alone, whereas V4 functioned as a co-agonist with N4 for OTI-6F(i) T cells. Data are shown as the mean ± s.d. c, Antagonism ratio for b. Values greater than 1 indicate enhancement of the agonist response by an antagonist ligand, while values smaller than 1 are indicative of antagonism. d, Antagonism ratio as a function of time revealed that adding V4 peptide increased IL-2 secretion by N4 peptide-stimulated OTI-6F(i) T cells but antagonized IL-2 secretion by N4 peptide-stimulated OTI-6Y T cells. e, Averaged antagonism ratio over all recorded time points. f, CD8+ T cells from OTI-6Y and OTI-6F(i) (dLck-Cre) mice were prestimulated with 10−6 M N4 antigen plus APCs for 6 days then restimulated with 10−11 M N4 peptide alone or with different concentrations of V4 peptide plus APC for 24 h. IL-2 in the supernatant was quantified using a cytometric bead array (CBA) assay. n = 3 biological replicates. Data are shown as the mean ± s.d. and are representative of at least three independent experiments. *P < 0.05, **P < 0.01,***P < 0.001, ****P < 0.0001. Statistical significance was determined using an unpaired t-test. g, Antagonism ratios for IL-2, IFNγ and TNF calculated by adding different concentrations of E1, G4 or V4 peptides to OTI-6Y or OTI-6F(i) CD8+ T cells stimulated with 10−11 M N4 antigen. n = 3 biological replicates. Data are shown as the mean ± s.d. and are representative of two independent experiments. h, Kinetics of the ratio of IL-2 concentrations (‘antagonism ratio’) for the indicated agonist and antagonist combinations (n = 3 biological replicates). i, Average antagonism plots for different agonist and antagonist combinations and ratios. Antagonist peptide concentrations were 10−6 M for all conditions.
Fig. 7 |
Fig. 7 |. Activation properties of 6F-CD3ζ TCRs are accurately predicted by a new model of KPR with negative feedback.
a, Phenomenological model of TCR activation predicting antagonism, as modified from François et al.. On binding to a ligand (left), the TCR undergoes a series of biochemical modifications (indicated by color changes on ITAMs). Complexes can also unbind, followed by rapid dephosphorylation of ITAMs; thus, the TCR implements a KPR scheme. Complex Cm (m = 1) activates the negative feedback realized by the phosphatase SHP1 (S: active, S: inactive); SHP1 activation is reduced in 6F(i) T cells by a factor fα,6F to reflect the experimental observations reported in Fig. 4. To reflect their higher ITAM multiplicity, 6Y TCRs can undergo N6Y proofreading steps and 6F TCRs can undergo N6F steps, with N6Y > N6F. Moreover, the last k6Y complexes of 6Y TCRs contribute to the total output (green arrows) compared to only one for 6F(i). b, Top, model constructed to recapitulate the differences between the responses of OTI-6Y and OTI-6F(i) T cells to antigens with different affinity for the TCR. Bottom, experimental results as measured by IL-2 concentration at 24 h in response to different OTI peptides. c, Comparison of modeled versus experimental results on the degree of antagonism in OTI-6Y and OTI-6F(i) T cells as a function of antagonist peptide affinity. Both model and experiment show that OTI-6F(i) T cells are less susceptible to antagonism than OTI-6Y T cells across a range of antagonist affinities, and that there is an optimum range of antagonist affinities needed to maximize an antagonistic response. d, Model (left) and experimental results (right) for antagonism as a function of agonist concentration, agonist and genotype (see Fig. 6h,i). Both model and experiment show that OTI-6F(i) T cells are antagonized less effectively than OTI-6Y T cells. e, Model (left) and experimental results (right) for antagonism as a function of agonist concentration, antagonist and genotype for different antagonists (see Fig. 6h,i). Both model and experiment show that the antagonist that produces the largest antagonistic effect changes as the agonist concentration varies. n = 3 biological replicates. Data are represented as the mean ± s.d. Data are representative of three independent experiments.
Fig. 8 |
Fig. 8 |. OTI-6F(i) CD8+ T cells exhibit higher cytotoxicity toward tumors expressing low-affinity antigens.
a, Left, in vitro tumor killing plots of CD8+ T cells from OTI-6Y or OTI-6F(i) (dLck-Cre) mice at various effector-to-target ratios against B16-F10 melanoma cells expressing N4, Q4, T4 or V4 OVA-APL peptides. The arrow represents the time of T cell addition to the melanoma cell cultures. Right, related killing index (percentage cytolysis) using xCELLigence RTCA for each experiment. Effector-to-target ratios are shown on the x axis. n = 3 biological replicates. Data are shown as the mean ± s.d. Statistical significance was determined using a two-way ANOVA with Šidák correction for multiple comparisons. Data are representative of three independent experiments. b, Top, measurement of the size of B16-F10-N4 or B16-F10-V4 tumors implanted into C57BL/6 mice that were subsequently injected with OTI-6Y or OTI-6F(i) (dLck-Cre) CD8+ T cells 7 days after melanoma implantation. Bottom, survival plots from the experiment shown above. n = 5 biological replicates. Data are representative of three independent experiments. c, Experiment similar to that shown in b except that C57BL/6 (left) or Rag1−/− (right) mice were injected with OTI-6Y or OTI-6F CD8+ T cells. n = 5 biological replicates. Results are representative of three experiments. d, Experiment similar to that shown in a performed with naive OTI (+/+) CD8+ T cells that were first activated and expanded with anti-CD3 + anti-CD28 antibodies, then left untransduced or transduced with 6Y-CD3ζ or 6F-CD3ζ retrovirus. T cells were added to B16-F10-N4 or B16-F10-V4 melanoma cultures at an E:T ratio of 10:1 or 2.5:1; the killing index was recorded by xCELLigence RTCA. One representative of three experiments. e, Retroviral transduced T cells as described in d were injected into C57BL/6 mice 7 days after B6-F10-N4 or B16-F10-V4 melanoma implantation. Top, measurement of tumor size over time. Bottom, survival plots from the same experiment. n = 5 biological replicates. Data are representative of two independent experiments. In b,c,e data are presented as the mean ± s.e.m.; statistical significance was determined with SAS v.9.4 (Methods). *P < 0.05, **P < 0.01, ***P < 0.001, ****P < 0.0001.

References

    1. François P, Voisinne G, Siggia ED, Altan-Bonnet G & Vergassola M Phenotypic model for early T-cell activation displaying sensitivity, specificity, and antagonism. Proc. Natl Acad. Sci. USA 110, E888–E897 (2013). - PMC - PubMed
    1. Lever M et al. Architecture of a minimal signaling pathway explains the T-cell response to a 1 million-fold variation in antigen affinity and dose. Proc. Natl Acad. Sci. USA 113, E6630–E6638 (2016). - PMC - PubMed
    1. Altan-Bonnet G & Germain RN Modeling T cell antigen discrimination based on feedback control of digital ERK responses. PLoS Biol 3, e356 (2005). - PMC - PubMed
    1. Reth M Antigen receptor tail clue. Nature 338, 383–384 (1989). - PubMed
    1. Samelson LE & Klausner RD Tyrosine kinases and tyrosine-based activation motifs. Current research on activation via the T cell antigen receptor. J. Biol. Chem 267, 24913–24916 (1992). - PubMed