. 2024 Apr;20(4):422-431.
doi: 10.1038/s41589-023-01453-9. Epub 2023 Nov 9.

A helical fulcrum in eIF2B coordinates allosteric regulation of stress signaling

Affiliations

A helical fulcrum in eIF2B coordinates allosteric regulation of stress signaling

Rosalie E Lawrence et al. Nat Chem Biol. 2024 Apr.

Abstract

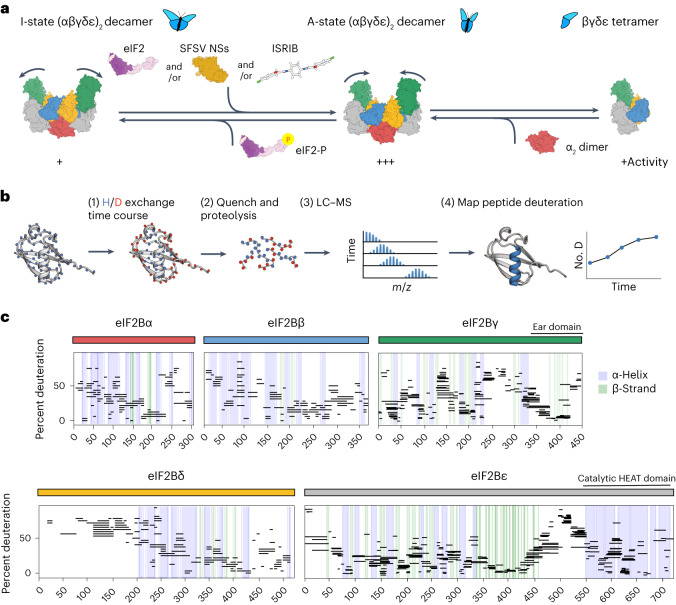
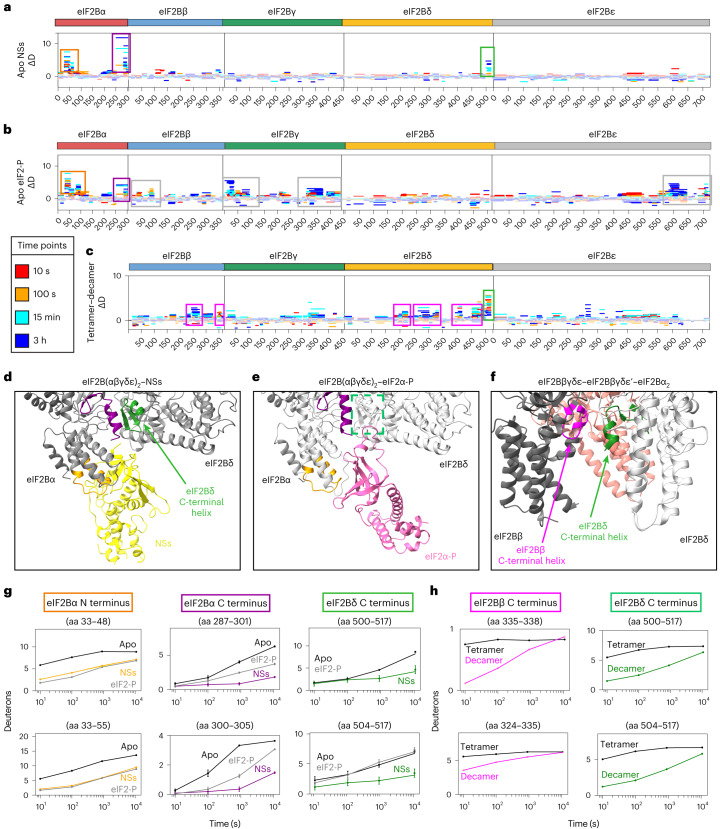
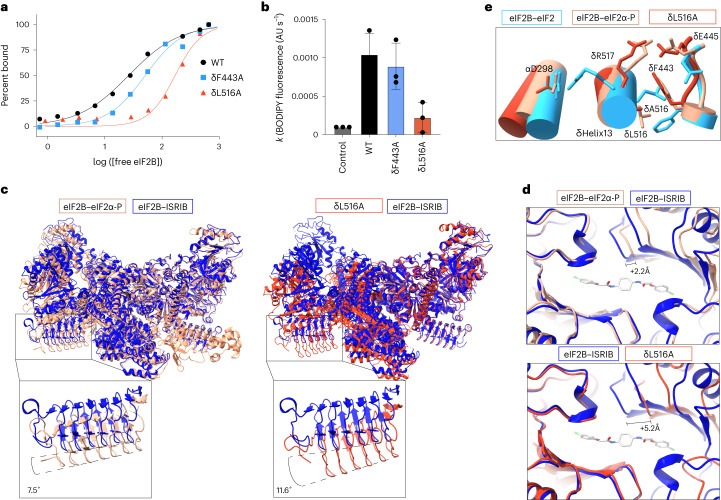
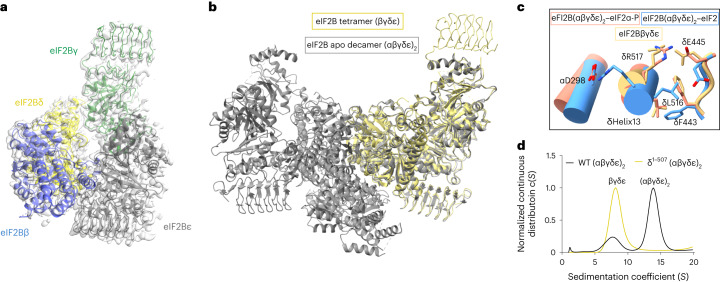
The integrated stress response (ISR) enables cells to survive a variety of acute stresses, but chronic activation of the ISR underlies age-related diseases. ISR signaling downregulates translation and activates expression of stress-responsive factors that promote return to homeostasis and is initiated by inhibition of the decameric guanine nucleotide exchange factor eIF2B. Conformational and assembly transitions regulate eIF2B activity, but the allosteric mechanisms controlling these dynamic transitions and mediating the therapeutic effects of the small-molecule ISR inhibitor ISRIB are unknown. Using hydrogen-deuterium exchange-mass spectrometry and cryo-electron microscopy, we identified a central α-helix whose orientation allosterically coordinates eIF2B conformation and assembly. Biochemical and cellular signaling assays show that this 'switch-helix' controls eIF2B activity and signaling. In sum, the switch-helix acts as a fulcrum of eIF2B conformational regulation and is a highly conserved actuator of ISR signal transduction. This work uncovers a conserved allosteric mechanism and unlocks new therapeutic possibilities for ISR-linked diseases.


Conflict of interest statement

P.W. is an inventor of ISRIB. A patent is held by the Regents of the University of California that describes ISRIB and its analogs. Rights to the invention have been licensed by UCSF to Calico. P.W. is a current employee and shareholder in Altos Labs, Inc. All other authors have no competing interests.

Figures

Fig. 1
Fig. 1. HDX–MS probes eIF2B structure.
a, eIF2B is regulated by conformation and assembly state. Conversion to the less active I-state conformation (left) is driven by eIF2-P binding. Stabilization of the active A-state conformation (middle) is driven by eIF2, NSs or ISRIB binding; SFSV, sandfly fever Sicilian Assembly from less active tetramers (right) into more active decamers (middle) is driven by availability of the eIF2Bα2 dimer. b, Schematic of an HDX–MS experiment. Protein is incubated in deuterated solvent, and amide hydrogens (H) are able to exchange with deuterium (D) until defined time points (1). Exchange is quenched via pH and temperature drop, and protein is protease digested (2). Average peptide deuteration is detected via LC–MS (3). Peptide deuteration uptake is plotted over time and interpreted in the context of structural information (4). c, Percent deuteration after 100 s of deuterium labeling for every peptide in one apo eIF2B dataset. Solid-colored bars indicate each eIF2B subunit, corresponding to the color scheme in a. Each horizontal line represents an individual peptide spanning the residues indicated on the x axis, with percent deuteration (not correcting for back exchange) indicated on the y axis. α-Helices are indicated by blue vertical lines, and β-strands are indicated by green vertical lines, derived from the apo eIF2B structure PDB 7L70. Regions not resolved in the apo structure for which secondary structural information exists include the eIF2Bγ C-terminal ‘ear domain’ (secondary structure derived from PDB 7D44) and the eIF2Bε C-terminal HEAT domain (secondary structure derived from PDB 6O81). Shown are peptides from one representative experiment; all HDX experiments were replicated at least three independent times.
Fig. 2
Fig. 2. HDX–MS analysis of eIF2B conformation and assembly states identifies remodeling of the same helix.
ac, Representative deuteration difference maps for apo eIF2B versus NSs-bound eIF2B (a), apo eIF2B versus eIF2-P-bound eIF2B (b) and eIF2Bβγδε tetramer versus eIF2B(αβγδε)2 decamer (c). On each graph, time points are overlayed and color coded. The 10-s deuteron difference is mapped in red, the 100-s difference is mapped in orange, the 15-min difference is mapped in cyan, and the 3-h difference is mapped in dark blue. Positive values represent peptides with more protection (less deuteration) in the second listed state than in the first listed state. Significant protection is defined as multiple peptides with a change in number of deuterons (∆D) of greater than 0.5; peptides without significant protection are contained within the dimmed threshold. Regions of NSs and eIF2-P protection located at the eIF2Bα effector binding site are shown in orange and purple boxes. The eIF2Bδ C-terminal switch-helix is shown in green boxes. eIF2-P-dependent protection of eIF2Bβ, eIF2Bγ and eIF2Bε is indicated by gray boxes. eIF2B regions of protection at the decamerization interface are indicated by pink boxes. Shown are peptides from one representative experiment; all HDX experiments were replicated at least three independent times. df, Structural maps of the NSs binding pocket (d), eIF2α-P binding pocket (e) and tetramer–tetramer interface (f) of the eIF2B(αβγδε)2 decamer. Regions of interest are color coded corresponding to protected regions shown in deuteration difference plots (see ac) and representative peptide uptake plots (see g and h). g,h, Peptide uptake plots showing the average number of exchanged deuterons per condition over time for representative peptides (representing an average of three independent experiments; error bars represent s.e.m.; not back-exchanged corrected); aa, amino acids.
Fig. 3
Fig. 3. The eIF2Bδ C-terminal helix is a conformational switch.
a, Overview of atomic models of eIF2-bound eIF2B (eIF2B in light blue and eIF2α in dark blue; PDB 6O81) and eIF2-P-bound eIF2B (eIF2B in salmon and eIF2α-P in dark orange; PDB 6O9Z) with the eIF2B C-terminal switch-helix indicated in green; [free eIF2B], concentration of free eIF2B. b, The eIF2Bδ C-terminal helix undergoes a conformational change mediated by remodeled side chain interactions in the A-state → I-state transition. In the A-state (left; PDB 6O81), δR517 forms a salt bridge (dotted lines) with αD298, and the δF443 rotamer is in the ‘down’ position. (1) In the I-state (right; PDB 6O9Z), δR517 forms a new salt bridge (dotted lines) with δE445, which coincides with (2) rotation of the eIF2Bδ C-terminal helix and adoption of the δF443 ‘up’ rotameric state. c, Binding assay for fluorescent FAM-ISRIB interaction with eIF2B(αβγδε)2 decamers with the indicated mutations using fluorescence polarization (calculated half-maximal effective concentration values (95% confidence interval): WT = 38 ± 2 nM; δE445A = 30 ± 2 nM; αD298A = 152 ± 18 nM). d, BODIPY-GDP nucleotide loading assay of eIF2B(αβγδε)2 decamers (final concentration of 5 nM) with the indicated point mutation. Shown are averages and s.e.m. for three experimental replicates; AU, arbitrary units. e, Kinetic fluorescence polarization dissociation assay for fluorescent FAM-ISRIB preincubated with eIF2B(αβγδε)2 decamers. At time zero, PERK kinase domain was spiked into the assay. Shown are averages and s.e.m. for three experimental replicates. f, BODIPY-GDP nucleotide unloading assay of eIF2B(αβγδε)2 decamers (final concentration of 5 nM) with or without point mutations and with or without the addition of 25 nM eIF2-P, as indicated. Shown are averages and s.e.m. of rate constants (k) derived from a single exponential fit for three experimental replicates. Source data
Fig. 4
Fig. 4. eIF2B switch-helix controls the A-state → I-state transition.
a, Binding assay to assess fluorescent FAM-ISRIB interaction with eIF2B(αβγδε)2 decamers containing the indicated mutations using fluorescence polarization (calculated half-maximal effective concentration values (95% confidence interval): WT = 26 ± 3 nM; δF443A = 50 ± 8 nM; δL516A = 169 ± 34 nM). Shown is one of three experimental replicates. b, BODIPY-GDP nucleotide loading assay of eIF2B(αβγδε)2 decamers (final concentration of 5 nM) with the indicated point mutation. Shown are averages and s.e.m. of rate constants (k) derived from a single exponential fit for three experimental replicates. c, Atomic model of the ISRIB-bound A-state eIF2B model (PDB 7L7G; blue) overlaid on the eIF2α-P-bound I-state eIF2B model (PDB 6O9Z; peach) and δL516A decamer structure (PDB 8TQZ; dark orange). The inset shows a zoom-in view of the β-solenoid domain (residues 342–466) of eIF2Bε. The hinge movement between the two eIF2B halves was measured between the lines connecting eIF2Bε H352 and P439 in the indicated structures. d, Zoom-in view of the ISRIB binding pocket (PDB 7L7G), showing widening after eIF2α-P binding (peach) and further widening for the δL516A decamer (dark orange). The 2.2-Å and 5.2-Å pocket lengthening was measured between eIF2Bβ N162 and eIF2Bδ S178. e, Overlay of δL516A switch-helix side chains (dark orange) onto the eIF2-bound eIF2B A-state decamer (PDB 6O81; blue) and the eIF2α-P-bound eIF2B I-state (PDB 6O9Z; peach) atomic models. Source data
Fig. 5
Fig. 5. The eIF2B switch-helix is triggered in the tetramer → decamer transition.
a, Atomic model of the eIF2B tetramer (PDB 6TQO) overlaid with EM density (EMD-41510). b, Overlay of the eIF2Bβγδε tetramer structural model onto the apo eIF2B(αβγδε)2 decamer structural model (PDB 7L70). c, Overlay of the eIF2Bβγδε tetramer switch-helix side chains (yellow) onto the eIF2-bound eIF2B A-state decamer (blue; PDB 6O81) and the eIF2α-P-bound eIF2B I-state (salmon; PDB 6O9Z) atomic models. d, Sedimentation velocity analytical ultracentrifugation analysis of WT eIF2B(αβγδε)2 and eIF2B(αβγδε)2 without the eIF2Bδ C-terminal helix (δ1–507). Source data
Fig. 6
Fig. 6. eIF2B switch-helix mutations control ISR signaling in cells.
a,b, AN3-12 mouse ES cells containing Eif2b4E446A homozygous (a); or b) Eif2b1D298A/Eif2b1WT heterozygous (αD298Ahet), endogenously edited mutations were treated with the indicated concentrations of Tg for 1 h and immunoblotted for the indicated proteins. Shown is one representative experiment from a total of three replicates; MW, molecular weight. c, Quantitation of ATF4 immunoblot intensity for blots shown in a and b. The signal was normalized to that of WT 50 nM Tg ATF4 signal. Shown is one representative experiment from a total of three replicates. d, The eIF2B switch-helix is in the I-state orientation in the eIF2Bβγδε tetramer (1). Incorporation of eIF2Bα2 prompts formation of the δR517–αD298 salt bridge, causing a δL516–δF443 steric clash, triggering conformational change of the switch-helix and global conversion to the eIF2B A-state (2). For the δL516A variant, in the absence of the δL516–δF443 steric clash, the switch-helix does not undergo conformational change, and the global I-state conformation is maintained after decamerization (3). Finally, binding of eIF2-P to apo eIF2B converts the switch-helix from the A-state to the I-state, reverting side chains back to the same I-state arrangement assumed in the tetramer. e, Model. eIF2B is in constant equilibrium between I-state and A-state populations. The relative occupancy of A-state and I-state populations can be tuned by the addition of activating effectors such as 2BAct or inhibitory effectors such as eIF2-P inhibitor. Switch-helix mutations can also tune the relative occupancy of A-state and I-state populations. The δL516A mutation shifts the equilibrium toward the I-state, but relative occupancy can still be tuned by effectors. Source data
Extended Data Fig. 1
Extended Data Fig. 1. eIF2B enzyme engages eIF2 substrate and p-eIF2 inhibitor via distinct compound interfaces.
(a) A surface representation of a model of two eIF2 trimers and ISRIB bound to an eIF2B(αβγδε)2 decamer is shown. Individual subunits of eIF2 and eIF2B are indicated. The eIF2 trimers are outlined in white and the locations of interfaces IF1-4 are indicated, as are the positions of eIF2 S51, the GTP binding pocket (empty in the structure), and ISRIB (shown in stick presentation). Note that in this productive, A-State complex, eIF2α binds between the eIF2Bβ and eIF2Bδ subunits, representing IF3 and IF4. The eIF2Bα2 dimer is hidden in this orientation. eIF2Bε contains two domains including the eIF2Bε catalytic HEAT domain that is linked by a flexible tether which was not resolved in the structure. (b) A surface representation of a model of one p-eIF2 trimer bound to eIF2B (PDB 6K72), representing the non-productive I-State complex. P-eIF2α binds between eIF2Bα and eIF2Bδ and prompts a widening of the pocket defined by substrate-binding interfaces IF3 and IF4, between the eIF2Bβ and eIF2Bδ subunits (indicated by black arrows). Steric conflict prevents eIF2 substrate from binding to the same half of the eIF2B complex as p-eIF2 inhibitor; low-affinity binding of one eIF2 molecule on the other half of the complex to an altered IF3 interface remains possible.
Extended Data Fig. 2
Extended Data Fig. 2. eIF2B deuteration over time.
Percent deuteration after (a) 10 seconds (b) 100 seconds (c) 15 minutes (d) 3 hours of deuterium exchange for every peptide in one apo eIF2B dataset. Solid colored bars indicate each eIF2B subunit, corresponding to color scheme in Fig. 1. Each horizontal line represents an individual peptide spanning the residues indicated on the x axis, with percent deuteration (not correcting for back exchange) indicated on the y axis. α-helices are indicated in blue vertical lines, and β-strands are indicated in green vertical lines, derived from apo eIF2B structure PDB 7L70. Shown are peptides from one representative experiment; all HX experiments were replicated at least 3 independent times.
Extended Data Fig. 3
Extended Data Fig. 3. Coverage and redundancy results from HDX-MS experiments.
(a) coverage and redundancy at each eIF2B residue for peptides included in all conditions of the comparative apo eIF2B vs NSs-bound eIF2B vs eIF2-P-bound eIF2B experiment. Solid colored bars indicate each eIF2B subunit, corresponding to color scheme in Fig. 1. Shown are peptides from one representative experiment; all HX experiments were replicated at least 3 independent times.
Extended Data Fig. 4
Extended Data Fig. 4. Comparison of eIF2B HDX-MS protection by NSs and 2BAct.
a,b, Representative percent deuteration difference map with overlaid time points for (a) apo versus NSs-bound eIF2B(αβγδε)2 decamers and (b) apo versus 2BAct-bound eIF2B(αβγδε)2 decamers. Positive values represent peptides that exchanged less deuterons in the 2BAct—bound state. Solid colored bars indicate each eIF2B subunit, corresponding to color scheme in Fig. 1. On each graph, timepoints are overlayed and color-coded: 10s deuteron difference mapped in red, 100s difference mapped in orange, 15 min difference mapped in cyan, 3 hr difference mapped in dark blue. Positive values represent peptides with more protection (less deuteration) in the second listed state relative to the first listed state. Significant protection is defined as multiple peptides with ∆#D greater than 0.5 deuterons; peptides without significant protection are contained within the dimmed threshold. Regions of NSs protection located at eIF2Bα effector binding site are shown in orange and purple boxes. The 2BAct effector binding site is indicated by pink boxes. The eIF2Bδ C-terminal ‘Switch-Helix’ is indicated by green boxes. (c) apo versus 2BAct-bound eIF2B(αβγδε)2 decamers and apo versus NSs-bound eIF2B(αβγδε)2 decamers difference maps plotted onto the same ∆#D axes. Timepoints are overlaid and color-coded; NSs 15 min is mapped in black, NSs 3 hr is grey, 2BAct 15 min is cyan, and 2BAct 3 hr is dark blue. Regions of NSs protection located at eIF2Bα effector binding site are shown in orange and purple numbered boxes. The eIF2Bδ C-terminal ‘Switch-Helix’ is indicated by green numbered box. Regions specifically protected by 2BAct indicated with pink numbered boxes; regions protected by both 2BAct and NSs are indicated with yellow numbered boxes. (d) Numbered regions from (c) are mapped onto eIF2B-NSs structure (PDB 7RLO) with 2BAct binding site shown. (e) Representative peptide uptake plots comparing 2BAct-bound (blue) vs NSs-bound (grey) vs apo eIF2B (black). The total number of exchanged deuterons per condition are plotted over time (n = three independent experiments) ± SD not corrected for back exchange.
Extended Data Fig. 5
Extended Data Fig. 5. EM density surrounding eIF2Bδ Switch-Helix sidechains.
Shown are EM density and atomic models of the eIF2Bδ Switch-Helix (cyan) and interacting sidechains (pink). Density zones were set to a radius of 2.5Å, and two representative views (left clearly displaying δR517 salt-bridge density and right clearly displaying δL516/δF443 rotamer density) are shown for each structure incuding: (a) eIF2-bound decameric A-state (PDB 6o81, EMD0649), (b) eIF2αP-bound decameric I-state (PDB 6o9z, EMD0664), (c) the NSs-bound decameric A-State (PDB 7RLO, EMD24235), (d) the L516A decameric I-State (PDB 8TQZ, EMD-41566), (e) the ISRIB-bound decameric A-State (PDB 7L7G, EMD7443), (f) the tetrameric state (PDB 8TQO, EMD 41510), (g) the decameric Apo eIF2B A-like state (PDB 7L70, EMD23209).
Extended Data Fig. 6
Extended Data Fig. 6. Sequence conservation of eIF2B Switch-Helix residues.
(a) Multiple sequence alignment of eIF2Bδ from indicated organisms, with Clustal color-coding. (b) Multiple sequence alignment of eIF2B Switch-Helix from indicated organisms. Secondary structure is indicated above. (c) Multiple sequence alignment of eIF2Bδ residues that interact with the eIF2B Switch-Helix from indicated organisms. (d) Multiple sequence alignment of eIF2Bα residues that interact with the eIF2Bδ Switch-Helix from indicated organisms.
Extended Data Fig. 7
Extended Data Fig. 7. Cryo-EM data analysis of the eIF2BδL516A structure.
(a) Representative micrograph showing the quality of data used for the final reconstruction of the eIF2BδL516A structure. A total of 4042 micrographs were acquired and analyzed. (b) Data processing scheme of the eIF2BδL516A structure. (c) Fourier shell correlation (FSC) plots of the 3D reconstructions of eIF2BδL516A unmasked (dark blue), masked (orange). (d) Orientation angle distribution of the eIF2BδL516A reconstruction. (e) Local resolution map of the eIF2BδL516A structure.
Extended Data Fig. 8
Extended Data Fig. 8. eIF2B δL516A mutation widens eIF2α binding pocket more than eIF2αP binding.
Overlay of atomic models of eIF2B-eIF2 (blue, PDB 6o81), eIF2B-eIF2αP (light peach, PDB 6o9z), and eIF2B δL516A (orange, PDB 8TQZ) showing widening of eIF2α binding pocket by 2.1 Å for eIF2B-eIF2αP and 4.5 Å for eIF2B δL516A.
Extended Data Fig. 9
Extended Data Fig. 9. Decamerization propensity of eIF2B Switch-Helix variants.
(a) Sedimentation velocity analytical ultracentrifugation analysis of WT and δL516A variant eIF2B. ‘1X decamer’ was assembled with a 2:1 stoichiometry of eIF2Bβγδε tetramer:eIF2Bα2 dimer. ‘2x decamer’ was assembled with a 1:1 stoichiometry of eIF2B tetramer:eIF2Bα2 dimer. Shown is one representative of two replicate experiments. (b) Sedimentation velocity analytical ultracentrifugation analysis of eIF2B(αβγδε)2 decamers with indicated point mutations. Shown is one representative of three replicate experiments. Source data
Extended Data Fig. 10
Extended Data Fig. 10. Cryo-EM data analysis of the tetrameric eIF2Bβγδε structure.
(a) Representative micrograph showing the quality of data used for the final reconstruction of the eIF2Bβγδε structure. A total of 2692 micrographs were acquired and analyzed. (b) Data processing scheme of the eIF2Bβγδε structure. (c) Fourier shell correlation (FSC) plots of the 3D reconstructions of eIF2Bβγδε unmasked (dark blue), masked (orange). (d) Orientation angle distribution of the eIF2Bβγδε reconstruction. (e) Local resolution map of the eIF2Bβγδε structure.

References

    1. Costa-Mattioli M, Walter P. The integrated stress response: from mechanism to disease. Science. 2020;368:eaat5314. doi: 10.1126/science.aat5314. - DOI - PMC - PubMed
    1. Pakos-Zebrucka K, et al. The integrated stress response. EMBO Rep. 2016;17:1374–1395. doi: 10.15252/embr.201642195. - DOI - PMC - PubMed
    1. Marciniak SJ, et al. CHOP induces death by promoting protein synthesis and oxidation in the stressed endoplasmic reticulum. Genes Dev. 2004;18:3066–3077. doi: 10.1101/gad.1250704. - DOI - PMC - PubMed
    1. Abdulkarim B, et al. A missense mutation in PPP1R15B causes a syndrome including diabetes, short stature, and microcephaly. Diabetes. 2015;64:3951–3962. doi: 10.2337/db15-0477. - DOI - PMC - PubMed
    1. Krukowski K, et al. Small molecule cognitive enhancer reverses age-related memory decline in mice. eLife. 2020;9:e62048. doi: 10.7554/eLife.62048. - DOI - PMC - PubMed

Publication types

MeSH terms

Substances