. 2024 May;20(5):566-576.
doi: 10.1038/s41589-023-01466-4. Epub 2023 Nov 9.

Checkpoint kinase 2 controls insulin secretion and glucose homeostasis

Affiliations

Checkpoint kinase 2 controls insulin secretion and glucose homeostasis

Angie Chi Nok Chong et al. Nat Chem Biol. 2024 May.

Abstract

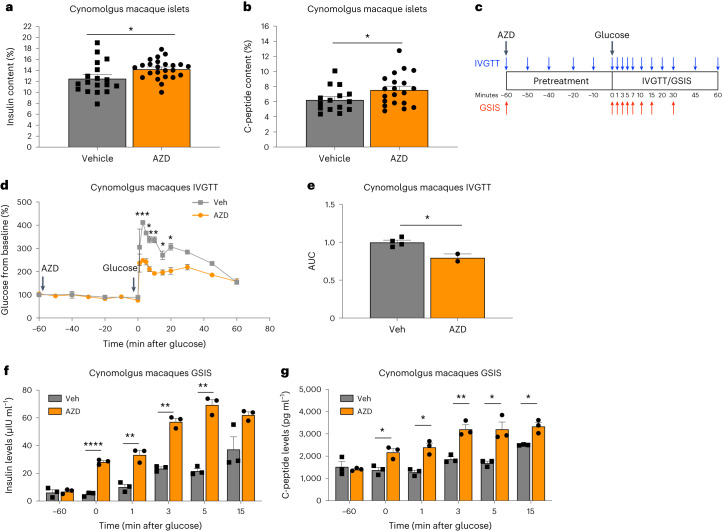
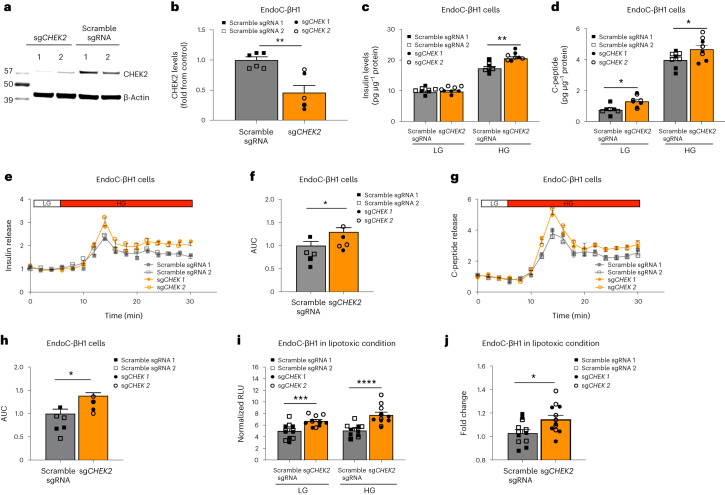
After the discovery of insulin, a century ago, extensive work has been done to unravel the molecular network regulating insulin secretion. Here we performed a chemical screen and identified AZD7762, a compound that potentiates glucose-stimulated insulin secretion (GSIS) of a human β cell line, healthy and type 2 diabetic (T2D) human islets and primary cynomolgus macaque islets. In vivo studies in diabetic mouse models and cynomolgus macaques demonstrated that AZD7762 enhances GSIS and improves glucose tolerance. Furthermore, genetic manipulation confirmed that ablation of CHEK2 in human β cells results in increased insulin secretion. Consistently, high-fat-diet-fed Chk2-/- mice show elevated insulin secretion and improved glucose clearance. Finally, untargeted metabolic profiling demonstrated the key role of the CHEK2-PP2A-PLK1-G6PD-PPP pathway in insulin secretion. This study successfully identifies a previously unknown insulin secretion regulating pathway that is conserved across rodents, cynomolgus macaques and human β cells in both healthy and T2D conditions.


Conflict of interest statement

S.C. is one of the cofounders of OncoBeat. S.C. is a consultant for Vesalius Therapeutics.

Figures

Fig. 1
Fig. 1. A focused chemical screen identified AZD7762 that increases glucose-stimulated insulin secretion of mouse and human islets.
a, Schematic diagram of the chemical screen. b, Chemical structure of AZD7762. c, Static GSIS of intact human islets in the presence of control or 1 µM AZD7762. Low glucose (LG), 2 mM glucose (P = 0.0001); High glucose (HG), 20 mM glucose (P = 0.013). n = 11 (control) and n = 22 (AZD7762) biological replicates. d,e, Dynamic GSIS (d) and AUC (e) of human pseudoislets in the presence of control or 1 µM AZD776 (P = 0.0008). n = 3 biological replicates for each group. The data were normalized to baseline. f,g, Dynamic GSCS (f) and AUC (g, P = 0.0007) of human pseudoislets in the presence of control or 1 µM AZD7762. n = 3 biological replicates. The data were normalized to baseline. h, Static GSIS of T2D human islets in the presence of control or 1 µM AZD7762. LG, 2 mM glucose (P = 0.005); HG, 20 mM glucose (P = 0.008). n = 10 (control) and n = 12 (AZD7762) biological replicates. i, Static GSCS of T2D human islets in the presence of control or 1 µM AZD7762. LG, 2 mM glucose (P = 0.001); HG, 20 mM glucose (P = 0.034). n = 16 (control) and n = 21 (AZD7762) biological replicates. j,k, Dynamic GSCS (j) and AUC (k, P = 0.022) of T2D human islets in the presence of control or 1 µM AZD7762. n = 3 biological replicates. The data were normalized to baseline. Data represent the mean ± s.e.m. For c, e, gi and k, P values of figures were calculated by two-sided Student’s t-test. Statistical significance: *P < 0.05, **P < 0.01, ***P < 0.001. Source data
Fig. 2
Fig. 2. AZD7762 improves glucose tolerance and increases insulin secretion in healthy and T2D mouse models.
af, Mice were fasted overnight before all GTT and GSIS experiments. a,b, IPGTT (a, P value: −30 min, P = 0.027; 0 min, P = 0.009; 15 min, P = 0.00003; 30 min, P = 0.0001; 60 min, P = 0.004) and AUC (b, P = 0.0001) of 8–12 weeks old male chow-fed CD-1/ICR mice treated with vehicle or 25 mg kg−1 AZD7762. n = 4 vehicle-treated mice; n = 5 AZD7762-treated mice. c, Intraperitoneal GSIS of chow-fed 8- to 12-week-old male CD-1/ICR mice treated with vehicle or 25 mg kg−1 AZD7762. n = 8 vehicle-treated mice; n = 9 AZD7762-treated mice (P value: 0 min, P = 0.043; 15 min, P = 0.022). d,e, IPGTT (d, P value: 30 min, P = 0.029) and AUC (e, P = 0.0296) of 16-week-old obese ob/ob mice treated with vehicle or 25 mg kg−1 AZD7762. n = 5 vehicle-treated mice; n = 6 AZD7762-treated mice. f, GSIS of 16-week-old ob/ob mice treated with vehicle or 25 mg kg−1 AZD7762. P value: 0 min, P = 0.016; 15 min, P = 0.01. For 0 min, n = 7 vehicle-treated mice, n = 6 AZD7762-treated mice. For 15 min, n = 15 vehicle-treated mice, n = 18 AZD7762-treated mice. For 60 min, n = 15 vehicle-treated mice, n = 16 AZD7762-treated mice. Data represent the mean ± s.e.m. P values of all figures were calculated by two-sided Student’s t-test. Statistical significance: *P < 0.05, ***P < 0.001. Source data
Fig. 3
Fig. 3. AZD7762 enhances glucose tolerance and GSIS in cynomolgus macaques.
a, Insulin secretion of cynomolgus macaque islets with 20 mM glucose in the presence of control or 1 µM AZD7762. P = 0.032. n = 18 (control) and n = 24 (AZD7762) biological replicates. b, C-peptide secretion of cynomolgus macaque islets with 20 mM glucose in the presence of control or 1 µM AZD7762. P = 0.046. n = 15 (control) and n = 20 (AZD7762) biological replicates. c, Schematics of IVGTT and GSIS experiments. d,e, Glucose levels during IVGTT (d, P value: 3 min, P = 0.0001; 5 min, P = 0.014; 7 min, P = 0.001; 10 min, P = 0.001; 15 min, P = 0.025; 20 min, P = 0.015) and AUC (e, P = 0.018) in male cynomolgus macaques (11 and 13 years old, respectively) pretreated with control vehicle or 1.6 mg kg−1 AZD7762. Vehicle-treated animals (n = 4 biological replicates), AZD7762-treated animals (n = 2 biological replicates). f, Insulin secretion during IV glucose infusion in cynomolgus macaques pretreated with vehicle or 1.6 mg kg−1 AZD7762. P value: 0 min, P = 0.00005; 1 min, P = 0.004; 3 min, P = 0.001; 5 min, P = 0.002. Vehicle-treated animals (n = 3 biological replicates), AZD7762-treated animals (n = 3 biological replicates). g, C-peptide secretion during IV glucose infusion in cynomolgus macaques receiving control vehicle or 1.6 mg kg−1 AZD7762. P value: 0 min, P = 0.018; 1 min, P = 0.011; 3 min, P = 0.008; 5 min, P = 0.032; 15 min, P = 0.037. Vehicle-treated animals (n = 3 biological replicates), AZD7762-treated animals (n = 3 biological replicates). Data represent the mean ± s.e.m. P value was calculated with two-sided Student’s t-test for all figures. Statistical significance: *P < 0.05, **P < 0.01, ***P < 0.001, ****P < 0.0001. Source data
Fig. 4
Fig. 4. Reduction of CHEK2 in human β cells increases insulin secretion.
a,b, Western blotting (a) and quantification (b) of CHEK2 in EndoC-βH1 cells carrying scrambled sgRNA or sgCHEK2. P = 0.0031. n = 6 biological replicates per group. c, GSIS of EndoC-βH1 cells carrying scrambled sgRNA or sgCHEK2. LG, 0.5 mM; HG, 20 mM (P = 0.0014). n = 8 biological replicates for each group. d, GSCS of EndoC-βH1 cells carrying scrambled sgRNA or sgCHEK2. LG, 0.5 mM (P = 0.0106); HG, 20 mM (P = 0.029). For LG, n = 7 (scrambled sgRNA) and n = 8 (sgCHEK2) biological replicates. For HG, n = 8 biological replicates per group. e,f, Dynamic GSIS (e) and AUC (f, P = 0.0116) of EndoC-βH1 pseudoislets carrying scrambled sgRNA or sgCHEK2. LG: 0.5 mM; HG: 20 mM. n = 5 biological replicates per group. The data were normalized to baseline. g,h, Dynamic GSCS (g) and AUC (h, P = 0.0277) of EndoC-βH1 pseudoislets carrying scrambled sgRNA or sgCHEK2. LG: 0.5 mM; HG: 20 mM. n = 5 biological replicates per group. The data were normalized to baseline. i,j, Nanoluciferase secretion (i, P value: LG, 0.0009; HG, 0.00005) and fold change (j, P = 0.0197) during GSIS of EndoC-βH1 nanoluciferase reporter cells carrying scrambled sgRNA or sgCHEK2 cultured in 2 mM sodium oleate. n = 12 biological replicates per group. Data represent the mean ± s.e.m. P values were calculated by mixed ANOVA. Statistical significance: *P < 0.05, **P < 0.01, ***P < 0.001, ****P < 0.0001. RLU is used as an acronym for Relative Light Unit. Source data
Fig. 5
Fig. 5. HFD Chk2/ mice show improved GSIS and glucose homeostasis.
a,b, Dynamic GSIS (a) and AUC (b, P = 0.012) of primary mouse islets from chow-fed wild-type and Chk2/ mice. n = 7 wild-type mice; n = 12 Chk2/ mice. The data were normalized to baseline. c, Fed glucose levels in 8-month-old male HFD-fed wild-type and Chk2/ mice. P = 0.00005. n = 12 wild-type mice; n = 9 Chk2/ mice. d, Fed insulin levels of 8-month-old male HFD-fed wild-type and Chk2/ mice. P = 0.034. n = 13 wild-type mice; n = 12 Chk2/ mice. e, OGTT of 8-month-old male HFD-fed wild-type and Chk2/ mice. P value: 30 min, P = 0.0138; 60 min, P = 0.036. n = 11 wild-type mice; n = 8 Chk2/ mice. f, Insulin levels during OGTT of 8-month-old male HFD-fed wild-type and Chk2/ mice. P value: 0 min, P = 0.026; 15 min, P = 0.0002. n = 10 wild-type mice, n = 6 Chk2/ mice. g, Active GLP-1 levels during OGTT of 8-month-old male HFD-fed wild-type and Chk2/ mice. n = 4 wild-type mice; n = 5 Chk2/ mice. h, Glucose levels during OGTT of 8-month-old female HFD-fed wild-type and Chk2/ mice. n = 5 wild-type mice; n = 3 Chk2/ mice. i, Insulin levels during OGTT of 8-month-old female HFD-fed wild-type and Chk2/ mice. P = 0.036. n = 15 wild-type mice; n = 8 Chk2/ mice. Mice were fasted overnight for all GTT and GSIS experiments. Data represent the mean ± s.e.m. For bi, P value was calculated with two-sided Student’s t-test. Statistical significance: *P < 0.05, ****P < 0.0001. NS, not significantly different, WT, wild type. Source data
Fig. 6
Fig. 6. Untargeted metabolomics identified that a CHEK2/pentose phosphate axis is involved in insulin secretion.
a, Heatmap of hits with VIP > 1 in untargeted metabolomics profiles. b, IPA analysis of the untargeted metabolomics profiles identified top pathways altered in 10 µM AZD7762-treated MIN6 cells in the presence of 20 mM glucose. c, G6PD activity of EndoC-βH1 cells carrying control or sgCHEK2 stimulated with 20 mM glucose. P = 0.00008. n = 4 biological replicates. d, PP2A activity of EndoC-βH1 cells carrying control or sgCHEK2 stimulated with 20 mM glucose. P = 0.0003. n = 7 biological replicates per group. e,f, Western blotting (e) and quantification (f) of phospho-PLK1 Thr210 in control and shPP2A EndoC-βH1 cells. P = 0.02 between control and PP2A KD1. P = 0.025 between control and PP2A KD2. n = 4 biological replicates per group. g, GSIS of control and shPP2A EndoC-βH1 cells in the presence of 10 µM AZD7762. P = 1.01 × 10−4 between control and PP2A KD (shPP2A) 1. P = 8.69 × 10−5 between control and PP2A KD (shPP2A) 2. n = 4 biological replicates. h, Insulin secretion response to AZD7762 of control and shPP2A EndoC-βH1 cells. P = 1.82 × 10−6 between control and PP2A KD (shPP2A) 1. P = 7.16 × 10−8 between control and PP2A KD (shPP2A) 2. n = 4 biological replicates. i, G6PD activity of control and shPLK1 EndoC-βH1 cells. P = 0.0081 between control and PLK1 KD (shPLK1) 1. P = 0.035 between control and PLK1 KD (shPLK1) 2. n = 3 biological replicates. j, GSIS of control and shPLK1 EndoC-βH1 cells. P = 0.0005 between control and PLK1 KD (shPLK1) 1. P = 0.0001 between control and PLK1 KD (shPLK1) 2. n = 4 biological replicates. k, Insulin secretion response to AZD7762 of control and shPLK1 EndoC-βH1 cells. P = 7.16 × 10−8 between control and PLK1 KD (shPLK1) 1. P = 1.82 × 10−6 between control and PLK1 KD (shPLK1) 2. n = 4 biological replicates. l, GSIS of control and shG6PD EndoC-βH1 cells. P = 0.041 between control and G6PD KD (shG6PD) 1. P = 0.0002 between control and G6PD KD (shG6PD) 2. n = 4 biological replicates. m, Insulin secretion response to AZD7762 of control and shG6PD EndoC-βH1 cells. P = 2.19 × 10−5 between control and G6PD KD (shG6PD) 1. P = 1.42 × 10−5 between control and G6PD KD (shG6PD) 2. n = 4 biological replicates. Data represent the mean ± s.e.m. For c and d, P value was calculated by mixed-model ANOVA. For fm, P value was calculated by one-way ANOVA (Dunnett’s test). Statistical significance *P < 0.05, ***P < 0.001, ****P < 0.0001. Source data
Extended Data Fig. 1
Extended Data Fig. 1. AZD7762 increases insulin secretion of β cells.
(a) Primary screening data.(b) GSIS of MIN6 cells in the presence of control or 10 µM AZD7762. NG: 0 mM glucose; HG: 20 mM glucose. n = 4 biological replicates. P-value = 0.00005. (c) Glucose-stimulated C-peptide secretion (GSCS) of MIN6 cells in the presence of control or 10 µM AZD7762. NG: 0 mM glucose; HG: 20 mM glucose. P-value = 8.87E-04. n = 4 biological replicates. (d) GSIS of EndoC-βH1 cells in the presence of 0, 1 or 10 µM AZD7762. LG: 0.5 mM glucose; HG: 20 mM glucose. P-value: LG 1 µM AZD7762, p = 0.0001; LG 10 µM AZD7762, p = 6.75E-05; HG 1 µM AZD7762, p = 0.0008; HG 10 µM AZD7762, p = 0.00578. n = 4 biological replicates. (e) GSCS of human EndoC-βH1 cells in the presence of control or 10 µM AZD7762. LG: 0.5 mM glucose (P-value = 0.002); HG: 20 mM glucose (P-value = 0.0063). n = 4 biological replicates. (f) AZD7762 increases insulin secretion of NLuc-MIN6 cells in the presence of 2 (G2), 5 (G5) (P-value = 0.004), or 11 mM (G11) (P-value = 6.20E-050.001) glucose. n = 4 biological replicates. (g) GSIS of MIN6 cells in the presence of control or 1 µM AZD7762. NG: 0 mM glucose; HG: 20 mM glucose. P-value = 0.023. n = 4 biological replicates. (h) Insulin secretion during GSIS of EndoC-βH1 cells treated with control or 1 µM AZD7762 for 24 hours. P-value = 0.00003. n = 4 biological replicates. (i) Insulin secretion during a 2-hour period in the presence of control or 10 µM AZD7762. P-value = 0.002. n = 4 biological replicates. For b, c, e, g–i, P-value of figures were calculated by two-sided Student’s t-test. For d & f, P-value was calculated by one-way ANOVA (Dunnett′s test). Data represent the Mean ± SEM. Statistical significance p < 0.05, *; p < 0.01, **; p < 0.001, ***, p < 0.0001, ****; n.s. for not significantly different. Source data
Extended Data Fig. 2
Extended Data Fig. 2. AZD7762 increases insulin secretion, but not GCG and SST from human islets.
(a and b) Dynamic GSCS (a) and AUC (b) (P-value = 0.047) of human pseudoislets cultured in sodium oleate in the presence of control or 1 µM AZD7762. n = 6 (control) and n = 9 (AZD7762) biological replicates. The data was normalized to baseline. (c) SST secretion during GSIS of intact human islets in the presence of control or 1 µM AZD7762. n = 4 biological replicates. (d) glucagon secretion during GSIS of intact human islets in the presence of control or 1 µM AZD7762. P-value = 0.005. n = 4 biological replicates. (e and f) Immunostaining (e) and the quantification (f) of insulin staining in intact human islets treated with control or 1 µM AZD7762. n = 33 (control) and n = 53 (AZD7762) biological replicates. (g and h) Immunostaining (g) and the quantification (h) of glucagon staining in intact human islets treated with control or 1 µM AZD7762. n =13 (control) and n = 9 (AZD7762) biological replicates. (i and j) Immunostaining (i) and quantification (j) of SST staining in intact human islets treated with control or 1 µM AZD7762. n = 13 (control) and n = 16 (AZD7762) biological replicates. (k and l) Immunostaining (k) and the quantification (l) of Ki67 staining in intact human islets treated with control or 1 µM AZD7762. n = 10 (control) and n = 12 (AZD7762) biological replicates. For e, g, i and k, Scale bar: 100 μm. Data represents the Mean ± SEM. For b-d, f, h, j & l, P-value of figures were calculated by two-sided Student’s t-test. Statistical significance *p < 0.05, **p < 0.01, n.s. for not significantly different. Source data
Extended Data Fig. 3
Extended Data Fig. 3. Low-dose AZD7762 does not cause hypoglycemia in mice.
(a) IPGTT of 8–12 weeks old male chow-fed CD-1/ICR vehicle- or 12 mg/kg AZD7762-treated mice. P-value: 15 min, p = 1.00E-05; 30 min, p = 8.00E-06; 60 min, p = 0.006. n = 20 (vehicle); n = 14 (AZD7762). (b) GSIS of chow-fed 8–12 weeks old male CD-1/ICR vehicle- or 12 mg/kg AZD7762-treated mice. P-value: 0 min, p = 0.002; 15 min, p = 0.017. n = 25 (vehicle); n = 32 (AZD7762). (c) Glucose levels of chow-fed 8–12 weeks old male CD-1/ICR vehicle- or 12 mg/kg AZD7762-treated mice without glucose injection. n = 8 (vehicle); n = 7 (AZD7762). (d) IPGTT of 8–12 weeks old male chow-fed CD-1/ICR vehicle- or 12 mg/kg AZD7762-treated mice 24 hours before the experiment. n = 8 (vehicle); n = 7 (AZD7762). (e) HOMA-IR of vehicle- or 25 mg/kg AZD7762-treated mice. Left: 8–12 weeks old male chow-fed CD-1/ICR mice. n = 10 mice per group. Right: 16-week-old male obese ob/ob vehicle- or 25 mg/kg AZD7762-treated mice. n = 9 mice per group. (f) Active GLP-1 levels during IPGTT of chow-fed 8–12 weeks old male CD-1/ICR vehicle- or 12 mg/kg AZD7762-treated mice. n = 11(vehicle); n = 12 (AZD7762). (g) Total GIP levels during IPGTT of chow-fed 8–12 weeks old male CD-1/ICR vehicle- or 12 mg/kg AZD7762-treated mice. P-value: 0 min, p = 0.008; 15 min, p = 0.001. n = 15 (vehicle); n = 12 (AZD7762). (h) SST secretion during GSIS of intact mouse islets with control or 1 µM AZD7762. n = 4 biological replicates. (i) glucagon secretion during GSIS of intact mouse islets in the with control or 1 µM AZD7762. n = 4 biological replicates. (j) Glucose levels during insulin tolerance test of 8-month-old male chow-fed wildtype and Chk2−/− mice. n = 4 (wildtype), n = 5 (Chk2−/−). Mice were fasted overnight for GTT and GSIS experiments. Data represent the Mean ± SEM. For a-e & h-i, P-value were calculated by two-sided Student’s t-test. Statistical significance *p < 0.05, **p < 0.01, n.s. for not significantly different. Source data
Extended Data Fig. 4
Extended Data Fig. 4. CHEK2 mediates the effect of AZD7762 on insulin secretion.
(a) Total insulin levels in EndoC-βH1 cells carrying scramble sgRNA or sgCHEK2. n = 8 biological replicates. (b) Quantitative RT-PCR for gene expression of AZD7762 off-target genes knockdown by shRNA in EndoC-βH1 cells. n = 3 biological replicates. Gene expression was normalized to that of b-Actin and presented as fold changes (± SEM) against control expression. (c) NLuc secretion of NLuc-EndoC-βH1 cells carrying shRNA targeting AZD7762 off-targets during GSIS. n = 3 biological replicates. (d) Insulin secretion response to AZD7762 in control or sgCHEK2 EndoC-βH1 cells. P-value: Control vs CHEK2 KO #1, p = 0.003; Control vs CHEK2 KO #2, p = 0.012. n = 3 biological replicates. (e) Left: GSIS of Chk2−/− mouse islets in the presence of control or 1 µM AZD7762. n = 16 (control) and n = 15 (AZD7762) biological replicates. Right: Insulin secretion response to AZD7762 in wildtype or Chk2−/− mouse islets in the presence of control or 1 µM AZD7762. P-value = 0.00001. n = 26 (wildtype) and n = 17 (Chk2−/−) biological replicates. (f) Quantitative RT-PCR for CHEK2 expression in control (KO) and CHEK2 KO-overexpressed (KO+OE) EndoC-βH1 cells. P-value = 0.000597. n = 3 biological replicates. Gene expression was normalized to that of b-Actin and presented as fold changes (± SEM) against control expression. (g) GSIS of control (KO) and CHEK2 KO-overexpressed (KO+OE) EndoC-βH1 cells. P-value = 0.04. n = 3 biological replicates. Data represent the Mean ± SEM. For a, P-values of figures were calculated mixed ANOVA. For b-c, P-values of figures were calculated by one-sided Student’s t-test. For d, P-value of figures were calculated by one-way ANOVA (Dunnett′s test). For e-g, P-value of figures were calculated by two-sided Student’s t-test. Statistical significance *p < 0.05, **p < 0.01, ***p < 0.001, n.s. for not significantly different. Source data
Extended Data Fig. 5
Extended Data Fig. 5. HFD Chk2−/− mice do not exhibit changes in insulin sensitivity or islet cellular composition and histology.
(a) Static GSIS of pancreatic islets isolated from 8-month-old HFD-fed wildtype and Chk2−/− mice. LG: 2 mM; HG: 20 mM. P-value = 0.008. n = 31 wildtype mice; n = 22 Chk2−/− mice. (b) The percent of islet area per pancreatic section in 8-month-old male HFD-fed wildtype and Chk2−/− mice. n = 31 wildtype mice; n = 22 Chk2−/− mice. (c, d and e) Immunostaining (c) and the quantification of insulin (d) and glucagon (e) staining in pancreatic islets (outlined by dotted line) of 8-month-old male HFD-fed wildtype and Chk2−/− mice. For (d), n = 4 wildtype mice; n = 7 Chk2−/− mice per group. For (e), n = 4 wildtype mice; n = 4 Chk2−/− mice per group. Arrows indicate the localization of cells expressing respective markers: α-cells (red) and β-cells (green). (f, g and h) Immunostaining (f) and the quantification of SST (g) and PP (h) staining in pancreatic islets (outlined by dotted line) of 8-month-old male HFD-fed wildtype and Chk2−/− mice. For (g), n = 6 wildtype mice; n = 8 Chk2−/− mice. For (h), n = 5 wildtype mice; n = 7 Chk2−/− mice. Arrows indicate the localization of cells expressing respective markers: δ-cells (red) and γ-cells (green). (i and j) Immunostaining (i) and the quantification of Ngn3 (j) staining in pancreatic islets (outlined by dotted line) of 8-month-old male HFD-fed wildtype and Chk2−/− mice. n = 5 wildtype mice; n = 6 Chk2−/− mice. Arrows indicate the localization of cells expressing NGN3 (green). For c, f and i, Scale bar: 100 μm. Data represents the Mean ± SEM. All P-value was calculated with two-sided Student’s t-test. Statistical significance **p < 0.01, n.s. for not significantly different. Source data
Extended Data Fig. 6
Extended Data Fig. 6. The CHEK2-PP2A-PLK1-G6PD-PPP pathway modulates insulin secretion in β cells.
(a) PLS-DA scores plot of metabolomic profiles of MIN6 cells. MIN6 cells were starved in 0 mM glucose for 1 hour, and then in 0 mM glucose for an additional 1 hour, then stimulated with either 0 mM or 20 mM glucose for 30 minutes in the presence of 0 or 10 µM of AZD7762 throughout the experiment. (6 components, R2Xcum = 0.919, R2Ycum = 0.987, Q2cum=0.882). (b) G6PD activity in MIN6 cells in the presence of control or 10 µM AZD7762. n = 3 biological replicates. P-value = 0.034. (c) Cytosolic NADPH/NADP levels of MIN6 cells in the presence of control or 10 µM AZD7762. P-value = 0.04. n = 3 (control) and n = 5 (AZD7762) biological replicates. (d) G6PD activity in EndoC-βH1 cells treated with 10 µM AZD7762. P-value = 0.000994. n = 6 biological replicates. (e) Schematic representation of the CHEK2-PP2A-PLK1-G6PD-PPP pathway in insulin secretion. (f) Correlation matrix for bulk RNA-seq on control and 10 µM AZD-treated EndoC-βH1 cells. Control: D1-D3. AZD: A1-A3. (g) Volcano plot of differentially expressed genes for bulk RNA-seq on control and 10 µM AZD-treated EndoC-βH1 cells. For Extended For b-d, P-value was calculated by two-sided Student’s t-test. Data represent the Mean ± SEM. Statistical significance *p < 0.05, ***p < 0.001. Source data

References

    1. Campbell JE, Newgard CB. Mechanisms controlling pancreatic islet cell function in insulin secretion. Nat. Rev. Mol. Cell Biol. 2021;22:142–158. - PMC - PubMed
    1. Prentki M, Matschinsky FM, Madiraju SRM. Metabolic signaling in fuel-induced insulin secretion. Cell Metab. 2013;18:162–185. - PubMed
    1. Kalwat MA, Cobb MH. Mechanisms of the amplifying pathway of insulin secretion in the β cell. Pharmacol. Ther. 2017;179:17–30. - PMC - PubMed
    1. Jensen MV, et al. Metabolic cycling in control of glucose-stimulated insulin secretion. Am. J. Physiol. Endocrinol. Metab. 2008;295:E1287–E1297. - PMC - PubMed
    1. Westermeier F, et al. Gluconeogenic enzymes in β-cells: pharmacological targets for improving insulin secretion. Trends Endocrinol. Metab. 2019;30:520–531. - PubMed

Publication types

MeSH terms