. 2023 Dec;55(12):2189-2199.
doi: 10.1038/s41588-023-01551-3. Epub 2023 Nov 9.

Circular extrachromosomal DNA promotes tumor heterogeneity in high-risk medulloblastoma

Affiliations

Circular extrachromosomal DNA promotes tumor heterogeneity in high-risk medulloblastoma

Owen S Chapman et al. Nat Genet. 2023 Dec.

Abstract

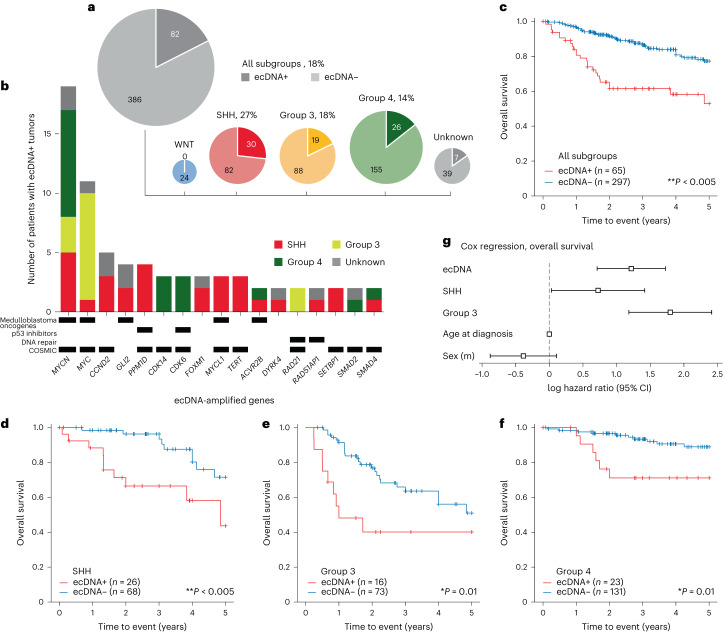
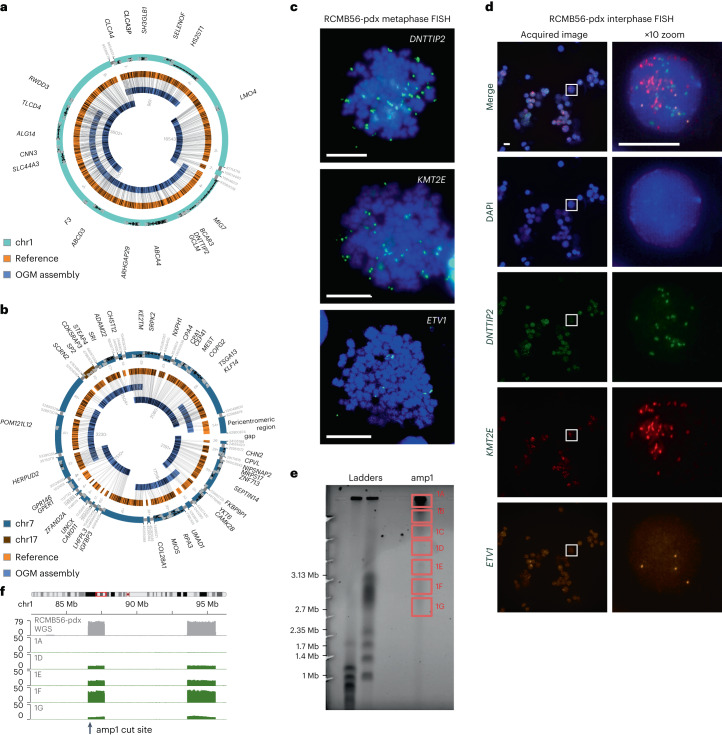
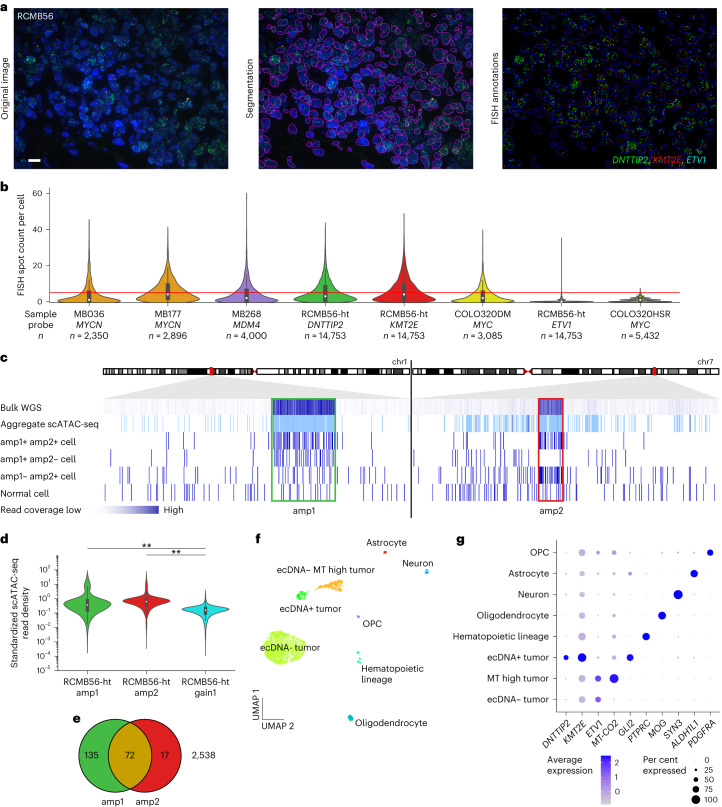
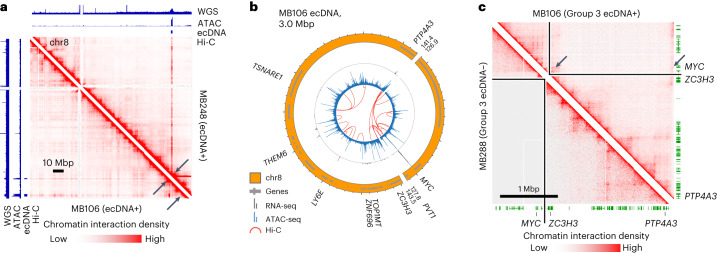
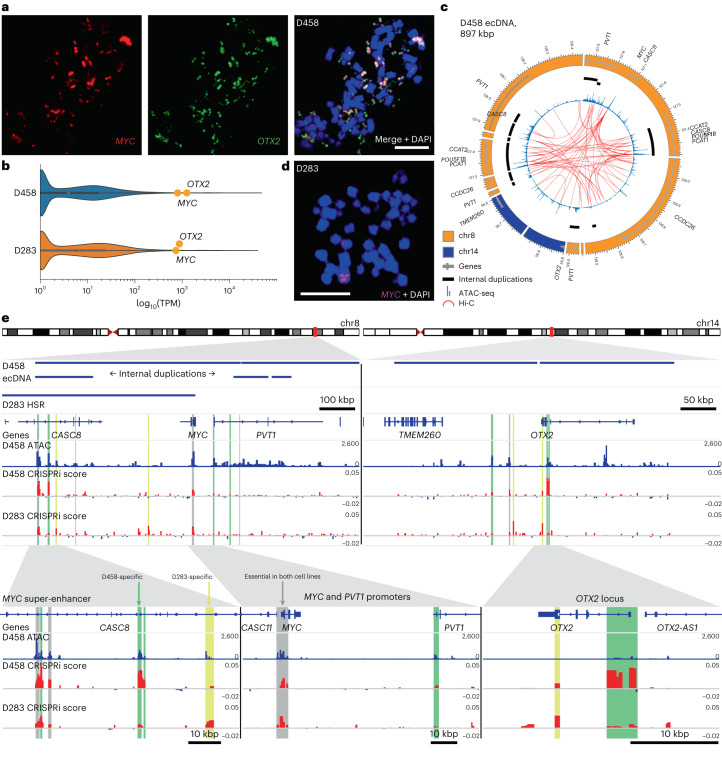
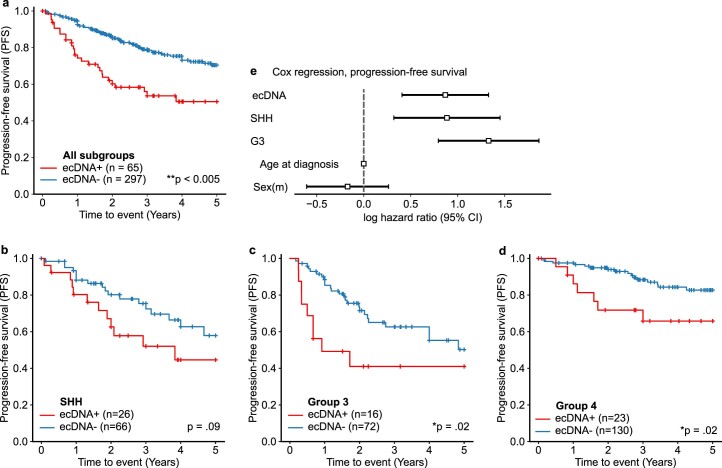
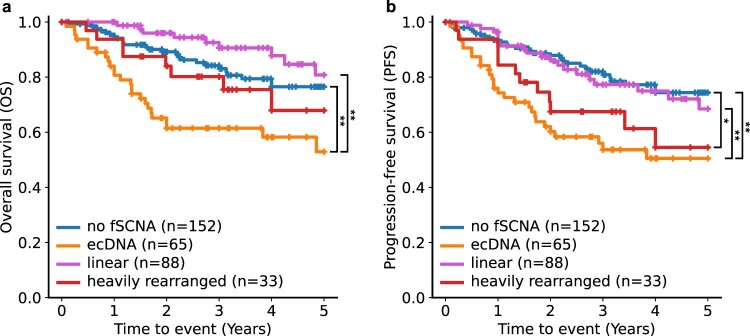
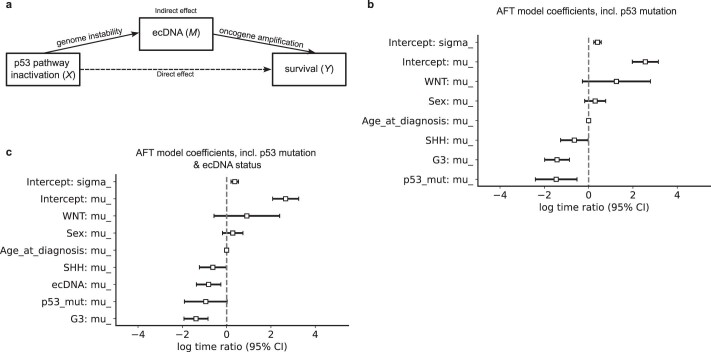
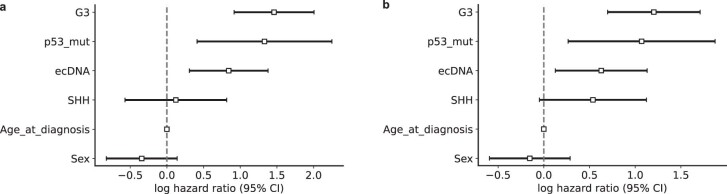
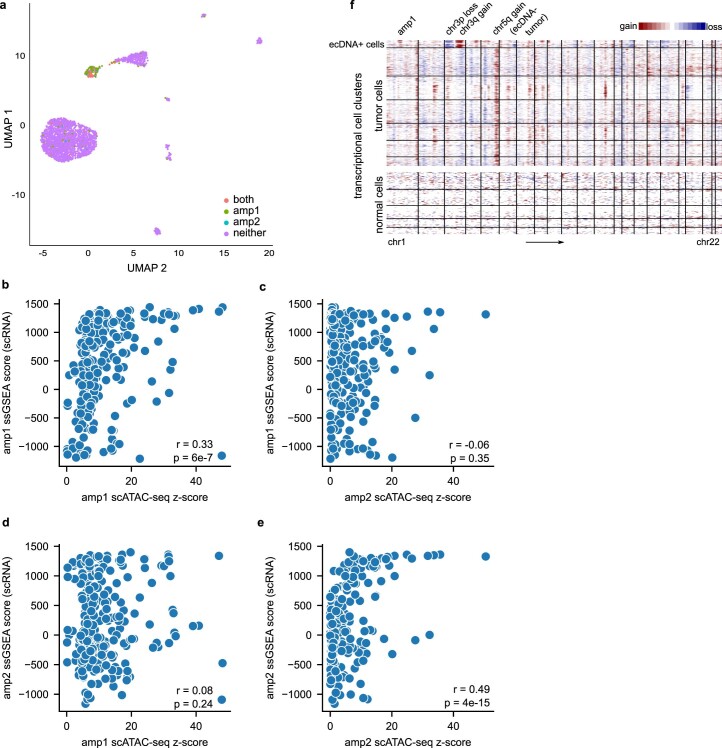
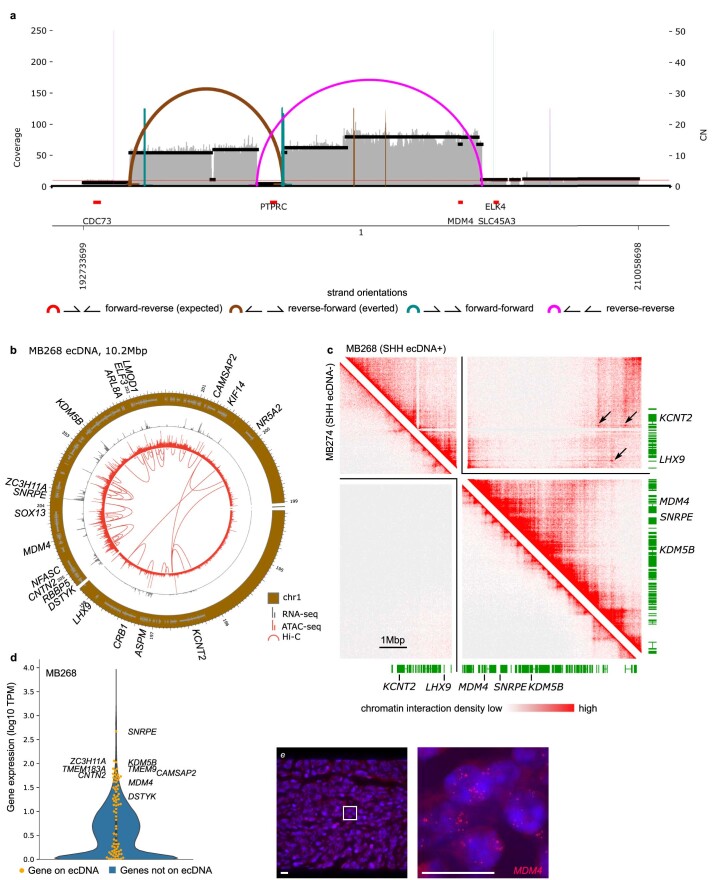
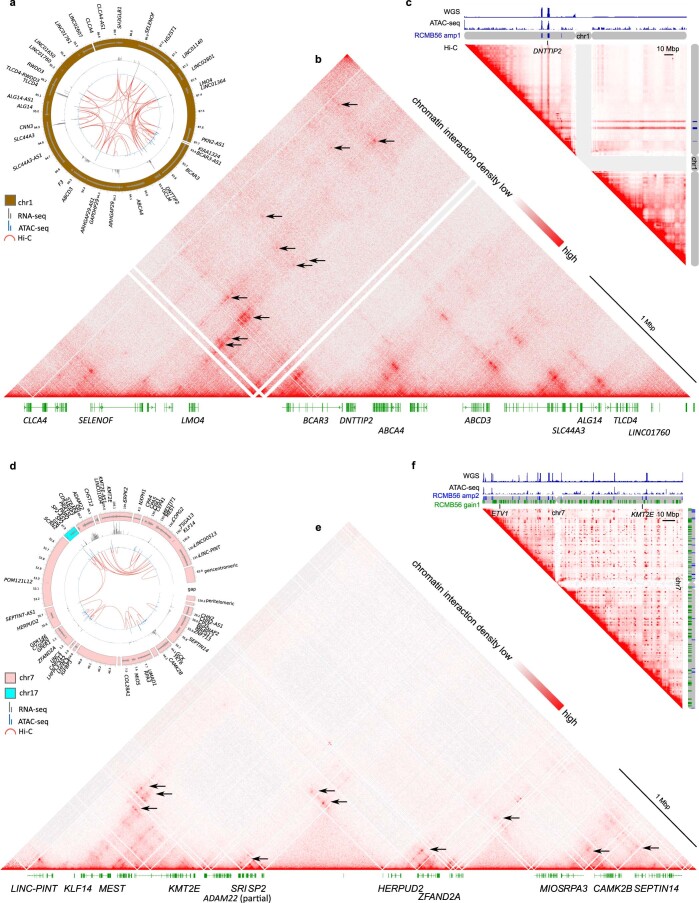
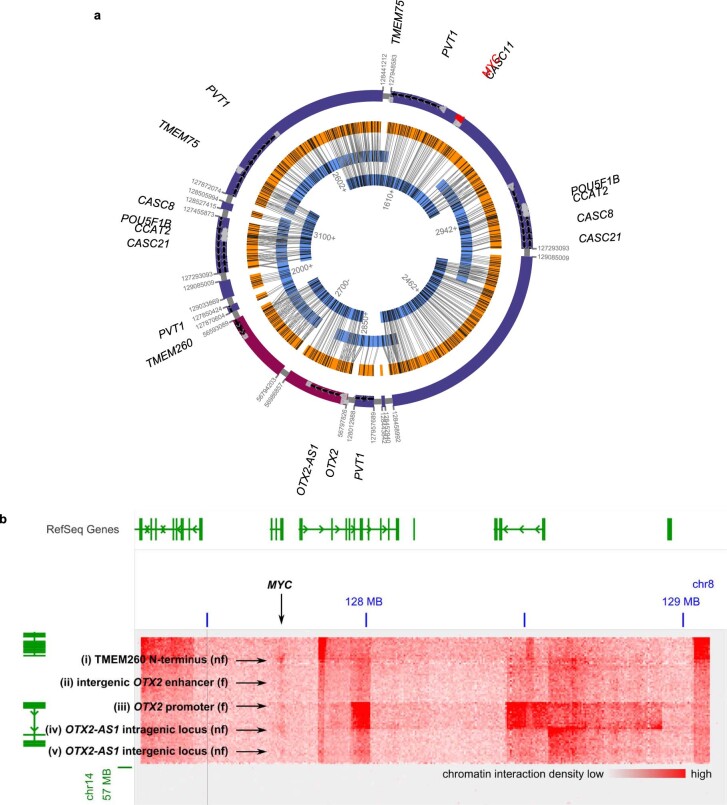
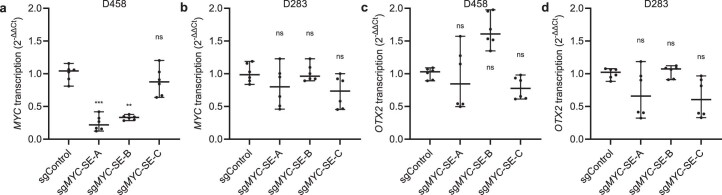
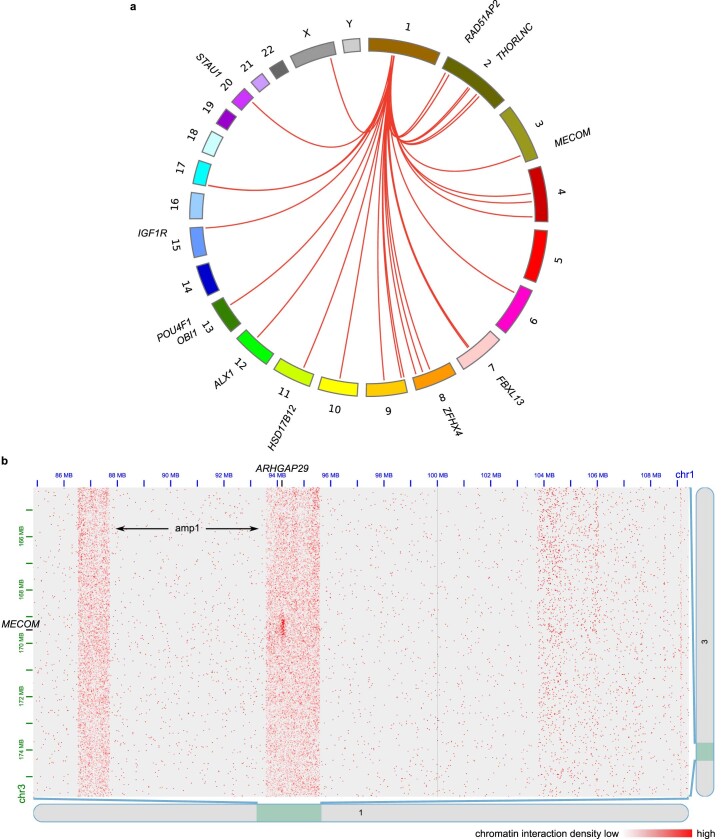
Circular extrachromosomal DNA (ecDNA) in patient tumors is an important driver of oncogenic gene expression, evolution of drug resistance and poor patient outcomes. Applying computational methods for the detection and reconstruction of ecDNA across a retrospective cohort of 481 medulloblastoma tumors from 465 patients, we identify circular ecDNA in 82 patients (18%). Patients with ecDNA-positive medulloblastoma were more than twice as likely to relapse and three times as likely to die within 5 years of diagnosis. A subset of tumors harbored multiple ecDNA lineages, each containing distinct amplified oncogenes. Multimodal sequencing, imaging and CRISPR inhibition experiments in medulloblastoma models reveal intratumoral heterogeneity of ecDNA copy number per cell and frequent putative 'enhancer rewiring' events on ecDNA. This study reveals the frequency and diversity of ecDNA in medulloblastoma, stratified into molecular subgroups, and suggests copy number heterogeneity and enhancer rewiring as oncogenic features of ecDNA.


Conflict of interest statement

The authors declare the following competing interests: H.Y.C. is a co-founder of Accent Therapeutics, Boundless Bio, Cartography Biosciences, Orbital Therapeutics and is an advisor of 10x Genomics, Arsenal Biosciences, Chroma Medicine and Spring Discovery. P.S.M. is a co-founder, chairs the scientific advisory board (SAB) and has equity interest in Boundless Bio. P.S.M. is also an advisor with equity for Asteroid Therapeutics and is an advisor to Sage Therapeutics. V.B. is a co-founder, consultant, SAB member and has equity interest in Boundless Bio and Abterra. The terms of this arrangement have been reviewed and approved by the University of California, San Diego in accordance with its conflict of interest policies. J.L. is a part-time consultant for Boundless Bio. The terms of this arrangement have been reviewed and approved by the University of California, San Diego in accordance with its conflict of interest policies. J.T.L. is an employee of Boundless Bio. His employment began after his contributions to the manuscript. The remaining authors declare no competing interests.

Figures

Fig. 1
Fig. 1. The landscape of ecDNA in medulloblastoma patient tumors.
a, Presence of ecDNA by molecular subgroup across 468 tumors from patients with medulloblastoma. b, A subset of recurrently (n ≥ 2) amplified genes on ecDNA in this patient cohort. p53 inhibitors: negative regulators of p53 pathway activity; COSMIC: genes listed as Tier 1 or Tier 2 of the COSMIC Cancer Gene Census. c, Kaplan–Meier curve depicting five-year overall survival in the patient cohort stratified by the presence of ecDNA in tumors. P = 8.6 × 10–6. df, Kaplan–Meier curves indicating overall survival for SHH (P = 4.8 × 10–3) (d), Group 3 (P = 0.01) (e) and Group 4 (P = 0.01) (f) subgroups, stratified by ecDNA presence. P values for cf were derived from two-sided log-rank test without correction for multiple hypotheses. g, Log hazard ratios for ecDNA status, medulloblastoma subgroup, age and sex estimated by Cox regression on overall survival. Sample size was n = 352 observations. Data are presented as maximum likelihood estimate (MLE) ±95% confidence intervals.
Fig. 2
Fig. 2. Distinct high-copy extrachromosomal amplifications coexist in a SHH medulloblastoma tumor.
a, Assembly of the high-copy focal amplification amp1 from WGS and OGM of DNA from the RCMB56-pdx tumor. All breakpoints in the assembly are supported by both data types. b, Assembly of the high-copy focal amplification amp2 from the same data. All junctions are supported except a peritelomeric region adjacent to the gap, which was inferred from WGS discordant reads only. c, Metaphase FISH microscopy targeting amplified DNTTIP2 (amp1), KMT2E (amp2) and ETV1 (gain1). Images are representative of 12, 18 and 5 stained metaphase cells, respectively. Spots outside the chromosome boundaries (blue) indicate extrachromosomal amplifications. d, Interphase FISH microscopy for the same markers confirms co-amplification of all three genes on distinct amplicons. Representative image from a series of 27 images. Boxes (left) are magnified (right). Scale bars in cd, 10 μm. e, Pulsed-field electrophoresis gel of DNA from RCMB56-pdx, generated by CRISPR-CATCH. DNA was cut using sgRNA targeting amp1, then fractionated by size through the gel. f, Sequencing coverage of the fractions indicated in e at the amp1 locus. Gray, bulk WGS; green, sgRNA targeting amp1. Amp1 is most enriched in band 1F, consistent with its 3.2 Mbp assembly length. Source data
Fig. 3
Fig. 3. Single-cell analysis reveals a distinct tumor cell population with high-copy ecDNA amplification.
a, Quantitative FISH image analysis of formalin-fixed paraffin-embedded (FFPE) tissue of the SHH medulloblastoma tumor RCMB56-ht. Representative image of 45 regions of one FFPE tissue slide. Scale bar, 10 μm. b, Distributions of FISH spot count per cell for amplified marker genes. MB036, MB177 and MB268 are SHH, Group 4 and SHH subgroup primary tumors. COLO320DM and COLO32HSR are positive and negative controls with isogenic extrachromosomal or intrachromosomal MYC amplifications, respectively. Red line indicates spot count = 5, the threshold used to classify amplified cells. Bar centers represent medians; bars indicate the interquartile range (IQR); and the whiskers extend to Q3 + 1.5 × IQR and Q1 – 1.5 × IQR. c, Read coverage at amp1 and amp2 loci in RCMB56-ht using various sequencing modalities. Each track is scaled independently. d, Standardized snATAC-seq read depth (z-scores) at the amp1, amp2 and gain1 regions of n = 2,762 RCMB56-ht cells. Bar centers represent medians; bars indicate the IQR; and the whiskers extend to Q3 + 1.5 × IQR and Q1 – 1.5 × IQR. Two-sided Mann–Whitney test, **P < 0.005. e, Number of cells in RCMB56-ht with significantly enriched read depth of amp1, amp2 or both. f, Uniform manifold approximation and projection (UMAP) projection of cell clusters detected in RCMB56-ht snRNA + ATAC-seq data using weighted nearest neighbors clustering. Cell clusters have been labeled based on overexpression of cell type-specific genes. g, Expression of marker genes across cell clusters of RCMB56-ht. OPC, oligodendrocyte precursor cell.
Fig. 4
Fig. 4. Chromatin interactions with MYC are rewired in a Group 3 medulloblastoma.
a, WGS, ATAC-seq and Hi-C read coverage of chromosome 8 in MYC-amplified primary tumors MB248 (top right) and MB106 (bottom left). Arrows indicate low-copy ecDNA amplifications of MYC in both samples. Genomic tracks scaled independently. b, Reconstruction of the MB106 ecDNA from WGS. Tracks (outer to inner): genome sequence, transcriptome (RNA-seq), chromatin accessibility (ATAC-seq), chromatin interactions (Hi-C). c, The Hi-C interactome of MB106 ecDNA (top right) contains enhancer–promoter interactions (arrows) not visible in an unrearranged medulloblastoma genome (bottom left).
Fig. 5
Fig. 5. Enhancer rewiring in medulloblastoma ecDNA affects cell proliferation.
a, Confocal FISH microscopy of MYC and OTX2 on a D458 metaphase cell. Representative image of six metaphase cells. Scale bar, 10 μm. b, Gene transcription of all protein-coding genes in D458 and D283 from publicly available data in DepMap. Medulloblastoma Group 3 oncogenes MYC and OTX2 are highlighted. TPM, transcripts per million. c, Chromatin accessibility and interactions mapped onto the D458 amplicon. Tracks from outer to inner: genome sequence, internally duplicated sequences, chromatin accessibility, chromatin interactions. d, FISH in a metaphase spread of a D283 nucleus shows homogeneously staining region (HSR) chromosomal MYC amplification. Representative image of 11 metaphase cells. Scale bar, 10 μm. e, Pooled CRISPRi screen in medulloblastoma cell lines D458 and D283 targeting all accessible loci on the D458 ecDNA. Tracks from top to bottom: D458 ecDNA-amplified loci; D283 HSR-amplified loci; genes; D458 chromatin accessibility; CRISPRi essentiality scores for D458 and D283 generated by CRISPR-SURF. Vertical highlighted bars indicate accessible loci that are significantly depleted at T21 relative to T0 and are colored by cell line specificity. Gray: essential in D458 and D283 with no significant difference; green: essential in D458 relative to D283; yellow: essential in D283 relative to D458. Significance determined by MAGeCK MLE permutation test adjusted for false discovery rate (q < 0.05).
Extended Data Fig. 1
Extended Data Fig. 1. Progression-free survival of the medulloblastoma patient cohort.
(a) Kaplan-Meier curve depicting 5-year progression-free survival (PFS) in the patient cohort stratified by presence of extrachromosomal DNA (ecDNA) in patient tumors. p = 1.2e-4. (b-d) Kaplan-Meier curves indicating PFS for SHH (b, p = 0.09), Group 3 (c, p = 0.02), and Group 4 (d, p = 0.02) subgroups, stratified by ecDNA presence. All p-values derived from two-sided log-rank test; no adjustment was performed for multiple hypotheses. (e) Log hazard ratios for ecDNA status, medulloblatoma subgroup, age and sex estimated by Cox proportional hazards regression on PFS. Sample was n = 322 observations. Bars indicate 95% confidence intervals.
Extended Data Fig. 2
Extended Data Fig. 2. Patient cohort survival by genomic amplification class.
Kaplan-Meier curves indicating (a) overall survival and (b) progression-free survival for n = 338 medulloblastoma patients, stratified by the amplifications present in the patient tumors. Patients with ecDNA amplification had significantly worse overall and progression-free survival compared to those with linear amplifications and compared to those without focal somatic copy number amplification (fSCNA). * p < 0.05; ** p < 0.005.
Extended Data Fig. 3
Extended Data Fig. 3. Mediation links ecDNA to known prognostic markers.
Log-normal accelerated failure time (AFT) regression models estimating relative time to progression or death of n = 340 patients. (a) Model diagram of proposed mediation by ecDNA of the effect of TP53 mutation on survival. According to this model, TP53 inactivation generates genome instability, facilitating the formation of ecDNA, which then affects survival. (b) Forest plot of μ coefficients (log time ratios) of AFT model including age, sex, subgroup and TP53 mutation status as covariates. The estimate μp53_mut = −1.5 indicates 1-exp(μp53_mut) = 77% reduction in expected survival time for medulloblastoma patients with TP53-mutant tumors. (c) μ coefficients of AFT model including ecDNA as an additional covariate estimates 56% reduction in survival time for patients with ecDNA-positive (ecDNA+) tumors and an insignificant and reduced coefficient TP53 for mutation, indicating partial mediation by ecDNA of the effect of TP53 mutation on survival. Data in (b) and (c) are presented as maximum likelihood estimate (MLE) +/− 95% confidence intervals.
Extended Data Fig. 4
Extended Data Fig. 4. Estimated hazards of clinical and molecular features on medulloblastoma patient survival.
Forest plots of β coefficients (log hazard ratios) of Cox Proportional Hazards models fitted on n = 322 patients using L2 ridge regression to control instability due to collinearity. WNT subgroup patients were excluded due to perfect separation. Log hazard estimates are relative to Group 4 and female patients. Log hazard ratios for (a) OS and (b) PFS of Cox models including age, sex, subgroup, ecDNA and TP53 mutation as covariates. Data are presented as maximum a posteriori (MAP) estimate with a Gaussian prior (L2 regularization) +/− 95% confidence intervals.
Extended Data Fig. 5
Extended Data Fig. 5. Transcriptional and accessible chromatin features of ecDNA-containing cells from the RCMB56 primary tumor.
(a) UMAP projection of RCMB56-p0 cells by transcriptional and accessible chromatin similarity. Cells are colored to indicate whether high-copy amplification was detected in snATAC-seq data at the amp1 or amp2 loci. Cells carrying one or both amplifications are enriched in a small transcriptionally distinct cluster of cells. (b-e) Correlations between copy number at the amplified locus (z-scores) and transcriptional activity of amplified genes (ssGSEA scores). Copy number of amp1 is associated with transcription of amp1-amplified genes, but not with transcription for amp2-amplified genes. Conversely, copy number of amp2 is associated with amp2-amplified, but not amp1-amplified, gene expression. p-values are derived from two-sided Student’s t-test; no adjustment was performed for multiple hypotheses. (f) Genome-wide copy number estimation of normal and tumor single cells in RCMB56-ht. The ecDNA+ tumor cell cluster is distinguished by gain of chr1 at the amp1 locus, gain of chr3q, loss of chr3p, and no copy number change to chr5q. Amp2 (chr7 and chr17) is not readily visible at the resolution afforded by CNV estimation from single-cell transcription at this sequencing depth.
Extended Data Fig. 6
Extended Data Fig. 6. Sequence and conformation of the MB268 ecDNA.
(a) AmpliconArchitect resolves a circular structure composed of 3 segments of chr1 from short paired-end reads. (b) RNA-seq, ATAC-seq and Hi-C interactions mapped onto the ecDNA sequence. Amplified oncogenes include MDM4, a TP53 pathway inhibitor frequently amplified on ecDNA of cancers of various types. Chromatin interactions spanning breakpoints target accessible regions at the LHX9 and KCNT2 loci, but neither gene is expressed. (c) Hi-C interaction density mapped onto the ecDNA sequence. Long-range chromatin interactions spanning breakpoint junctions are indicated by arrows. (d) Gene expression in the MB268 primary tumor. All ecDNA-amplified genes are indicated by the orange swarmplot; highly expressed genes are labelled. The violin plot indicates a kernel density estimate of the distribution of expression of all genes in MB268. (e) FISH of MDM4 in the MB268 primary tumor confirms extrachromosomal amplification of MDM4. Representative image of 18 regions of 1 FFPE tissue slide. Scale bar is 10 μm.
Extended Data Fig. 7
Extended Data Fig. 7. Sequence and conformation of the amp1 and amp2 high-copy amplifications in RCMB56-pdx cells.
(a) Transcription (RNA-seq, grey), accessible chromatin (ATAC-seq, blue), and chromatin interactions (Hi-C, red arcs) mapped onto the amp1 assembly (outer track, brown). Chromatin interactions occur across a structural breakpoint between accessible loci near highly-expressed genes such as DNTTIP2. (b) Chromatin interaction density map of the amp1 assembly. Arrows indicate putative enhancer rewiring events, or chromatin loops which span a breakpoint on the amp1 assembly. (c) Chromatin interaction density map of chr1. Dark stripes indicate that the ecDNA locus more frequently interacts with the rest of the genome, an indicator of high-copy focal amplification. (d) Transcription, accessible chromatin, and chromatin interactions mapped onto the amp2 assembly. The gap in the assembly is adjacent to pericentromeric and peritelomeric loci. (e) Chromatin interaction density map of the amp2 assembly. Putative enhancer hijacking events are again indicated by arrows. The two ends of this assembly do not interact (top of the triangle), suggesting that they are spatially distant in the cell. (f) Chromatin interaction map of chr7. The ‘checkerboard’ pattern reflects copy number amplification of 2 mutually exclusive structural variants amp2 and gain1, which may have originated from the same chromothriptic event.
Extended Data Fig. 8
Extended Data Fig. 8. Sequence and conformation of the D458 ecDNA.
(a) Reconstruction of the D458 ecDNA from OGM and WGS data. All junctions are supported by WGS discordant and optical genome mapping reads. (b) Chromatin interaction heatmap between co-amplified segments of chr8 and chr14 on the D458 ecDNA. Notable ectopic interchromosomal interactions are indicated here and in Fig. 4f. f: functional, as determined by a significant and D458-specific effect on cell proliferation upon CRISPRi inhibition (Fig. 4g); nf: not identified as functional in the same pooled CRISPRi screen.
Extended Data Fig. 9
Extended Data Fig. 9. A co-amplified enhancer on the D458 ecDNA promotes MYC expression.
Relative expression of MYC (a-b), and OTX2 (c-d), measured by qPCR (2−ΔΔCt), in D458 and D283 cell lines upon CRISPRi targeting of an accessible locus within a known MYC superenhancer which promotes D458 proliferation (see also Fig. 4h). sgNT: nontargeting control; sgMYC-SE-A-C: sgRNAs targeting the MYC enhancer at D458_peak_30782, positions chr8:127330655, chr8:127330840, and chr8:127330927 (hg38) respectively. qPCR was performed on all guides in triplicate; each technical replicate is shown. Bars represent median +/− 95% CI. ** adjusted p = 0.002; *** adjusted p = 0.0008; one-sided nested ANOVA with Dunnett’s correction.
Extended Data Fig. 10
Extended Data Fig. 10. The RCMB56 amp1 ecDNA interacts with chromosomal gene loci.
(a) Interchromosomal chromatin interactions detected by FitHiC2 between amp1 and other chromosomes. Interactions mapping to a gene locus are labelled. (b) Interaction density map between segments of chr1 and chr3, rendered in Juicebox. Vertical stripes indicate increased contact density between the ecDNA and chr3 over background interactions between chr1 and chr3.

Comment in

Similar articles

  • Defining the Role of Extrachromosomal DNA Amplifications in Medulloblastoma.
    Zhao D, Verhaak RGW. Zhao D, et al. Cancer Res. 2024 Feb 15;84(4):515-516. doi: 10.1158/0008-5472.CAN-23-4025. Cancer Res. 2024. PMID: 38175761
  • Circular ecDNA promotes accessible chromatin and high oncogene expression.
    Wu S, Turner KM, Nguyen N, Raviram R, Erb M, Santini J, Luebeck J, Rajkumar U, Diao Y, Li B, Zhang W, Jameson N, Corces MR, Granja JM, Chen X, Coruh C, Abnousi A, Houston J, Ye Z, Hu R, Yu M, Kim H, Law JA, Verhaak RGW, Hu M, Furnari FB, Chang HY, Ren B, Bafna V, Mischel PS. Wu S, et al. Nature. 2019 Nov;575(7784):699-703. doi: 10.1038/s41586-019-1763-5. Epub 2019 Nov 20. Nature. 2019. PMID: 31748743 Free PMC article.
  • Extrachromosomal DNA in Cancer.
    Bafna V, Mischel PS. Bafna V, et al. Annu Rev Genomics Hum Genet. 2022 Aug 31;23:29-52. doi: 10.1146/annurev-genom-120821-100535. Epub 2022 May 24. Annu Rev Genomics Hum Genet. 2022. PMID: 35609926 Free PMC article. Review.
  • Exploring the potential of extrachromosomal DNA as a novel oncogenic driver.
    Zhu H, Huangfu L, Chen J, Ji J, Xing X. Zhu H, et al. Sci China Life Sci. 2025 Jan;68(1):144-157. doi: 10.1007/s11427-024-2710-3. Epub 2024 Sep 27. Sci China Life Sci. 2025. PMID: 39349791 Review.
  • The evolutionary dynamics of extrachromosomal DNA in human cancers.
    Lange JT, Rose JC, Chen CY, Pichugin Y, Xie L, Tang J, Hung KL, Yost KE, Shi Q, Erb ML, Rajkumar U, Wu S, Taschner-Mandl S, Bernkopf M, Swanton C, Liu Z, Huang W, Chang HY, Bafna V, Henssen AG, Werner B, Mischel PS. Lange JT, et al. Nat Genet. 2022 Oct;54(10):1527-1533. doi: 10.1038/s41588-022-01177-x. Epub 2022 Sep 19. Nat Genet. 2022. PMID: 36123406 Free PMC article.

Cited by

  • Extrachromosomal DNA: shaping the evolutionary dynamics of cancer.
    Haughey M, Noorani I, Swanton C, Mischel PS, Werner B. Haughey M, et al. Trends Cancer. 2025 Jul 9:S2405-8033(25)00146-3. doi: 10.1016/j.trecan.2025.06.004. Online ahead of print. Trends Cancer. 2025. PMID: 40640072 Review.
  • Evaluation of Hi-C Sequencing for Detection of Gene Fusions in Hematologic and Solid Tumor Pediatric Cancer Samples.
    Schmitt AD, Sikkink K, Ahmed AA, Melnyk S, Reid D, Van Meter L, Guest EM, Lansdon LA, Pastinen T, Pushel I, Yoo B, Farooqi MS. Schmitt AD, et al. Cancers (Basel). 2024 Aug 23;16(17):2936. doi: 10.3390/cancers16172936. Cancers (Basel). 2024. PMID: 39272793 Free PMC article.
  • Effective targeting of PDGFRA-altered high-grade glioma with avapritinib.
    Mayr L, Neyazi S, Schwark K, Trissal M, Beck A, Labelle J, Eder SK, Weiler-Wichtl L, Marques JG, de Biagi-Junior CAO, Lo Cascio C, Chapman O, Sridhar S, Kenkre R, Dutta A, Wang S, Wang J, Hack O, Nascimento A, Nguyen CM, Castellani S, Rozowsky JS, Groves A, Panditharatna E, Cruzeiro GAV, Haase RD, Tabatabai K, Madlener S, Wadden J, Adam T, Kong S, Miclea M, Patel T, Bruckner K, Senfter D, Lämmerer A, Supko J, Guntner AS, Palova H, Neradil J, Stepien N, Lötsch-Gojo D, Berger W, Leiss U, Rosenmayr V, Dorfer C, Dieckmann K, Peyrl A, Azizi AA, Baumgartner A, Slaby O, Pokorna P, Clark LM, Cameron A, Nguyen QD, Wakimoto H, Dubois F, Greenwald NF, Bandopadhayay P, Beroukhim R, Ligon K, Kramm C, Bronsema A, Bailey S, Stucklin AG, Mueller S, Skrypek M, Martinez N, Bowers DC, Jones DTW, Jones C, Jäger N, Sterba J, Müllauer L, Haberler C, Kumar-Sinha C, Chinnaiyan A, Mody R, Chavez L, Furtner J, Koschmann C, Gojo J, Filbin MG. Mayr L, et al. Cancer Cell. 2025 Apr 14;43(4):740-756.e8. doi: 10.1016/j.ccell.2025.02.018. Epub 2025 Mar 13. Cancer Cell. 2025. PMID: 40086436
  • A Guide to Extrachromosomal DNA: Cancer's Dynamic Circular Genome.
    Weiser NE, Watkins TBK, Chang HY, Mischel PS. Weiser NE, et al. Cancer Discov. 2025 Jun 3;15(6):1105-1114. doi: 10.1158/2159-8290.CD-25-0230. Cancer Discov. 2025. PMID: 40287855 Free PMC article. Review.
  • Integrated single-cell multiome analysis reveals muscle fiber-type gene regulatory circuitry modulated by endurance exercise.
    Rubenstein AB, Smith GR, Zhang Z, Chen X, Chambers TL, Ruf-Zamojski F, Mendelev N, Cheng WS, Zamojski M, Amper MAS, Nair VD, Marderstein AR, Montgomery SB, Troyanskaya OG, Zaslavsky E, Trappe T, Trappe S, Sealfon SC. Rubenstein AB, et al. Genome Res. 2025 Jul 1;35(7):1664-1677. doi: 10.1101/gr.280051.124. Genome Res. 2025. PMID: 40393809

References

    1. Cox D, Yuncken C, Spriggs A. Minute chromatin bodies in malignant tumours of childhood. Lancet. 1965;286:55–58. doi: 10.1016/S0140-6736(65)90131-5. - DOI - PubMed
    1. Turner KM, et al. Extrachromosomal oncogene amplification drives tumour evolution and genetic heterogeneity. Nature. 2017;543:122–125. doi: 10.1038/nature21356. - DOI - PMC - PubMed
    1. Kim H, et al. Extrachromosomal DNA is associated with oncogene amplification and poor outcome across multiple cancers. Nat. Genet. 2020;52:891–897. doi: 10.1038/s41588-020-0678-2. - DOI - PMC - PubMed
    1. Verhaak RGW, Bafna V, Mischel PS. Extrachromosomal oncogene amplification in tumour pathogenesis and evolution. Nat. Rev. Cancer. 2019;19:283–288. doi: 10.1038/s41568-019-0128-6. - DOI - PMC - PubMed
    1. Ståhl F, Wettergren Y, Levan G. Amplicon structure in multidrug-resistant murine cells: a nonrearranged region of genomic DNA corresponding to large circular DNA. Mol. Cell. Biol. 1992;12:1179–1187. - PMC - PubMed