. 2023 Dec;55(12):2211-2223.
doi: 10.1038/s41588-023-01554-0. Epub 2023 Nov 9.

Transcriptional and epigenetic regulators of human CD8+ T cell function identified through orthogonal CRISPR screens

Affiliations

Transcriptional and epigenetic regulators of human CD8+ T cell function identified through orthogonal CRISPR screens

Sean R McCutcheon et al. Nat Genet. 2023 Dec.

Abstract

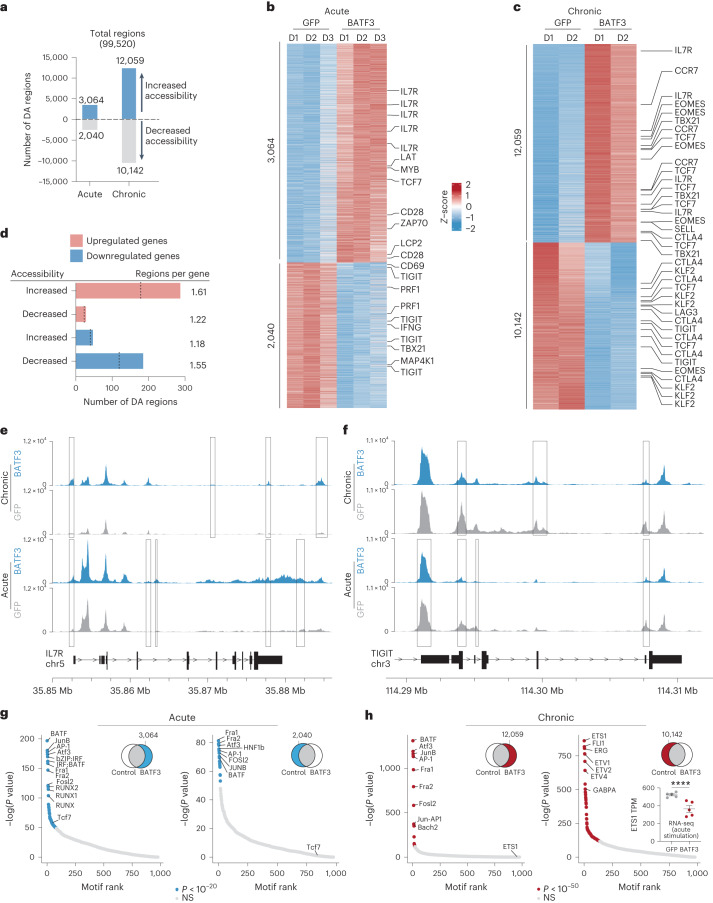
Clinical response to adoptive T cell therapies is associated with the transcriptional and epigenetic state of the cell product. Thus, discovery of regulators of T cell gene networks and their corresponding phenotypes has potential to improve T cell therapies. Here we developed pooled, epigenetic CRISPR screening approaches to systematically profile the effects of activating or repressing 120 transcriptional and epigenetic regulators on human CD8+ T cell state. We found that BATF3 overexpression promoted specific features of memory T cells and attenuated gene programs associated with cytotoxicity, regulatory T cell function, and exhaustion. Upon chronic antigen stimulation, BATF3 overexpression countered phenotypic and epigenetic signatures of T cell exhaustion. Moreover, BATF3 enhanced the potency of CAR T cells in both in vitro and in vivo tumor models and programmed a transcriptional profile that correlates with positive clinical response to adoptive T cell therapy. Finally, we performed CRISPR knockout screens that defined cofactors and downstream mediators of the BATF3 gene network.


Conflict of interest statement

S.R.M. and C.A.G. are named inventors on patent applications related to epigenome engineering technologies in primary human T cells. S.R.M. is a consultant for Tune Therapeutics. C.A.G. is a co-founder of Tune Therapeutics and Locus Biosciences, and is an advisor to Sarepta Therapeutics. The remaining authors declare no competing interests.

Figures

Fig. 1
Fig. 1. CRISPR interference or activation genetic screens identify transcriptional and epigenetic regulators of human CD8+ T cell state.
a, Schematic of CRISPRi/a screens with TF gRNA library (lib). b,c, Significance (Padj) versus fold change in gRNA abundance between CCR7HIGH and CCR7LOW populations for CRISPRi (b) and CRISPRa (c) screens. gRNA enrichment was defined using a paired two-tailed DESeq2 test with Benjamini–Hochberg correction. d, Fold change of BATF3 and BATF CRISPRa gRNA hits for each donor (D1-D3). Blue lines represent BATF3 or BATF gRNAs and gray lines represent the distribution of 120 non-targeting (NT) control gRNAs. e,f, All BATF3 (e) and BATF (f) CRISPRa gRNAs in gRNA library relative to TSS, chromatin accessibility and ENCODE candidate cis-regulatory elements (cCREs). Blue and black lines represent gRNA hits and nonsignificant gRNAs, respectively. cCRE tracks are overlaid for visualization of promoter-like elements (red) and enhancer-like elements (blue).
Fig. 2
Fig. 2. scRNA-seq characterization of candidate genes.
a,b, Significance (Padj) versus average fold change of CCR7 expression for each gRNA compared to nonperturbed cells for CRISPRi (a) and CRISPRa (b) perturbations. Significant gRNA effects on CCR7 expression were defined using a two-tailed MAST test with Bonferroni correction. True positive (TP) and negative rates (TN) are displayed above each volcano plot. c, Fold change in target gene expression for NT gRNAs and targeting gRNAs across CRISPRi (n = 31 gRNAs) and CRISPRa (n = 30 gRNAs) perturbations (mean values ± s.e.m.). A two-way ANOVA with Tukey’s post hoc test was used to compare groups. d, Dot plot with average expression and percentage of cells expressing target genes, memory markers and effector molecules for the indicated CRISPRi perturbations. Significant gRNA–gene links were defined using a two-tailed MAST test with Bonferroni correction. e, Number of DEGs (Padj < 0.01) associated with each gRNA versus the gRNA effect on the target gene for both CRISPRi and CRISPRa perturbations. f,g, Significant gRNA–gene links were defined using a two-tailed MAST test with Bonferroni correction. Correlation of the union set of DEGs between the top two CRISPRi MYB gRNAs (f) and CRISPRa BATF3 gRNAs (g). Pearson’s correlation coefficient was calculated and then a two-tailed t-test was conducted to determine whether the relationship was significant. h,i, Representative enriched pathways for the top three CRISPRi (h) and CRISPRa gRNAs (i). Statistical significance was defined using a two-tailed Fisher’s exact test followed by Benjamini–Hochberg correction.
Fig. 3
Fig. 3. BATF3 OE promotes specific features of memory T cells and counters exhaustion and cytotoxic gene signatures.
a, Representative histogram of IL7R expression in CD8+ T cells with BATF3 OE or control GFP OE on day 8 post-transduction. b, Summary statistics of IL7R expression with or without BATF3 OE (n = 3 donors with lines connecting the same donor, a two-tailed paired t-test (P = 0.0004) was used to compare IL7R expression between groups). c, Differential gene expression analysis between CD8+ T cells with or without BATF3 OE on day 10 post transduction (n = 5 donors). DEGs were defined using a paired two-tailed DESeq2 test with Benjamini–Hochberg correction. d,e, Selected enriched (d) and depleted (e) biological processes from BATF3 OE. Statistical significance was defined using a two-tailed Fisher’s exact test followed by Benjamini–Hochberg correction. f, Heatmap of DEGs (Padj < 0.01, n = 5 donors) related to T cell exhaustion, regulatory function, cytotoxicity, transcriptional activity and glycolysis. g, Representative histograms of exhaustion markers (TIGIT, LAG3 and TIM3) on day 12 after acute or chronic stimulation across groups. h, Stacked bar chart with average percentage of CD8+ T cells positive for zero, one, two or three exhaustion markers (TIGIT, LAG3 and TIM3) on day 12 after chronic stimulation across groups (n = 3 donors, mean values ± s.e.m.).
Fig. 4
Fig. 4. BATF3 OE remodels the chromatin landscape in the context of acute or chronic T cell stimulation.
a, Number of ATAC-seq regions with increased or decreased accessibility in acutely (n = 3 donors) or chronically stimulated CD8+ T cells (n = 2 donors) with BATF3 OE on day 14 post-transduction. Differentially accessible (DA) regions were defined as Padj < 0.05 using a paired two-tailed DESeq2 test with Benjamini–Hochberg correction. b,c, Heatmap of DA regions between control and BATF3 OE T cells under acute (b) or chronic (c) stimulation with selected regions annotated with their nearest gene. d, Joint analysis of RNA-seq and ATAC-seq datasets in the context of acute stimulation. Number of DA regions near upregulated and downregulated genes. Dashed lines represent the number of unique DEGs associated with DA regions. e,f, Representative ATAC-seq tracks of IL7R (e) and TIGIT (f) loci after acute or chronic stimulation with overlaid rectangles indicating DA regions between control and BATF3 OE T cells in each context. g,h, TF DNA-binding motifs enriched in open (left) and closed (right) regions of chromatin in BATF3 OE T cells compared to control T cells after acute (g) and chronic (h) stimulation. HOMER computes P values from the cumulative hypergeometric distribution and does not adjust for multiple hypotheses. Bar plot in lower right corner illustrates BATF3’s effect on ETS1 expression based on RNA-seq (n = 5 donors, mean values ± s.e.m.; statistical significance was determined using a paired two-tailed DESeq2 test between treatment groups).
Fig. 5
Fig. 5. BATF3 OE enhances CAR T cell potency.
a, Tumor viability after co-culture at specified E:T ratios (n = 3 donors). A two-way ANOVA with Dunnett’s post hoc test compared tumor viability at each E:T ratio: 1:8 (Padj = 0.0243), 1:4 (Padj = 0.0042) and 1:2 (Padj = 0.0099). b,c, Tumor volumes of untreated (n = 5) and treated mice with 5 × 105 (n = 1 donor, 5 mice per treatment) (b) or 2.5 × 105 CAR T cells (n = 1 donor, 4 mice per treatment) (c) with or without BATF3 OE. Two-way ANOVA with Tukey’s post hoc tests compared tumor volumes at each time point across treatments. Tumor volumes were never different between untreated and control CAR groups. Asterisks indicate significant differences between control and BATF3 OE CAR T cells. dg, Percentage of CD8+ T cells (d) within each resected tumor on day 3 post-treatment and (Ki-67 (e), TCF1 (f) and IFNγ (g) MFI of T cells (n = 2 donors, 2 GFP and 3 BATF3 mice for donor 1, 3 mice per treatment for donor 2). Two-tailed Mann–Whitney tests compared percentage of CD8+ cells and marker MFI between groups (P = 0.0065 for TCF1 and P = 0.0303 for IFNγ). h,i, Percentage (h) and total number (i) of CD8+ T cells within each resected tumor on day 19 post-treatment (n = 2 donors, 4 mice per treatment for donor 1, 2 GFP and 3 BATF3 mice for donor 2). Two-tailed Mann–Whitney tests compared percentage (P = 0.026) and total number of CD8+ cells between groups. j,k, TCF1 and ID3 MFI of T cells on day 19 (n = 2 donors, 1 mouse per treatment for donor 1, 2 GFP and 3 BATF3 mice for donor 2). Two-tailed t-tests compared MFI between groups (P = 0.037 for ID3). l, Significance (Padj) versus fold change between BATF3 OE and control CD8+ T cells for 144 genes associated with clinical outcome to CD19 CAR T cell therapy. Mean values ± s.e.m. are plotted for ak.
Fig. 6
Fig. 6. CRISPRko screens reveal cofactors of BATF3 and other targets for cancer immunotherapy.
a, Schematic of CRISPRko screens with TF KO gRNA library (lib). b, z scores of gRNAs for selected genes in mCherry (left) and BATF3 (right) screens. Enriched gRNAs (Padj < 0.01) were defined using a paired two-tailed DESeq2 test with Benjamini–Hochberg correction. c, Each gene target in the mCherry (top) and BATF3 (bottom) screens ranked based on the MAGeCK robust ranking aggregation (RRA) score in both IL7RLOW (left) and IL7RHIGH (right) populations. Dashed lines indicate FDR of 0.05. d, Scatter plot of z scores for each gRNA in CRISPRko screens with BATF3 versus without BATF3. Enriched gRNAs (Padj < 0.01) were defined using a paired two-tailed DESeq2 test with Benjamini–Hochberg correction. e, Individual and combined effects of ZNF217 KO and BATF3 OE on IL7R expression (n = 3 donors, mean values ± s.e.m.). A one-way, paired ANOVA test with Tukey’s post hoc test was used to compare the percentage of IL7R+ cells between groups (Padj = 0.041 for control versus ZNF217 KO, Padj = 0.008 for control versus BATF3 OE, and Padj = 0.049 for BATF3 OE versus BATF3 OE and ZNF217 KO). f, Scatter plot of transcriptomic effects of ZNF217 KO versus BATF3 OE relative to control T cells (n = 3 donors). DEGs (Padj < 0.05) were defined using a paired two-tailed DESeq2 test with Benjamini–Hochberg correction and labeled on the basis of whether the DEG was unique to a specific perturbation or shared across perturbations. g, Selected enriched biological processes from ZNF217 KO. Statistical significance was defined using a two-tailed Fisher’s exact test followed by Benjamini–Hochberg correction.
Extended Data Fig. 1
Extended Data Fig. 1. dSaCas9-based epigenetic screening platform.
(a) Schematic of CRISPRi lentiviral plasmid. (b) Schematic of CRISPRi screens in human CD8+ T cells. (c) Significance (Padj) versus fold change in gRNA abundance between CD2HIGH and CD2LOW populations for CD2 CRISPRi screen. gRNA enrichment was defined using a paired two-tailed DESeq2 test with Benjamini-Hochberg correction. (d) CD2 gRNA fold change versus gRNA position relative to TSS. Dashed lines represent previously defined optimal CRISPRi window. (e) CD2 gRNA fold change as a function of the final base pair of the PAM. x represents the number of gRNA hits and y represents the total number of gRNAs for each PAM variant. A one-way ANOVA with Dunnett’s post hoc test was used to compare fold change of gRNAs for each PAM variant to NNGRRT (mean values +/− SEM, T versus A (Padj = 0.0003), T versus C (Padj = 0.0399), and T versus G (Padj = 0.0088). (f) CD2 gRNA activity plotted in rank order (n = 3 replicates of CD8+ T cells from pooled PBMC donors, mean values +/− SEM). A one-way ANOVA with Dunnett’s post hoc test was used to compare each gRNA to NT. Final base pair of PAM for each gRNA is indicated beneath gRNA label. (g) Relationship between CD2 gRNA activity and fold enrichment in screen (n = 18 CD2-targeting gRNAs (16 hits and 2 non-hits) and 1 non-targeting gRNA, mean values +/− SEM with Pearson’s correlation coefficient (r)). Significance (Padj) versus fold change in gRNA abundance between IL2RAHIGH and IL2RALOW populations for the IL2RA CRISPRa Jurkat screens (n = 3 replicates) with (h) dSaCas9VP64 and (i) VP64dSaCas9VP64. gRNA enrichment was defined using a paired two-tailed DESeq2 test with Benjamini-Hochberg correction. (j) Normalized IL2RA MFI of dSaCas9VP64 and VP64dSaCas9VP64 Jurkat lines transduced with indicated gRNAs (n = 2 replicates). A two-tailed paired ratio t-test (p = 0.0068) was used to compare gRNA activity between dSaCas9VP64 and VP64dSaCas9VP64 Jurkat lines. (k) Relative IL2RA mRNA expression of Jurkat CRISPRa lines transduced with indicated gRNA on day 9 post-transduction (n = 2, mean values +/− SEM).
Extended Data Fig. 2
Extended Data Fig. 2. B2M promoter tiling CRISPRi screen in primary human CD8+ T cells.
(a) Significance (Padj) versus fold change in gRNA abundance between B2MHIGH and B2MLOW populations for B2M CRISPRi screen. gRNA enrichment was defined using a paired two-tailed DESeq2 test with Benjamini-Hochberg correction. (b) B2M gRNA fold change versus gRNA position relative to TSS. Dashed lines represent previously defined optimal CRISPRi window. (c) B2M gRNA fold change as a function of the final base pair of the PAM. x represents the number of gRNA hits and y represents the total number of gRNAs for each PAM variant. A global one-way ANOVA with Dunnett’s post hoc test was used to compare the fold change of gRNAs for each PAM variant to NNGRRT (mean values +/− SEM, T versus A (Padj = 0.002), T versus C (Padj < 0.0001), and T versus G (Padj = 0.0003). (d) B2M gRNA activity plotted in rank order (n = 3 replicates of CD8+ T cells from pooled PBMC donors, mean values +/− SEM). A one-way ANOVA with Dunnett’s post hoc test was used to compare each gRNA to NT. Final base pair of PAM for each gRNA is indicated beneath gRNA label. (e) Relative B2M mRNA expression of CD8+ cells transduced with indicated gRNA on day 9 post-transduction (n = 3, mean values +/− SEM). A one-way ANOVA with Dunnett’s post hoc test was used to compare each gRNA to NT.
Extended Data Fig. 3
Extended Data Fig. 3. dSaCas9VP64 and VP64dSaCas9VP64 IL2RA promoter tiling CRISPRa screens in Jurkats.
(a) Schematic of dSaCas9VP64 and VP64dSaCas9VP64 IL2RA promoter tiling CRISPRa screens in Jurkats. (b) UCSC genome browser track of IL2RA locus with statistical significance displayed for each gRNA in VP64dSaCas9VP64 CRISPRa screen. gRNA hits are annotated and labeled in blue. ATAC-seq and ENCODE candidate cis regulatory elements (cCREs) tracks are overlayed for visualization of chromatin accessibility and annotations. cCREs in red are defined as promoter-like elements and cCREs in blue are defined as enhancer-like elements. (c) Fold change in IL2RA gRNA abundance as a function of the final base pair of the PAM. x represents the number of gRNA hits and y represents the total number of gRNAs for each PAM variant. A global one-way ANOVA with Dunnett’s post hoc test was used to compare the fold change of gRNAs for each PAM variant to NNGRRT (mean values +/− SEM, T versus A (Padj = 0.0169), T versus C (Padj = 0.0131), and T versus G (Padj = 0.0079). (d) Representative overlayed histograms of IL2RA expression for dSaCas9VP64 and VP64dSaCas9VP64 Jurkat lines on day 9 post-transduction across gRNAs.
Extended Data Fig. 4
Extended Data Fig. 4. MYB silencing drives T cells towards an effector phenotype and NR1D1 activation induces an exhaustion phenotype.
(a) Statistical significance (Padj) for each gene versus the fold change in gene expression in MYB CRISPRi-perturbed cells relative to non-perturbed cells. Only DEGs (Padj < 0.01, all labeled blue except MYB) are displayed. DEGs were defined using a two-tailed MAST test with Bonferroni correction. (b) Classification of annotated DEGs based on their functional role. (c) UMAP plot of CRISPRa scRNA-seq characterization with cells split by perturbation status: non-perturbed (top) and perturbed (bottom). Blue data points indicate cells with a NR1D1 gRNA. Cells were clustered using Seurat’s CalcPerturbSig function to mitigate confounding sources of variation such as the donor and phase of cell cycle. (d) Statistical significance (Padj) for each gene versus the fold change in gene expression in NR1D1 CRISPRa-perturbed cells relative to non-perturbed cells. Only DEGs (Padj < 0.01, all labeled blue except NR1D1) are displayed. DEGs were defined using a two-tailed MAST test with Bonferroni correction. (e) Violin plot of exhaustion gene signature score across non-perturbed (n = 2,980 cells) and NR1D1-perturbed (n = 456 cells) in the CRISPRa scRNA-seq screen. Boxplots extend from the lower whisker (minimum value within 1.5 IQR of the first quartile) to the upper whisker (maximum value within 1.5 IQR of the third quartile). The boxed lines represent the first quartile, median, and third quartile. UCell gene signature scores are based on the Mann-Whitney U statistic.
Extended Data Fig. 5
Extended Data Fig. 5. Kinetics of BATF3 expression and effects of BATF3 OE.
(a) Median BATF3 expression over time relative to baseline expression before T cell activation across groups (n = 3 donors, fold change in BATF3 expression was calculated using 2−dCT method relative to baseline BATF3 expression, internal householding control was excluded because T cell stimulation dramatically alters expression of householding genes such as GAPDH and TBP, input mass of RNA into the reverse transcription reaction was the same for all samples). (b) An IL7R fluorescent minus one (FMO, left) control was used to set the IL7R+ gate. Representative IL7R expression of CD8+ T cells from a donor transduced with either GFP (middle) or BATF3 OE (right) on day 8 post-transduction. (c) Transcripts per million (TPM) of selected genes: BATF3 (Padj = 1e-7), CCR7 (Padj = 0.01), TCF7 (ns), TIGIT (Padj = 3e-18), TIM3 (Padj =1e-10), CISH (Padj = 6e-11), LAG3 (Padj = 1e-14), FOXP3 (Padj =5e-13), and CCL4 (Padj = 5e-6) with either GFP or BATF3 OE on day 10 post transduction (n = 5 donors, mean values +/− SEM). Padj values were determined using a paired two-tailed DESeq2 test with Benjamini-Hochberg correction.
Extended Data Fig. 6
Extended Data Fig. 6. BATF3 OE attenuates expression of T cell exhaustion markers.
(a) Schematic of acute (left) and chronic stimulation (right) with CD3/CD28 dynabeads. (b) Average percentage of positive cells (top panel: PD1 (p = 0.02), LAG3 (p = 0.06), TIGIT (p = 0.03), and TIM3 (ns)) and MFI (bottom panel: PD1 (p = 0.02), LAG3 (p = 0.03), TIGIT (p = 0.046), and TIM3 (ns)) of exhaustion markers on day 3 post-transduction with GFP or BATF3 OE (n = 3 individual donors, mean values +/− SEM, two-tailed paired t tests were used to determine statistical significance). (c) Time course of PD1, LAG3, TIGIT, and TIM3 expression post-transduction with GFP or BATF3 OE under acute or chronic stimulation (n = 3 individual donors, mean values +/− SEM).
Extended Data Fig. 7
Extended Data Fig. 7. BATF3 OE remodels epigenetic landscape of TCF7 locus.
Proportion of differentially accessible regions based on genomic feature classification with (a) acute stimulation and (b) chronic stimulation. (c) Representative ATAC-seq tracks of the TCF7 locus under acute and chronic stimulation with and without BATF3 OE.
Extended Data Fig. 8
Extended Data Fig. 8. BATF3 OE enhances in vitro and in vivo tumor control.
(a) Tumor viability after 24 hours of culture in T cell media, co-culture with CARnull T cells, or co-culture with CAR T cells at specified effector to target (E:T) ratios (n = 3 donors, mean values +/− SEM). (b) Tumor viability after 24 hours of co-culture with GFP CARnull, GFP CAR + , and BATF3 OE CAR + CD8 T cells at specified E:T ratios for each donor. (c) Tumor volume over time as a function of the dose of control HER2 CAR T cells (n = 5 mice per treatment, mean values +/− SEM). Mice were intravenously injected with CAR T cells on day 21. (d) Representative flow plots of CAR expression in CD8+ T cells with control and BATF3 OE CAR lentiviral plasmids on day 9 post-transduction (the same day that the mice were intravenously injected with CAR T cells). (e) Summary statistics of transduction rates and total CAR+ T cells with control and BATF3 OE CAR lentiviral plasmids on day 9 post-transduction (n = 3 donors, lines connect donors across treatments, paired two-tailed t tests were used to determine statistical significance). (f) Tumor volumes of individual mice treated with 5 × 10⁵ (left panel, n = 5 mice per treatment group) or 2.5 × 10⁵ (right panel, n = 4 mice per treatment group) CAR T cells with or without BATF3 overexpression. Thinner lines represent tumor volumes of individual mice and thicker lines represent mean tumor volumes +/− SEM for each treatment group.
Extended Data Fig. 9
Extended Data Fig. 9. Characterization of CAR T cells with or without BATF3 OE during in vivo tumor control experiment.
(a) Tumor volumes over time for untreated mice (n = 4 mice) and mice treated with 5 × 10⁵ CAR T cells with or without BATF3 overexpression (n = 2 donors, 4 GFP and 3 BATF3 mice for donor 1, 3 mice per treatment for donor 2. mean values +/− SEM). Input CAR T cells and tumor infiltrating CAR T cells on day 3 and day 19 post-treatment were characterized using flow cytometry. (b) Same as (a) except stratified based on donor (4 GFP and 3 BATF3 mice for donor 1, 3 mice per treatment for donor 2, mean values +/− SEM). (c) Percentage of positive cells or (d) MFI for indicated markers of input CAR T cells across groups (n = 2 donors, mean values +/− SEM). (e) Histograms of TCF1 and LAG3 expression for input CAR T cells. (f) Percentage of CD8+ T cells in peripheral blood on day 3 post-treatment across groups (n = 2 donors, 2 GFP and 3 BATF3 mice for donor 1 and 3 mice per treatment for donor 2, mean values +/− SEM). A two-tailed Mann-Whitney test was used to compare the percentage of CD8+ cells between the two groups. (g) Percentage of positive cells for indicated markers of tumor infiltrating CAR T cells on day 3 post-treatment across groups (n = 2 donors, 2 GFP and 3 BATF3 mice for donor 1 and 3 mice per treatment for donor 2, mean values +/− SEM). (h) Percentage of positive cells or (I) MFI for indicated markers of tumor infiltrating CAR T cells on day 19 post-treatment across groups (n = 2 donors, 1 mouse per treatment for donor 1, 2 GFP and 3 BATF3 mice for donor 2, mean values +/− SEM). Two-tailed t tests were used to compare expression of each marker between groups (% LAG3+ (p = 0.046) % CD45RA+ (p = 0.048), IRF4 MFI (p = 0.01)).
Extended Data Fig. 10
Extended Data Fig. 10. CRISPR knockout screens reveal co-factors of BATF3 and targets for cancer immunotherapy.
(a) Number of gRNA hits (Padj < 0.01 as defined by a paired two-tailed DESeq2 test with Benjamini-Hochberg correction) per gene in the CRISPRko screen without BATF3 OE. Only genes with at least 1 enriched gRNA were included in this plot. (b) Boxplot of baseline expression of genes stratified based on whether they were hits in the CRISPRko screen without BATF3 OE (n = 1,573 nonsignificant genes and n = significant 34 genes, genes with an FDR < 0.01 based on mageck gene-level analysis were classified as hits). Boxplots extend from the lower whisker (minimum value) to the upper whisker (maximum value). Lines represent the first quartile, median, and third quartile. A two-tailed t test was used to compare baseline expression of nonsignificant and significant gene hits. (c) z scores of gRNAs for JUNB and IRF4 in mCherry (left) and BATF3 (right) screens. Enriched gRNAs (Padj < 0.01, labeled blue) were defined using a paired two-tailed DESeq2 test with Benjamini-Hochberg correction. Non-targeting gRNAs are labeled gray. (d) Predicted functional protein association network of BATF3 using STRING. (e) Percentage IL7R+ (left) and relative IL7R MFI (right) in CD8+ T cells with mCherry or BATF3 across gRNAs. Relative IL7R MFI was calculated by dividing the IL7R MFI of each targeting gRNA by the IL7R MFI of the non-targeting gRNA for each donor within the treatment group (n = 3 donors, mean values +/− SEM). (f) Representative histograms of IL7R expression in CD8+ T cells with BATF3 overexpression in combination with JUNB or IRF4 gene knockouts. (g) Effect of ZNF217 knockout on IL7R expression in CD8+ T cells across three donors with BATF3 OE.

Update of

References

    1. Xu Y, et al. Closely related T-memory stem cells correlate with in vivo expansion of CAR.CD19-T cells and are preserved by IL-7 and IL-15. Blood. 2014;123:3750–3759. doi: 10.1182/blood-2014-01-552174. - DOI - PMC - PubMed
    1. Fraietta JA, et al. Determinants of response and resistance to CD19 chimeric antigen receptor (CAR) T cell therapy of chronic lymphocytic leukemia. Nat. Med. 2018;24:563–571. doi: 10.1038/s41591-018-0010-1. - DOI - PMC - PubMed
    1. Klebanoff CA, et al. Central memory self/tumor-reactive CD8+ T cells confer superior antitumor immunity compared with effector memory T cells. Proc. Natl Acad. Sci. USA. 2005;102:9571–9576. doi: 10.1073/pnas.0503726102. - DOI - PMC - PubMed
    1. Krishna S, et al. Stem-like CD8 T cells mediate response of adoptive cell immunotherapy against human cancer. Science. 2020;370:1328–1334. doi: 10.1126/science.abb9847. - DOI - PMC - PubMed
    1. Locke FL, et al. Tumor burden, inflammation, and product attributes determine outcomes of axicabtagene ciloleucel in large B-cell lymphoma. Blood Adv. 2020;4:4898–4911. doi: 10.1182/bloodadvances.2020002394. - DOI - PMC - PubMed

Publication types

MeSH terms