. 2023 Nov;3(11):1430-1445.
doi: 10.1038/s43587-023-00513-y. Epub 2023 Nov 9.

Spatial and single-cell profiling of the metabolome, transcriptome and epigenome of the aging mouse liver

Affiliations

Spatial and single-cell profiling of the metabolome, transcriptome and epigenome of the aging mouse liver

Chrysa Nikopoulou et al. Nat Aging. 2023 Nov.

Abstract

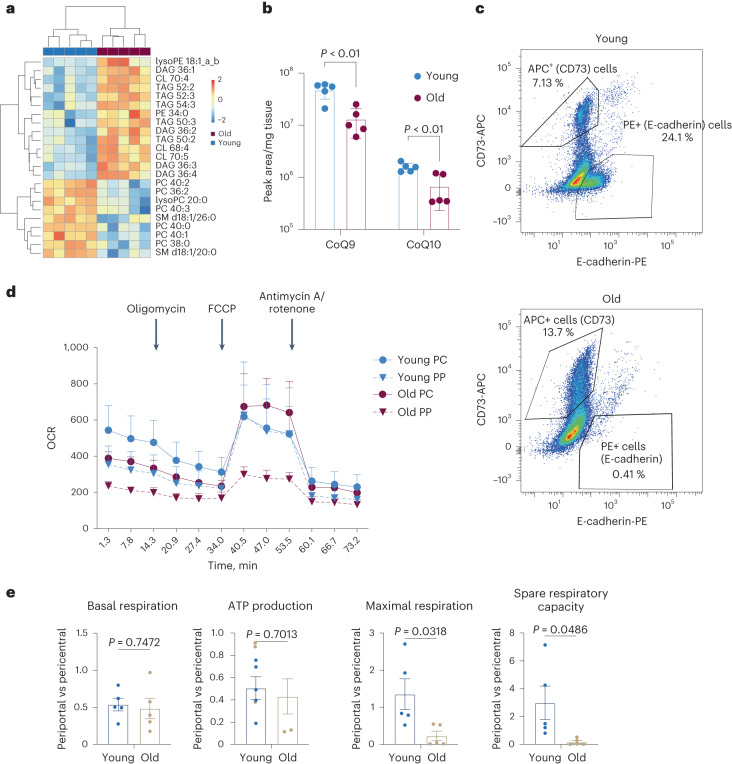
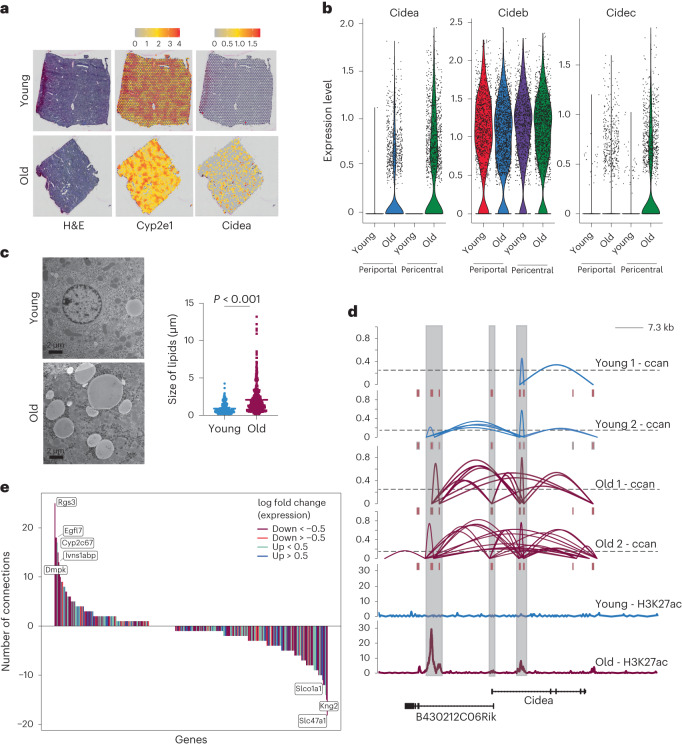
Tissues within an organism and even cell types within a tissue can age with different velocities. However, it is unclear whether cells of one type experience different aging trajectories within a tissue depending on their spatial location. Here, we used spatial transcriptomics in combination with single-cell ATAC-seq and RNA-seq, lipidomics and functional assays to address how cells in the male murine liver are affected by age-related changes in the microenvironment. Integration of the datasets revealed zonation-specific and age-related changes in metabolic states, the epigenome and transcriptome. The epigenome changed in a zonation-dependent manner and functionally, periportal hepatocytes were characterized by decreased mitochondrial fitness, whereas pericentral hepatocytes accumulated large lipid droplets. Together, we provide evidence that changing microenvironments within a tissue exert strong influences on their resident cells that can shape epigenetic, metabolic and phenotypic outputs.


Conflict of interest statement

The authors declare no competing financial interests.

Figures

Fig. 1
Fig. 1. Age-related and zonation-specific transcriptional alterations.
a, RNAscope of zone-specific marker genes Glul (magenta, upper panel), Cyp2f2 (cyan, upper panel), Cyp2e1 (magenta, lower panel) and albumin (cyan, lower panel) in paraffin-embedded liver sections from young (3-month-old) and old (18-month-old) mice. Scale bars, 100 µm. b, H&E staining of one young (upper panel) and one old (lower panel) liver specimen used for spatial transcriptomics (scale bar, 500 µm) and plots showing the expression levels of Glul, Cyp2f2 and Cyp2e1 indicated by color. The color gradient represents normalized gene expression. c, UMAP projection of the spatial data; color-coded are the different zones and ages (left panel) and the expression of Glul, Cyp2e1 and Cyp2f2 (right panel). PP: periportal, PC: pericentral. d, MA ((M (log2 ratio) and A (mean average)) plots of gene expression changes upon aging in the pericentral zone. Significantly changed genes are colored in red and blue (based on MAST). Bonferroni correction was applied for multiple testing adjustments of P values (threshold of 0.05). e, Top five Reactome pathways for up- and downregulated genes in the pericentral region analyzed using Metascape. f, MA plots of gene expression changes upon aging in the periportal zone. Significantly changed genes were colored in and blue (based on MAST). Bonferroni correction was applied for multiple testing adjustments of P values (threshold of 0.05). g, Top five Reactome pathways for up- and downregulated genes in the periportal region analyzed using Metascape. h, Transcription factor (TF) activity prediction from the age-dependent differentially expressed genes by the iRegulon app in Cytoscape (based on Supplementary Table 3; see Methods for details). For each zone, the top predicted transcription factors are shown as well as their interaction to regulate transcripts. Numbers indicate the genes in every cluster.
Fig. 2
Fig. 2. Lipid remodeling and alterations in mitochondrial metabolism in the aging liver.
a, Heatmap with hierarchical clustering of lipid datasets derived from five old and five young mouse livers, showing the differentially regulated classes of lipids. Hierarchical clustering was performed using LipidSig based on data available in Supplementary Table 4. b, Bar plot showing the expression of Ubiquinones CoQ9 and CoQ10 in young (n = 5) and old (n = 5) liver. Data are presented as mean values ± standard error of the mean (s.e.m.). Statistical significance was determined using an unpaired two-tailed t-test. c, Exemplary FACS profiles of sorted hepatocytes based on CD73 (pericentral) and E-cadherin (periportal). d, Seahorse profile of hepatocytes purified from indicated sources. Error bars represent s.e.m. from n = 5 (n represents data derived from individual animals). e, Mitochondrial function as measured by Seahorse Mitochondrial Stress kit (parameter on top of graph) expressed as periportal versus pericentral and young-old n = 5 (n represents data derived from individual animals). Error bars represent s.e.m. Statistical significance was determined using a two-tailed unpaired t-test. Source data
Fig. 3
Fig. 3. Differential chromatin accessibility in aged liver hepatocytes.
a,b, UMAP projection of scATAC-seq data of mouse liver nuclei. a, Different colors represent liver cells from young and old age groups identified using cisTopic. b, Different colors represent different cell types based on imputed marker gene activity. c, Heatmap showing the accessibility of indicated marker gene promoters used to call cell types. d, Examples of hepatic marker genes and the respective accessibility at their promoters. e, Examples of topics as identified by CisTopic (for details, see text). Color code of the UMAPs is according to the normalized topic score for each cell. f, GO term analysis of the highlighted topics as shown in e. hep: hepatocyte; Binom_fold_enr.: binomial fold enrichment; Binom_adjp: adjusted p-value. Significance threshold was set at 0.05. g, Uniquely enriched transcription factors and their corresponding motifs for the highlighted zones/age groups. h, Exemplary tracks of differentially accessible sites between pericentral and periportal hepatocytes upon aging. The gray bar indicates altered regions.
Fig. 4
Fig. 4. Connection between chromatin and transcriptional alterations in the aging liver.
a, H&E staining of one young (upper panel) and one old (lower panel) liver specimen used for spatial transcriptomics and a plot showing the expression level of Cidea. Please note that H&E stain and Cyp2e1 plots are identical to Fig. 1b and used here for reference only. The color gradient represents normalized gene expression. b, Violin plots indicating the expression levels of Cidea, Cideb and Cidec across pericentral and periportal regions in young and old liver. c, Transmission electron micrograph of LDs of young and old liver tissue. Representative images at 3,000×; scale bars, 2 µm. ImageJ quantification of the mean LD diameter size (μm) from ten randomly selected photos from 5 young (LD n = 327, mean = 0.9053) and 4 old (LD n = 407, mean = 2.084) mouse specimens. Statistical significance was determined using an unpaired two-tailed t-test. d, Ccan values based on Cicero prediction of co-accessibility (upper panel) and the enhancer mark H3K27ac (lower panel) at the Cidea locus in young and old mouse liver. Highlighted in gray are potential enhancer and promoter regions from Cidea and its associated antisense long non-coding RNA, respectively. e, Age-related changes in co-accessibility of loci identified using spatial transcriptomics. y axis shows the differences in predicted contact points between young and old hepatocytes (shown as connecting lines in d). Color of the graphs highlight direction of gene expression change as taken from the spatial transcriptomics data between young and old.
Fig. 5
Fig. 5. Transcriptional variability in hepatocytes upon aging.
a, Experimental overview. b, Different features of the individual cells projected in a UMAP plot. c, Gene expression levels of hepatocyte and zonation markers projected in a UMAP plot. d–f, Transcriptional variability upon aging (d), in pericentral and periportal zones (e) and in the differently ploid hepatocytes (f) expressed as coefficient of variation of all detected genes. Significance was calculated using Wilcoxon test within geom_signif function. The lower and upper hinges of the boxplot correspond to the first and third quartiles (25th and 75th percentiles) while the middle line is median and the whiskers extend to 1.5 × interquartile range (IQR) from both lower and upper hinges. The notches extend 1.58 × IQR/sqrt(n), which is roughly 95% confidence intervals (CIs) for comparing medians, g, Biological processes (upper panel) and Cellular components (lower panel) for differentially expressed genes. h, Examples of overexpressed and i) under-expressed genes as feature plot (upper panel) and ridge plot (lower panel). j, Biological processes (upper panel) and Cellular components (lower panel) for differentially dispersed genes. Gen.: Generation;Neg reg.: negative regulation;med.: mediated;ubi: ubiquitin;prot: protein;proc.: process. k, Examples of over-dispersed and l) under-dispersed genes as feature plot (upper panel) and ridge plot (lower panel).
Extended Data Fig. 1
Extended Data Fig. 1. Lipid Remodeling in the ageing mouse liver.
a) PCA projection of bulk RNA-seq data derived from young and old mouse livers. b) Differentially enriched Gene Ontology Biological Processes in the aged liver tissue derived from A (Supplementary Table 1). The colour scale represents the number of genes in each term and Adjusted p-value (Benjamini Hochberg) on x-axis is derived with over representation test using enrichGO function of clusterProfiler R package. c) Representative images from H&E (upper panel) and Sirius Red (lower panel) stainings on liver sections from a young and an old mouse. Scale bar = 100μm. d) Representative images of PP (periportal) and CV (central vein areas) of Oil-red-O (O-R-O, upper panel) and Plin2 immunostainings (lower panel) on liver sections from young and old mice. Scale bar = 100 µm. e) Spatial transcriptomics slides of the second biological replicate. f) PCA plot of the spatial data after integration of the four datasets using canonical correlation analysis. Different colours represent the different samples. g) PC plot showing the top 50 genes that separate the ageing groups in Supplementary Fig. 1e.
Extended Data Fig. 2
Extended Data Fig. 2. Non-parenchymal cells in the spatial transcriptomics data.
Representative plots showing expression levels of Kupffer cell (a), endothelial cell (b) and hepatic stellate cell (c) markers as indicated in young and old livers as determined by spatial transcriptomics. The colour gradient represents normalised gene expression.
Extended Data Fig. 3
Extended Data Fig. 3. Lipids and sorting of hepatocytes based on zones.
a) PCA of lipidomic data coloured by age. b) Gating strategy for isolation of pericentral and periportal hepatocytes. c) qRT-PCR to validate the enrichment for pericentral and periportal hepatocytes based on expression ratios of Glul and Cyp2f2 levels. Shown are individual replicates for young and old mice (as indicated). d) Mitochondrial content of livers was measured using primers against genomic copies of mt-Cytb and b-actin. Individual values are given as dots. Error bars represent SEM. Statistical significance was determined using a two-tailed unpaired t-test.
Extended Data Fig. 4
Extended Data Fig. 4. Initial analysis of the individual scATAC-seq samples using Signac.
a) UMAP projection of scATAC-seq nuclei from young and old livers of biological replicate 1 generated with 10X scATAC v2 chemistry. Colour-coded are the different age groups identified using Signac. b) Same as in a). Colour coded are the different cell types, assigned by using marker genes from CellMarker. c) UMAP projection of scATAC-seq nuclei from young and old livers of biological replicate 2 generated with 10X scATAC v3 chemistry. Colour-coded are the different age groups identified using Signac. d) Same as in b). Colour coded are the different cell types, assigned by using marker genes from CellMarker.
Extended Data Fig. 5
Extended Data Fig. 5. Second scATAC replicate.
ab) UMAP projection of scATAC-seq data of mouse liver nuclei (2nd biological replicate) a) Different colours represent liver cells from young and old age groups identified using cisTopic. b) Different colours represent different cell types based on imputed marker gene activity (see also Supplementary Fig. 3c). c) Heatmap showing the accessibility of indicated marker gene promoters used to call cell types. d) Examples of hepatic marker genes and the respective accessibility at their promoters. e) Examples of topics as identified by CisTopic - for details see text. Colour code of the UMAPs is according to the normalised topic score for each cell. f) GO term analysis of the highlighted topics.
Extended Data Fig. 6
Extended Data Fig. 6. scATAC and ploidy levels.
a) DNA content of nuclei purified from liver tissue following the same protocol as for scATAC-seq. b) c) Sequence coverage of individual cells.
Extended Data Fig. 7
Extended Data Fig. 7. Integration of scATAC with spatial transcriptomics.
a) Violin plots indicating the expression levels of Cidea, Cideb and Cidec across pericentral and periportal regions in young and old liver - divided by the two biological replicates. b) Age-related changes in co-accessibility of loci identified using spatial transcriptomics (as calculated for a second biological scATAC-seq replicate). Y-axis shows the differences in predicted contact points between young and old hepatocytes. Colour of the graphs highlight direction of gene expression change as taken from the spatial transcriptomics data (Supplementary Table 3) between young and old.
Extended Data Fig. 8
Extended Data Fig. 8. Integration of scATAC with spatial transcriptomics.
a,b) Sorting strategy to isolate hepatocytes with different ploidy levels for SMART-seq3 from young (a) and old (b) livers. c) Initial filtering based on number of reads and percentage of exons detected per cell for all sequenced cells. Only cells that fell into the upper right quadrant were taken for further processing. d) Plotting the number of genes/UMI for cells that passed / not passed the initial filter to highlight successful separation of good / bad quality cells using the method described in (c). The lower and upper hinges of the boxplot correspond to the first and third quartiles (25th and 75th percentiles) while the middle line is median and the whiskers extend to 1.5 × interquartile range (IQR) from both lower and upper hinges. The notches extend 1.58 × IQR/sqrt(n), which is roughly 95% confidence intervals (CIs) for comparing medians e) Feature plots representing the described characteristics of the dataset. f) Expression level of hepatic and Kupffer cell markers in the indicated Seurat clusters. g) Based on the expression data, cell type identity was projected onto the individual clusters. The Kupffer cell cluster (cluster #1) was removed from any further analysis, but is still present in the uploaded count matrix available under E-MATB-12579.
Extended Data Fig. 9
Extended Data Fig. 9. Transcriptional Variability.
a–c) Transcriptional variability upon ageing (a), in pericentral and periportal zones (b) and in the differently ploid hepatocytes (c) expressed as Pearson Coefficient of all detected genes. d) Violin plots for differential dispersed and expressed genes in the Tabula Muris senis dataset. Dispersion and expression was calculated using BASiCS. Significance for the figures a-d was calculated using Wilcoxon test within geom_signif function. The lower and upper hinges of the boxplot correspond to the first and third quartiles (25th and 75th percentiles) while the middle line is median and the whiskers extend to 1.5 × interquartile range (IQR) from both lower and upper hinges. The notches extend 1.58 × IQR/sqrt(n), which is roughly 95% confidence intervals (CIs) for comparing medians e) Volcano plot for differentially dispersed genes as found in Tabula Muris senis data of flow sorted liver cells. f) Biological processes (upper panel) and Cellular components (lower panel) for differentially expressed and dispersed genes.

References

    1. López-Otín C, Blasco MA, Partridge L, Serrano M, Kroemer G. The hallmarks of aging. Cell. 2013;153:1194–1217. - PMC - PubMed
    1. Ferrucci L, Kuchel GA. Heterogeneity of aging: individual risk factors, mechanisms, patient priorities, and outcomes. J. Am. Geriatr. Soc. 2021;69:610–612. - PMC - PubMed
    1. Bahar R, et al. Increased cell-to-cell variation in gene expression in aging mouse heart. Nature. 2006;441:1011–1014. - PubMed
    1. Somel M, Khaitovich P, Bahn S, Pääbo S, Lachmann M. Gene expression becomes heterogeneous with age. Curr. Biol. 2006;16:R359–R360. - PubMed
    1. Işıldak U, Somel M, Thornton JM, Dönertaş HM. Temporal changes in the gene expression heterogeneity during brain development and aging. Sci. Rep. 2020;10:4080. - PMC - PubMed

Publication types

LinkOut - more resources