. 2023 Dec;26(12):2090-2103.
doi: 10.1038/s41593-023-01477-3. Epub 2023 Nov 9.

Non-synaptic function of the autism spectrum disorder-associated gene SYNGAP1 in cortical neurogenesis

Affiliations

Non-synaptic function of the autism spectrum disorder-associated gene SYNGAP1 in cortical neurogenesis

Marcella Birtele et al. Nat Neurosci. 2023 Dec.

Abstract

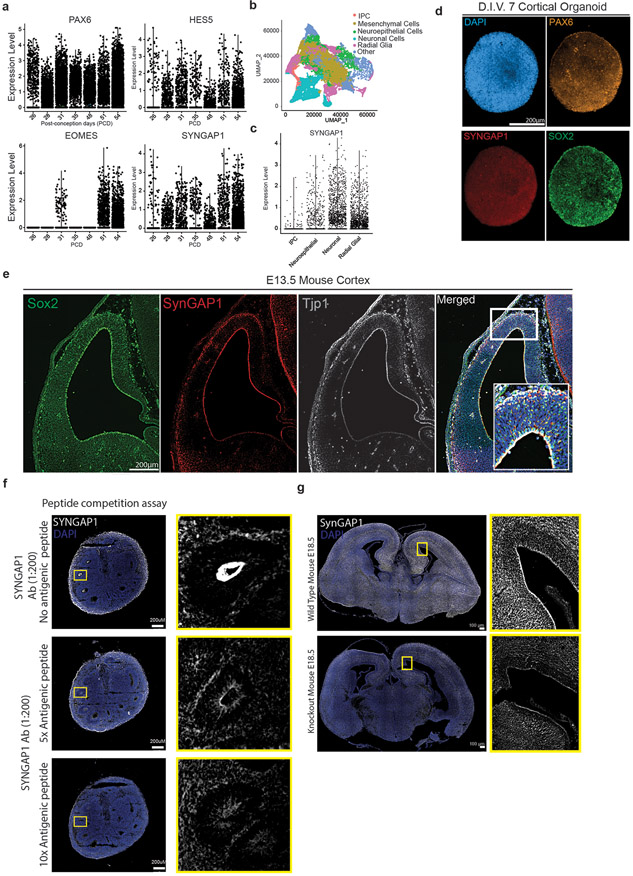
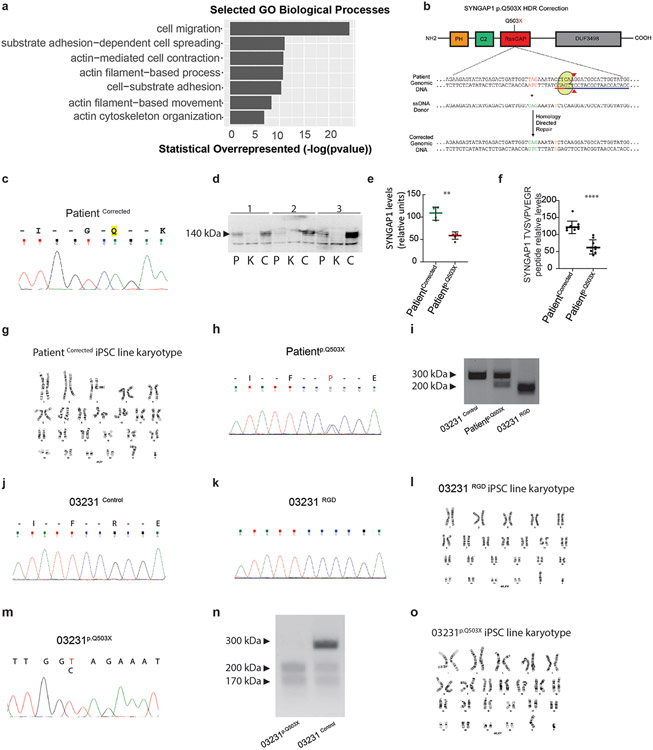
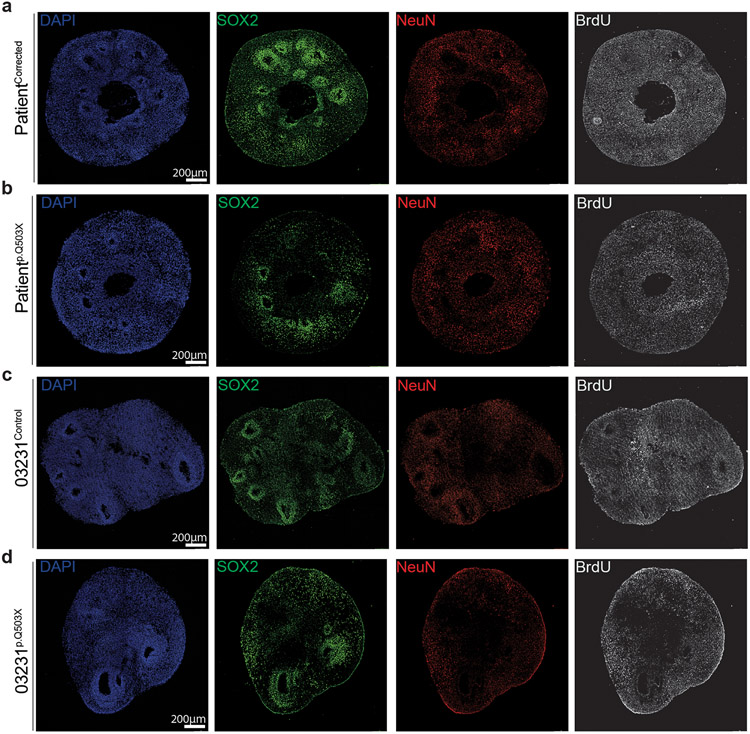
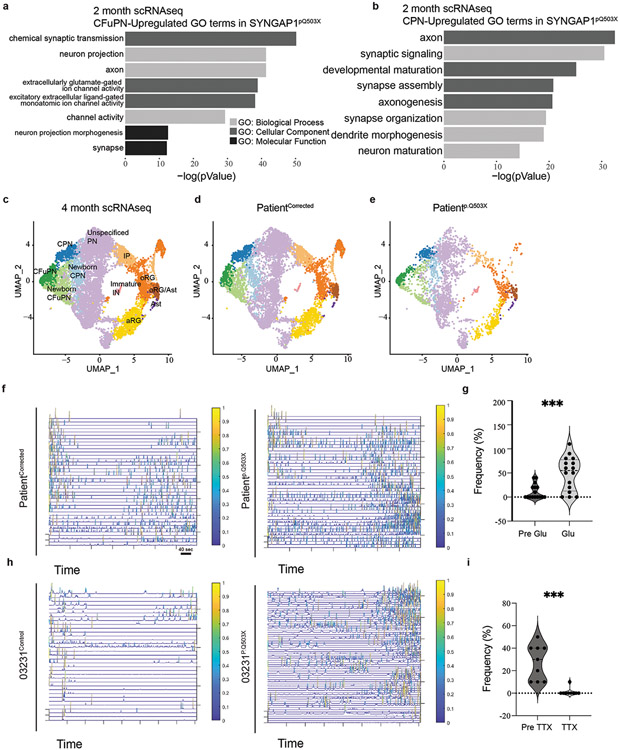
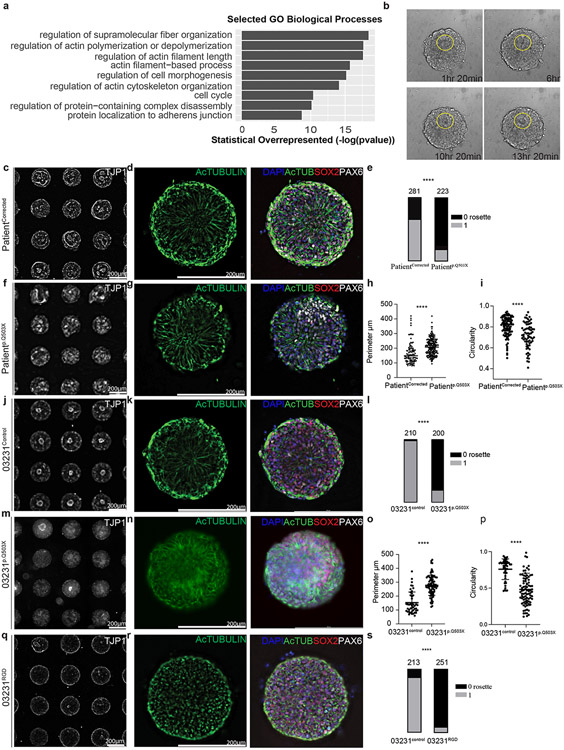
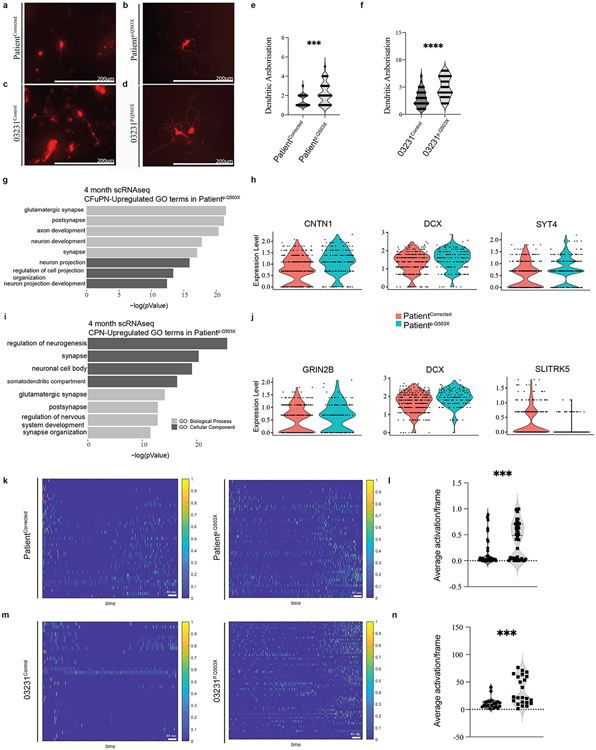
Genes involved in synaptic function are enriched among those with autism spectrum disorder (ASD)-associated rare genetic variants. Dysregulated cortical neurogenesis has been implicated as a convergent mechanism in ASD pathophysiology, yet it remains unknown how 'synaptic' ASD risk genes contribute to these phenotypes, which arise before synaptogenesis. Here, we show that the synaptic Ras GTPase-activating (RASGAP) protein 1 (SYNGAP1, a top ASD risk gene) is expressed within the apical domain of human radial glia cells (hRGCs). In a human cortical organoid model of SYNGAP1 haploinsufficiency, we find dysregulated cytoskeletal dynamics that impair the scaffolding and division plane of hRGCs, resulting in disrupted lamination and accelerated maturation of cortical projection neurons. Additionally, we confirmed an imbalance in the ratio of progenitors to neurons in a mouse model of Syngap1 haploinsufficiency. Thus, SYNGAP1-related brain disorders may arise through non-synaptic mechanisms, highlighting the need to study genes associated with neurodevelopmental disorders (NDDs) in diverse human cell types and developmental stages.


Conflict of interest statement

Competing interests: G.K. and R.S.A are inventors on U.S. Patent App. No. 16/044236 that describes for generating microarrayed single rosette cultures, and they are co-founders of Neurosetta LLC that is focused on commercializing the culture platform. The remaining authors declare no competing interests.

Figures

Extended Data Figure 1
A. Expression of early forebrain marker genes of PAX6, HES5, EOMES (TBR2) and SYNGAP1 from post-conception day (PCD) 26 to 54 from single cell RNA-seq data. B. UMAP visualization of age-dependent clustering of fetal single cells. C. SYNGAP1 expression at PCD 56 grouped by cell types; intermediate progenitor cells (IPC), neuroepithelial cells (NE), radial glial cells (RGCs) and neurons. D. D.I.V. 7 cortical organoids are composed of cells positive for the neural stem cell marker SOX2, the radial glial progenitor marker PAX6, the nuclear marker DAPI and SYNGAP1. E. A coronal section from E13.5 mouse brain showing expression of the neural stem cell marker SOX2, the tight junction protein TJP1, and SYNGAP1. SYNGAP1 is highly expressed at the ventricular wall. White box indicates the Region of Interest selected for the merged images showing colocalization of DAPI, TJP1, and SYNGAP1. F. Peptide competition assay shows the specificity of the SYNGAP1 antibody used. 5X and 10X concentrations of the commercial antigenic peptide were evaluated, showing a strong reduction in specific signal in the apical wall of the ventricular zone. G. SynGAP1 expression in E18.5 wild type and SynGAP1 KO mouse showing the overall decrease in SynGAP1 levels. Decreased levels of SynGAP are most evident at the VZ.
Extended Data Figure 2
A. Annotated spectra of the SYNGAP1 isoform alpha 1 specific peptide “GSFPPWQQTR” identified from MS analysis of immune-isolated SYNGAP1 protein from D.I.V. 7 organoids. B. Annotated spectra of the SYNGAP1 isoform alpha 1 specific peptide “LLDAQR” identified from MS analysis of immune-isolated SYNGAP1 protein from D.I.V. 7 organoids.
Extended Data Figure 3
A. Selected GO terms for biological processes for SYNGAP1 immunoprecipitation data collected from D.I.V. 7 cortical organoids. B. Schematic of line generation details for isogenic control of Patientp.Q503X. C. Chromatogram of the generated corrected line (PatientCorrected). The truncating “T” was substituted with the wild type “C” base pair. D. Representative Western blot for SYNGAP1 in the Patient p.Q503X(P), PatientCorrected (C) and KO (K) iPSCs derived neurons showing a reduction of SYNGAP1 levels in P and complete loss in K iPSCs E. Quantification of the western blot shows significant reduction in SYNGAP1 levels in Patient p.Q503X iPSCs compared to the PatientCorrected iPSCs in four biological replicates. Individual dots represent independent replicates. Data are presented as mean values± SD. Statistical analysis was performed using unpaired two-tailed t-test. P value <0.01. F. Quantification of the SYNGAP1 peptide. Graphical representation of SYNGAP1 protein levels quantified by timed parallel reaction monitoring (tRPM). Plot shows a decrease of SYNGAP1 total protein levels in Patientp.Q503X:64.83 (51.6%) as compared to its corresponding isogenic control (PatientCorrected): 125.6 expressed as fg peptide/ug digested protein. Individual dots represent 20 organoids pooled together. N=9 across three independent differentiations. Data are presented as mean values ± SD. Statistical analysis was performed using unpaired two-tailed t-test. P value <0.0001. G. Karyotypic analysis of PatientCorrected iPSCs revealed a normal karyotype. H. Chromatogram of the Patientp.Q503X iPSCs carrying the truncating mutation. I. PCR of RGD, Patientp.Q503X, 03231 cell line. J. Chromatogram of the 03231Control iPSCs carrying the wild type sequence K. Chromatogram of the 03231RGD iPSCs carrying the homozygous mutation in the RGD domain. L. Karyotypic analysis of 03231RGD iPSCs revealed a normal karyotype. M. Chromatogram of the 03231p.Q503X iPSCs carrying the truncating mutation. N. PCR of 03231Control cell line and 03231p.Q503X cell line showing haploinsuffiency in the 03231p.Q503X line. O. Karyotypic analysis of 03231p.Q503X iPSCs revealed a normal karyotype.
Extended Data Figure 4
A. Single rosette from the PatientCorrected cell line expressing SOX2 and PAX6 markers. B. Single rosette from the Patientp.Q503X cell line expressing SOX2 and PAX6 markers. C. Single rosette from the 03231Control cell line expressing SOX2 and PAX6 markers. D. A single rosette was generated from PatientCorrected line. The rosette is composed of cells positive for the neural progenitor marker SOX2 and SYNGAP1. SYNGAP1 is also highly expressed at the apical wall of the lumen. The tight junction protein TJP1 labels the central luminal space of the rosette. Merged images show colocalization of DAPI, SYNGAP1, and TJP1. E. A single rosette was generated from Patientp.Q503X line. The rosette is composed of cells positive for the neural progenitor marker SOX2 and SYNGAP1. Merged images show colocalization of DAPI, SYNGAP1, and TJP1. The Patientp.Q503X single rosettes display a larger and more irregularly shaped central luminal space. F. A single rosette was generated from 03231Control line. The rosette is composed of cells positive for the neural progenitor marker SOX2 and SYNGAP1. SYNGAP1 is also highly expressed at the apical wall of the lumen. Merged images show colocalization of DAPI, SYNGAP1, and TJP1. G. Single rosette from the 03231p.Q503X cell line expressing SOX2 and PAX6 markers. H. Single rosette from the 03231RGD cell line expressing SOX2 and PAX6 markers. I. A single rosette was generated from 03231p.Q503X line. The rosette is composed of cells positive for the neural progenitor marker SOX2 and SYNGAP1. Merged images show colocalization of DAPI, SYNGAP1, and TJP1. The tight junction protein TJP1 is weakly expressed with little to no central luminal organization. J. A single rosette was generated from 03231RGD line. The rosette is composed of cells positive for the neural progenitor marker SOX2 and SYNGAP1. Merged images show colocalization of DAPI, SYNGAP1, and TJP1. The tight junction protein TJP1 is weakly expressed with no central luminal organization. K. A Survival curve for organoids generated from the 03231RGD line. Data was collected from 10 independent differentiations, each representing an average of 6 organoids for each time point. Single dots represent total averages for that time point. Student’s t-test was performed (Day 30 P=0.0134, Day 60 P<0.0001). Data is shown as mean ± SEM.
Extended Data Figure 5
A. Representative single channel images from BrdU pulse-chase experiments in 2-month-old PatientCorrected organoids. Images show the expression of the progenitor marker SOX2, the neuronal marker NeuN and the proliferative marker BrdU. B. Representative single channel images from BrdU pulse-chase experiments in 2-month-old Patientp.Q503X organoids. Images show the expression of the progenitor marker SOX2, the neuronal marker NeuN and the proliferative marker BrdU. C. Representative single channel images from BrdU pulse-chase experiments in 2-month-old 03231Control organoids. Images show the expression of the progenitor marker SOX2, the neuronal marker NeuN and the proliferative marker BrdU. D. Representative single channel images from BrdU pulse-chase experiments in 2-month-old 03231p.Q503X organoids. Images show the expression of the progenitor marker SOX2, the neuronal marker NeuN and the proliferative marker BrdU.
Extended Data Figure 6
A. Representative images of SOX2 and NeuN expression in 2-month-old 03231Control and 03231p.Q503X organoids. B. Total number of SOX2+ cells in 03231Control and 03231p.Q503X organoids. Dot represents an average value for all organoids from 1 differentiation. Two-tailed t-test on average values for 10 organoids from 4 differentiations. P Value =0.0112. Data shown as mean ± SD. C. Total number of NeuN positive cells in 03231Control and 03231p.Q503X organoids. Two-tailed t-test on average values for 10 organoids from 4 differentiations. P Value =0.0217. Data shown as mean ± SD. D. TBR2 expression in 2-month-old PatientCorrected and Patientp.Q503X organoids. E. Total number of TBR2+ cells in PatientCorrected and Patientp.Q503X organoids. Two-tailed t-test on average values for 10 organoids from 4 differentiations. P= ns. Data shown as mean ± SD. F. SOX2 positive area in the dorsal cortex of E18.5 mouse brains. Data from WT=27, HET=24, KO =27 ventricles from 4 brains for each genotype. One Way ANOVA between the genotypes, showing a decrease in the SOX2 positive progenitor regions in Het and KO as compared to WT mice. P<0.0001. Data shown as mean ± SD. G. SOX2 positive area in the lateral cortex of E18.5 mouse brains. Data from WT=27, HET=24, KO =27 from 4 brains for each genotype. One Way ANOVA between the genotypes. P=ns. Data shown as mean ± SD. H. TBR2 expression in WT, Het and KO E18.5 mouse brains. I. TBR2 thickness in the cortical plate in in WT, Het and KO E18.5 mouse brain sections. One Way ANOVA on 8 ventricles from four animals for each genotype. P=ns. Data shown as mean ± SD. J. Number of TBR2+ cells in 100 um2 of the VZ area in WT, Het and KO E18.5 mouse brains. One Way ANOVA on 6 ventricles from four animals for each genotype. P=ns. Data shown as mean ± SD. K. Organoid area over time from the PatientCorrected and Patientp.Q503X lines. Data from 10 independent differentiations, each representing an average of 6 organoids for each time point. Data shown as mean ± SEM. L. Organoid perimeter over time from the PatientCorrected and Patientp.Q503X lines. Data from 10 independent differentiations, each representing an average of 6 organoids for each time point. Data shown as mean ± SEM. M. Head circumference measurements represented as dots from the Patientp.Q503X donor plotted against the WHO child growth standards.
Extended Data Figure 7
A. GO-Terms from single cell RNA sequencing preformed in 2-month-old Patientp.Q503X and PatientCorrected organoids. Graphical representation of upregulated terms for Patientp.Q503X Corticofugal Projection Neurons (CFuPN). Main biological process, cellular component, and molecular function GO-Terms are related to neuronal differentiation and synapse formation. Wilcoxon rank sum test was used for DEGs between control and mutant organoids for each cluster. B. GO-Terms from single cell RNA sequencing preformed in 4-month-old Patientp.Q503X and PatientCorrected organoids. Graphical representation of upregulated GO-Terms in Patientp.Q503X Callosal Projection Neurons (CPN). Main biological process and cellular component GO-Terms are related to neuronal differentiation and synapse formation. Wilcoxon rank sum test was used for DEGs between control and mutant organoids for each cluster. C. Combined t-distributed stochastic neighbor embedding (t-SNE) from single cell RNA sequencing analysis of pooled Patientp.Q503X and PatientCorrected organoids at 4 months. D. Individual t-SNE plot for pooled PatientCorrected organoids at 4 months (n=7540 cells). E. Individual t-SNE plot for pooled Patientp.Q503X organoids at 4 months (n=3123 cells). F. ΔF/F(t) from GCaMP6f2 recordings of PatientCorrected and Patientp.Q503X organoids. G. Calcium spike frequency analysis on 2-month-old Patientp.Q503X organoids before and during bath application of glutamate (Glu). Unpaired two-tailed t-test performed on 16 cells from Patientp.Q503X organoids, from 3 independent experiments. P value = 0.0005. Data shown as mean ± SD H. ΔF/F(t) from GCaMP6f2 recordings of 03231Control and 03231p.Q503X organoids. I. Calcium spike frequency analysis on 2-month-old Patientp.Q503X organoids before and during bath application of tetrodotoxin (TTX). Unpaired two-tailed t-test performed on 9 cells from Patientp.Q503X organoids, from 3 independent experiments. P value =0.0001. Data shown as mean ± SD.
Figure 1.
Figure 1.. SYNGAP1 is expressed in human radial glia progenitors and colocalizes with the tight junction protein TJP1.
A. SynGO analysis results from D.I.V. 7 corrected organoids proteomic data set. 21 organoids from 3 independent experiments were analyzed. B. Two-month-old control organoid stained for the neural progenitor marker SOX2, the tight junction protein TJP1 and SYNGAP1. SYNGAP1 is highly expressed at the ventricular wall. White box indicates the region of interest selected for the merged images showing colocalization of the nuclear marker DAPI, TJP1, and SYNGAP1. C. Schematic for the protein interaction network of SYNGAP1 protein. Analysis performed on 21 organoids from 3 independent experiments at D.I.V. 7. The tight junction protein TJP1 is highlighted in pink. D. Two-month-old PatientCorrected organoid stained for the radial glial marker NESTIN, the neuronal marker MAP2, and SYNGAP1. SYNGAP1 is highly expressed within mature MAP2 positive neuronal populations outside of the VZ, as well as in NESTIN positive cells at the ventricle wall. White box indicates the region of interest selected for the merged images showing colocalization of DAPI, SYNGAP1, and NESTIN positive cells. E. Schematic of key functional domains within the SYNGAP1 alpha 1 isoform and TJP1 proteins including representative spectra of the two identified peptides for the alpha1 isoform. F. Immunohistochemical staining of the human brain at gestational week 17. Tissue section is from the prefrontal cortex at the level of the lateral ventricle and medial ganglionic eminence. White box indicates the region of interest selected for the merged images showing colocalization of DAPI, TJP1, and SYNGAP1.
Figure 2.
Figure 2.. SYNGAP1 plays a role in the cytoskeletal organization of human radial glia.
A. GO terms from bulk RNA sequencing of 100 D.I.V. 7 control organoids from 2 independent experiments. Statistical overrepresentation test (FDR, P < 0.05). B. Live imaging frames of PatientCorrected rosette formation from day 5 to day 7. C. Single rosettes array from the PatientCorrected line labeled with TJP1 staining. D. Single rosette generated from PatientCorrected iPSCs with SOX2+ cells, PAX6+ radial glial progenitors, and acetylated tubulin+ microtubules. E. Quantification of the rosettes number from the PatientCorrected and Patientp.Q503X lines. Two-tailed chi-square test performed on n=281 PatientCorrected and n= 223 Patientp.Q503X single rosettes from 3 independent experiments. P value <0.0001. F. TJP1+ single rosettes array from the Patientp.Q503X line. G. Single rosette from Patientp.Q503X iPSCs with SOX2+, PAX6+ and acetylated tubulin+ cells. H. Quantification of the rosette lumen perimeter in the PatientCorrected and Patientp.Q503X lines. Unpaired two-tailed t-test performed on n=94 PatientCorrected and n= 198 Patientp.Q503X single rosettes from 3 independent experiments. P value <0.0001. I. Quantification of the circularity of the rosette lumen in the PatientCorrected and Patientp.Q503X lines. Unpaired two tailed t-test performed on n=99 PatientCorrected and n= 69 Patientp.Q503X single rosettes from 3 independent experiments. P value <0.0001. J. TJP1+ Single rosettes array from the 03231Control line. K. Single rosette from 03231Control iPSCs and composed of SOX2+, PAX6+ and Acetylated tubulin+ cells. L. Quantification of the number of rosettes formed in the 03231Control and 03231p.Q503X lines. Two-tailed chi-square test performed on n=210 03231Control and n= 200 03231p.Q503X single rosettes from 3 independent experiments. P value <0.0001. M. TJP1+ single rosettes array from the 03231p.Q503X line. N. Single rosette from 03231p.Q503X iPSCs with SOX2+, PAX6+ and Acetylated tubulin+ cells. O. Quantification of the perimeter of the rosette lumen in the 03231Control and 03231p.Q503X lines. Unpaired two tailed t-test performed on n=45 03231Control and n= 88 03231p.Q503X single rosettes from 3 independent experiments. P value <0.0001. P. Quantification of the circularity of the rosette lumen from the 03231control and 03231p.Q503X lines. Unpaired two tailed t-test performed on n=45 03231Control and n= 88 03231p.Q503X single rosettes from 3 independent experiments. P value <0.0001. Q. TJP1+ single rosettes from the 03231RGD line. R. Single rosette from 03231RGD iPSCs and composed of SOX2+, PAX6+ and Acetylated tubulin+ cells. S. Quantification of the number of rosettes in the 03231Control and 03231RGD lines. Two-tailed chi-square test performed on n=213 03231Control and n= 251 03231RGD single rosettes from 3 independent experiments. P value <0.0001.
Figure 3.
Figure 3.. SYNGAP1 haploinsufficiency disrupts the organization of the developing cortical plate.
A. Two-month-old PatientCorrected and Patientp.Q503X organoids expressing SOX2 and DAPI. B. VZ thickness of Patientp.Q503X and Patientcorrected organoids. Two-tailed t-test on n=132 VZs from Patientcorrected organoids and n=107 VZs from Patientp.Q503X organoids from 4 independent experiments . Dots represent individual VZs. P value <0.0001 . Data shown as mean ± SD. C. VZs area of Patientp.Q503X and PatientCorrected organoids. Two-tailed t-test on n=132 Patientcorrected and n=106 Patientp.Q503X VZs from 4 independent experiments . Dots represent individual VZs. P value <0.0001 . Data shown as mean ± SD. D. VZs number of Patientp.Q503X and PatientCorrected organoids. Two-tailed t-test on n=7 Patientcorrected and n=7 Patientp.Q503X organoids from 4 independent experiments . Dots represent the mean number of VZs per ROI in individual organoids. P value <0.0001 . Data shown as mean ± SD. E. Two-month-old 03231Control and 03231p.Q503X expressing SOX2 and DAPI. F. VZ thickness of 03231p.Q503X and 03231Control organoids. Two-tailed t-test on n=68 03231Control and n=111 03231p.Q503X VZs from 4 independent experiments. Dots represent individual VZs. P value = 0.0078 . Data shown as mean ± SD. G. VZs area of 03231p.Q503X and 03231Control organoids. Two-tailed t-test on n=84 03231Control and n=68 03231p.Q503X VZs from 4 independent experiments. Dots represent individual VZs. P value = 0.0046 . Data shown as mean ± SD. H. VZs number of 03231p.Q503X and PatientCorrected organoids. Two-tailed t-test on n = 31 03231Control and n=25 03231p.Q503X VZs from 4 independent experiments. Dots represent the mean number of VZs per ROI in individual organoids. P value = 0.0134 . Data shown as mean ± SD. I. Two-month-old PatientCorrectedorganoids expressing SOX2 and MAP2. Dashed yellow circles identify VZ regions. J. Two-month-old Patientp.Q503X organoids with SOX2+ and MAP2+cells. K. VZs organization in PatientCorrected and Patientp.Q503X organoids. Two-tailed chi-square test on mean values of VZs from 3-9 ROI of 3 organoids, analyzed in 4 independent experiments. P value <0.0001. Data shown as mean ± SD. L. Two-month-old 03231Control organoids expressing SOX2 and MAP2 markers. M. Two-month-old 03231p.Q503X organoids with SOX2 and MAP2+cells. N. VZs organization in 03231Control and 03231p.Q503X organoids. Two-tailed chi-square test on mean values of VZs from 3-9 ROI of 3 organoids, analyzed in 4 independent experiments. P value <0.0001. Data is shown as mean ± SD. O. PatientCorrected and Patientp.Q503X organoids stained for SOX2, NeuN and BrdU. P. Binning analysis of BrdU+/SOX2+ cells. Two-way ANOVA performed on 15 Patient p.Q503Xventricles and 12 PatientCorrected from 3 independent experiments. P v alue Bin 1 = 0.4, P v alue Bin 3 = 0.2. Data is shown as mean ± SD. Q. Binning analysis of BrdU+/NeuN+ cells. Two-way ANOVA performed on 15 Patient p.Q503Xventricles and 12 PatientCorrected from 3 independent experiments. P v alue Bin 4 = 0.0094. Data represented as mean ± SD. R. 03231Control and 03231tp.Q503X organoids stained SOX2, NeuN and BrdU. S. Binning analysis of BrdU+/SOX2+ cells. Two-way ANOVA performed on 18 03231p.Q503X ventricles and 18 03231Control ventricles from 3 independent experiments. P v alue Bin 1 = 0.0001>, P v alue Bin 2 = 0.0110, P v alue Bin 3 = 0.0076. Data represented as mean ± SD. T. Binning analysis of BrdU+/NeuN+ cells. Two-way ANOVA performed on 18 03231p.Q503Xventricles and 18 03231Control ventricles from 3 independent experiments. P v alue Bin 1 = 0.0448, P v alue Bin 3 = 0.0400, P v alue Bin 7 = 0.0094. Data represented as mean ± SD.
Figure 4.
Figure 4.. SYNGAP1 haploinsufficiency affects the division mode of human radial Glial progenitors
A. PatientCorrected and Patientp.Q503X organoids display SOX2 expression in the VZ, dividing neural progenitors marked by phospho-vimentin (pVIM), and the centrosome labeling marker Pericentrin. B. Representation of cell divisions at the VZ wall illustrating self-renewing divisions (vertical, angle between 60 to 90 degrees from the apical wall to the mitotic spindle) and differentiative divisions (oblique, 30 to 60 degrees; horizontal, 0 to 30 degrees). C. Cleavage angle analysis in cells from PatientCorrected and Patientp.Q503X organoids. Two-tailed Mann-Whitney test performed on 195 cells for each line, from 3 independent experiments. P value < 0.0001. D. 03231Control and 03231p.Q503X organoids display SOX2, pVIM and Pericentrin expression in the VZ. E. Cleavage angle analysis from 03231Control and 03231p.Q503X organoids. Two-tailed Mann-Whitney test performed on 78 03231Control and 188 03231p.Q503X cells from 3 independent experiments. P value < 0.0001. F. Combined t-distributed stochastic neighbor embedding (t-SNE) from single cell RNA sequencing analysis of all organoids at 2 months. G. Individual t-SNE plots for three individual PatientCorrected organoids at 2 months. Organoid #1 (n= 8676 cells), Organoid #2 (n= 8377), Organoid #3 (n= 7687). H. Individual t-SNE plots for three individual Patientp.Q503X organoids at 2 months. Organoid #1 (n= 7511 cells), Organoid #2 (n= 9203), Organoid #3 (n= 9138). I. Graphical representation of downregulated GO-Terms in Patientp.Q503X apical radial glia (aRG). Main biological process and cellular component GO-Terms are related to cell cycle and division. J. Graphical representation of upregulated GO-Terms in Patientp.Q503X apical radial glia (aRG). Main biological process, cellular component and molecular function GO-Terms are related to neuronal differentiation and synapse formation. K. Violin plot of gene expression for CCPG1 (Cell Cycle Progression Gene 1) in each organoid for PatientCorrected and Patientp.Q503X. Gene expression of aRG cells from individual organoids (n= 3 technical replicates for cell line) was analyzed using Wilcoxon rank sum test. Adjusted P v alue = 7.60E-07. White dot denotes median, dashed line indicates upper quartile. L. Violin plot of gene expression for MAP2 in each organoid for PatientCorrected and Patientp.Q503X. Gene expression of aRG cells from individual organoids (n= 3 technical replicates for cell line) was analyzed using Wilcoxon rank sum test. Adjusted P v alue = 0.0007. White dot denotes median, dashed line indicates upper quartile.
Figure 5.
Figure 5.. Decrease in SYNGAP1 levels lead to asynchronous cortical neurogenesis
A. SOX2 expression in 2 month old PatientCorrected and Patientp.Q503X organoids. B. NeuN expression in 2 month old PatientCorrected and Patientp.Q503X organoids. C. Quantification of the total number of SOX2+ cells normalized to DAPI in PatientCorrected and Patientp.Q503X organoids. Each dot represents an average value for n= 10 organoids from 1 differentiation. Two-tailed t-test on n=4 differentiations. P v alue =0.0032. Data represented as mean ± SD. D. Quantification of the total number of NeuN+ cells normalized to DAPI in PatientCorrected and Patientp.Q503X organoids. Each dot represents an average value for n= 10 organoids from 1 differentiation. T wo-tailed t -test on n=4differentiations. P value =0.0184. Data shown as mean ± SD. E. SOX2 expression in SYNGAP1 Wild Type (WT), Heterozygous (Het) and KnockOut (KO) E18.5 mice. F. NEUN expression in SYNGAP1 Wild Type (WT), Heterozygous (Het) and Knock Out (KO) E18.5 mice. G. Quantification of SOX2 thickness lining the ventricular zone of E18.5 mouse brain lateral ventricles. One Way ANOVA performed on WT= 9, HET= 12, KO =11 ventricles . P value <0.0001. Data shown as mean ± SD. H. Quantification of NeuN cortical plate thickness in E18.5 mouse brains sections. One Way ANOVA on WT=8, HET= 8, KO =8 ventricles . WT vs Het P value =0.0311, WT vs KO P value <0.0001, Het vs KO P value <0.0001. Data shown as mean ± SD I. Quantification of the number of SOX2+ cells in 100 um2 of the VZ area. One Way ANOVA on 6 ventricles from four animals for each genotype. P value=ns. Data shown as mean ± SD. J. Quantification of the number of NeuN+ cells in 100 um2 of the VZ area. One Way ANOVA on 6 ventricles from four animals for each genotype. P value =ns. Data shown as mean ± SD.
Figure 6.
Figure 6.. SYNGAP1 organoids exhibit accelerated maturation of cortical projection neurons.
A. Representative image of RFP+ bipolar neuron from a 4-month-old PatientCorrected organoid used for dendritic arborization analysis. B. Representative image of RFP+ multipolar neuron from a 4-month-old Patientp.Q503X organoid used for dendritic arborization analysis. C. Representative image of RFP+ bipolar neuron from a 4-month-old 03231Control organoid used for dendritic arborization analysis. D. Representative image of RFP+ multipolar neuron from a 4-month-old 03231p.Q503X organoid used for dendritic arborization analysis. E. Dendritic arborization analysis on 4-month-old PatientCorrected and Patientp.Q503X organoids. Unpaired two-tailed t-test on 28 cells for PatientCorrected organoids and 49 cells for Patientp.Q503X organoids, from 3 independent experiments. P value = 0.0009. F. Dendritic arborization analysis on 4-month-old 03231Control and 03231p.Q503X organoids. Unpaired two-tailed t-test on 35 cells for 03231Control organoids and 36 cells for 03231p.Q503X organoids, from 3 independent experiments. P value = <0.0001. G. GO-Terms from single cell RNA sequencing of 4-month-old Patientp.Q503X and PatientCorrected organoids. Graphical representation of upregulated terms for Patientp.Q503X Corticofugal Projection Neurons (CFuPN). H. Violin plot for selected genes showing expression levels between PatientCorrected and Patientp.Q503X organoids. DCX (Adj. P value = 0.04153089), CNTN1 (Adj. P value = 4.39E-07), SYT4 (Adj. P value = 6.77E-06). I. GO-Terms from single cell RNA sequencing of 4-month-old Patientp.Q503X and PatientCorrected organoids. Graphical representation of upregulated GO-Terms in Patientp.Q503X Callosal Projection Neurons (CPN). J. Violin plot for selected genes showing expression levels between PatientCorrected and Patientp.Q503X organoids. DCX (Adj. P value = 0.00040542), GRIN2B (P value =0.00031511), SLYTRK5 (P value = 3E-06). K. ΔF/F(t) heatmap from GCaMP6f2 recordings of PatientCorrected and Patientp.Q503X organoids. L. Calcium average activation per frame analysis on 4-month-old PatientCorrected and Patientp.Q503X organoids. Unpaired two-tailed t-test on 40 recordings from 12 PatientCorrected and PatientpQ503X organoids from 3 independent differentiations. P value =0.0006. M. ΔF/F(t) heatmap from GCaMP6f2 recordings of 03231Control and 03231p.Q503X organoids. N. Calcium average activation per frame analysis on 4-month-old 03231Control and 03231p.Q503X organoids. Unpaired two-tailed t-test on a total of 20 recordings in 6 03231Control organoids and 24 recordings in 8 PatientpQ503X organoids from 3 independent differentiations. P value =0.0012.

References

    1. De Rubeis S. et al. Synaptic, transcriptional and chromatin genes disrupted in autism. Nature 515, 209–215 (2014). 10.1038/nature13772 - DOI - PMC - PubMed
    1. Paulsen B. et al. Autism genes converge on asynchronous development of shared neuron classes. Nature 602, 268–273 (2022). 10.1038/s41586-021-04358-6 - DOI - PMC - PubMed
    1. Mariani J. et al. FOXG1-Dependent Dysregulation of GABA/Glutamate Neuron Differentiation in Autism Spectrum Disorders. Cell 162, 375–390 (2015). 10.1016/j.cell.2015.06.034 - DOI - PMC - PubMed
    1. Jourdon A. et al. ASD modelling in organoids reveals imbalance of excitatory cortical neuron subtypes during early neurogenesis. bioRxiv, 2022.2003.2019.484988 (2022). 10.1101/2022.03.19.484988 - DOI
    1. Villa CE et al. CHD8 haploinsufficiency links autism to transient alterations in excitatory and inhibitory trajectories. Cell Rep 39, 110615 (2022). 10.1016/j.celrep.2022.110615 - DOI - PubMed

Substances