. 2023 Nov;29(11):2885-2901.
doi: 10.1038/s41591-023-02610-2. Epub 2023 Nov 9.

Global variation in diabetes diagnosis and prevalence based on fasting glucose and hemoglobin A1c

Collaborators

Global variation in diabetes diagnosis and prevalence based on fasting glucose and hemoglobin A1c

NCD Risk Factor Collaboration (NCD-RisC). Nat Med. 2023 Nov.

Abstract

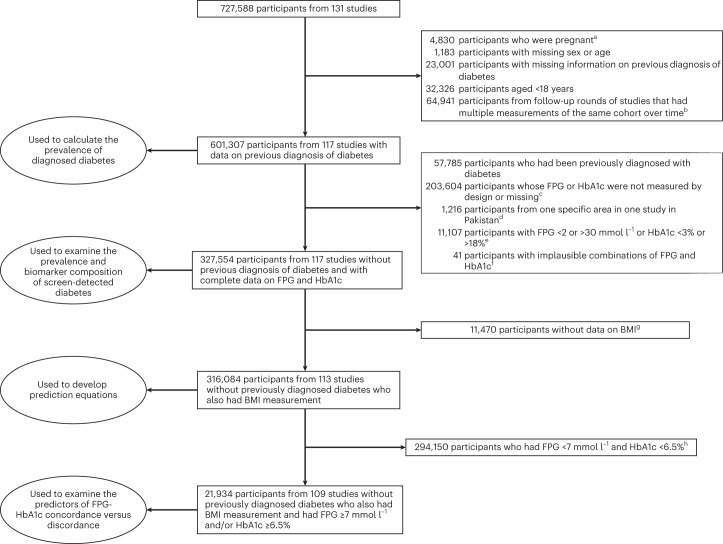
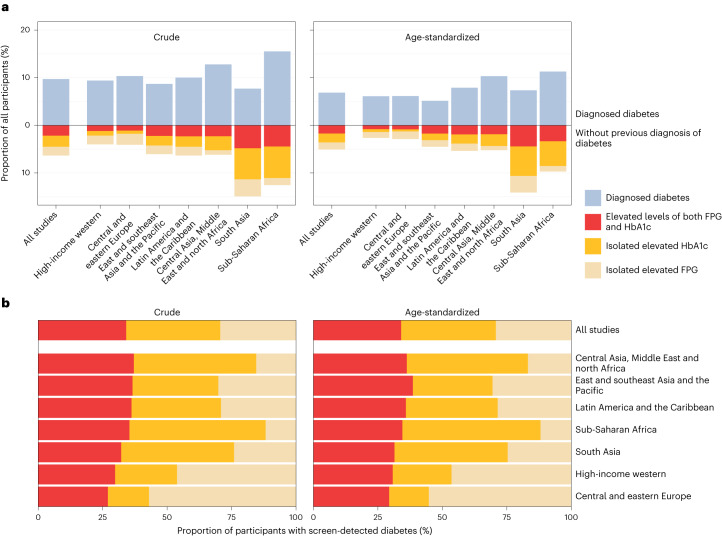
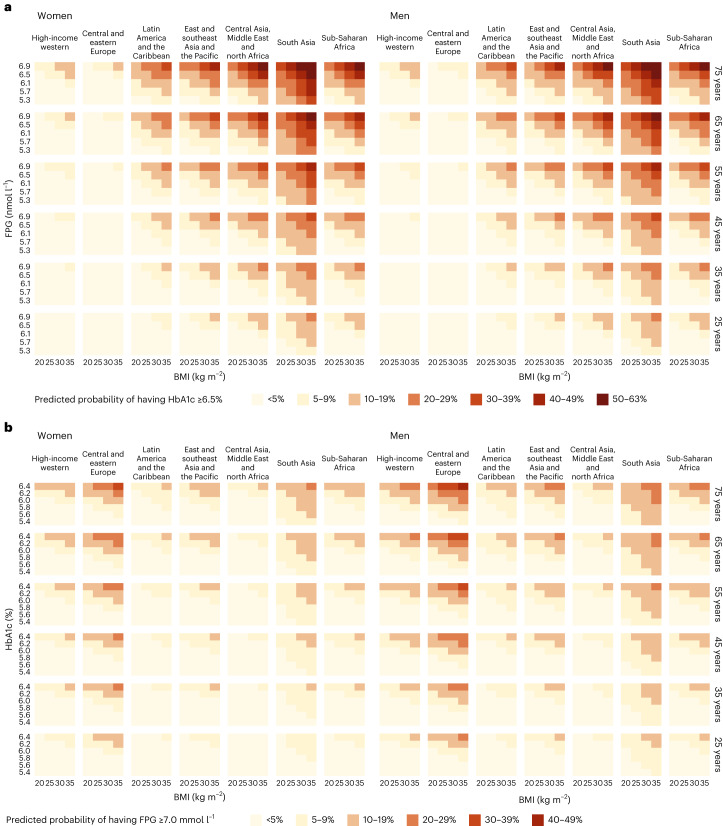
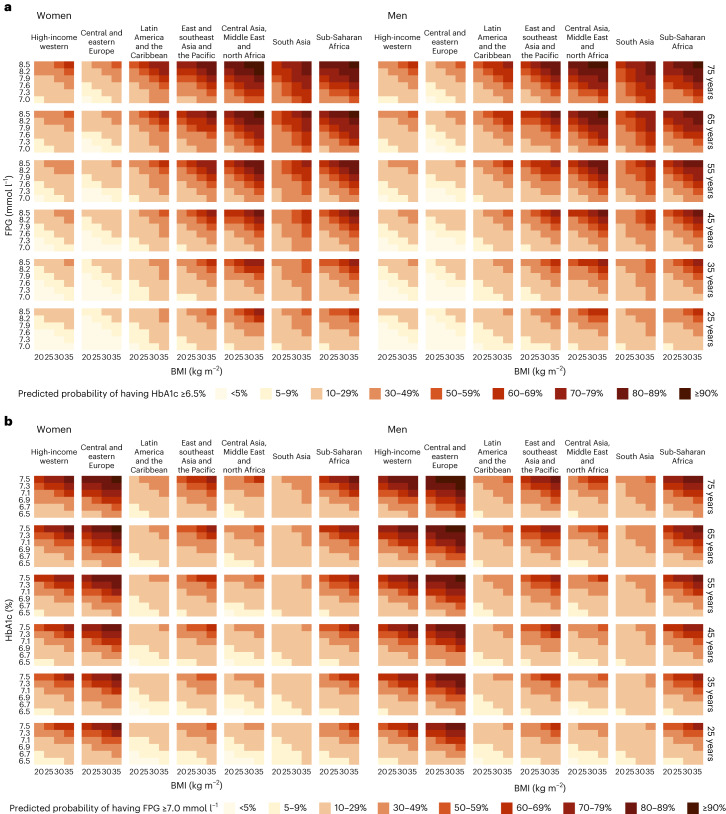
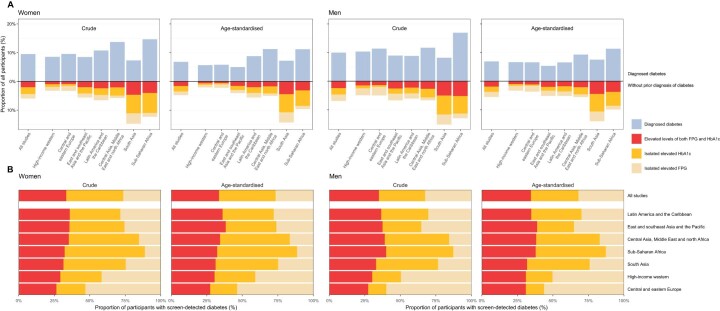
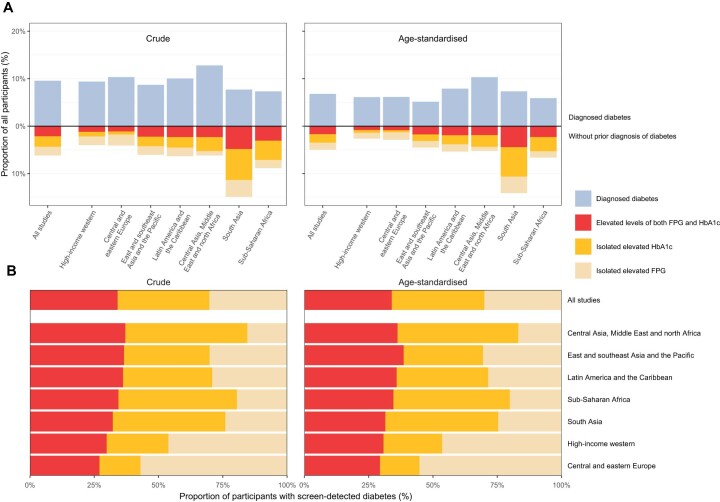
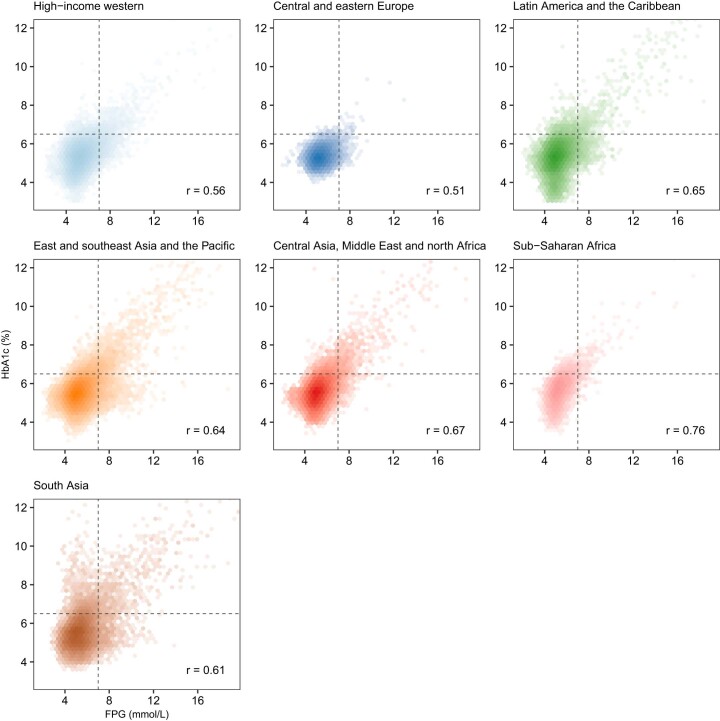
Fasting plasma glucose (FPG) and hemoglobin A1c (HbA1c) are both used to diagnose diabetes, but these measurements can identify different people as having diabetes. We used data from 117 population-based studies and quantified, in different world regions, the prevalence of diagnosed diabetes, and whether those who were previously undiagnosed and detected as having diabetes in survey screening, had elevated FPG, HbA1c or both. We developed prediction equations for estimating the probability that a person without previously diagnosed diabetes, and at a specific level of FPG, had elevated HbA1c, and vice versa. The age-standardized proportion of diabetes that was previously undiagnosed and detected in survey screening ranged from 30% in the high-income western region to 66% in south Asia. Among those with screen-detected diabetes with either test, the age-standardized proportion who had elevated levels of both FPG and HbA1c was 29-39% across regions; the remainder had discordant elevation of FPG or HbA1c. In most low- and middle-income regions, isolated elevated HbA1c was more common than isolated elevated FPG. In these regions, the use of FPG alone may delay diabetes diagnosis and underestimate diabetes prevalence. Our prediction equations help allocate finite resources for measuring HbA1c to reduce the global shortfall in diabetes diagnosis and surveillance.


Conflict of interest statement

A.N.W. reports an honorarium from Sanofi for serving as a panel member at an educational event on thyroid cancer. The authors are responsible for the views expressed in this article and they do not necessarily represent the views, decisions or policies of the institutions with which they are affiliated.

Figures

Fig. 1
Fig. 1. Flowchart of data cleaning and use.
aExcluded because glucose metabolism changes during pregnancy. bData from the first available measurement were used for these participants. cSome surveys only measured glycemic biomarker on a subset of participants for logistic or budget reasons. dExcluded because glycemic measurements in these participants were systematically different from the rest from the same study, possibly because the specific area had high prevalence of thalassemia. eExcluded because such values are more likely to be due to data recording error than values within the range. fWe removed participants for implausible pairs of FPG and HbA1c using the method of local outlier factor (LOF). This approach detects data combinations that are extremes in the joint density of the variable pairs (for example, a participant with FPG of 5 mmol l−1 and HbA1c of 17%, or with FPG of 28 mmol l−1 and HbA1c of 5%). We identified extremes as those measurements whose measure of local density by LOF method is less than half of the average of their 100 nearest neighbors. gIncluding all 2,436 participants from four studies that did not measure BMI. hIncluding all 3,455 participants from four studies in which all individuals without previously diagnosed diabetes had FPG < 7.0 mmol l−1 and HbA1c < 6.5%.
Fig. 2
Fig. 2. Extent and composition of diagnosed and screen-detected diabetes by region.
a, Crude and age-standardized proportion of participants with diagnosed or screen-detected diabetes and, for those without previous diagnosis, whether they had isolated elevated FPG (FPG ≥ 7.0 mmol l−1 and HbA1c < 6.5%), isolated elevated HbA1c (HbA1c ≥ 6.5% and FPG < 7.0 mmol l−1) or elevated levels of both. b, Crude and age-standardized proportion of participants with screen-detected diabetes who had isolated elevated FPG, isolated elevated HbA1c or elevated levels of both, by region. The contents in b are the same as the segment of a that is below the zero line, scaled to 100% so that the composition of screen-detected diabetes can be compared across regions, regardless of its total prevalence. Having elevated levels of both biomarkers has high positive predictive value for subsequent clinical diagnosis and risk of complications, and hence this group is similar to clinically diagnosed diabetes. In a, regions are ordered by the total proportion of participants who had diagnosed and screen-detected diabetes. In b, regions are ordered by the crude proportion of participants with screen-detected diabetes who had elevated levels of both FPG and HbA1c. Extended Data Fig. 1 provides sex-specific results.
Fig. 3
Fig. 3. The predicted probability of having screen-detected diabetes with isolated elevated HbA1c or FPG.
a,b, The probability, by sex, age and region, of participants who did not have previous diagnosis of diabetes of having elevated HbA1c (≥6.5%) at different FPG and BMI levels (a) and elevated FPG (≥7.0 mmol l−1) at different HbA1c and BMI levels (b). The probabilities were calculated using coefficients of prediction equation model 8, with measurement method set to laboratory for prediction. These results show the probability of having screen-detected diabetes if the second biomarker had been measured, for a person whose first biomarker was below the clinical threshold for diabetes diagnosis.
Fig. 4
Fig. 4. The predicted probability of having screen-detected diabetes with elevated levels of both FPG and HbA1c.
a,b, The probability by sex, age and region of participants who did not have a previous diagnosis of diabetes of having elevated HbA1c (≥6.5%) at different FPG and BMI levels (a) and elevated FPG (≥7.0 mmol l−1) at different HbA1c and BMI levels (b). The probabilities were calculated using coefficients of prediction equation model 8, with measurement method set to laboratory for prediction. These results show the probability that the second biomarker, had it been measured, would be above the clinical threshold for diabetes diagnosis, for a person whose first biomarker was above the clinical threshold for diabetes diagnosis. Having elevated levels of both biomarkers has high positive predictive value for subsequent clinical diagnosis and risk of complications,.
Extended Data Fig. 1
Extended Data Fig. 1. Extent and composition of diagnosed and screen-detected diabetes by region and sex.
(a) Crude and age-standardized proportion of participants with diagnosed or screen-detected diabetes, and, for those without prior diagnosis, whether they had isolated elevated FPG (FPG ≥7.0 mmol/L and HbA1c < 6.5%), isolated elevated HbA1c (HbA1c ≥6.5% and FPG < 7.0 mmol/L) or elevated levels of both, and (b) crude and age-standardized proportion of participants with screen-detected diabetes who had isolated elevated FPG, isolated elevated HbA1c or elevated levels of both, by region and sex. Its contents are the same as the segment of Panel A that is below the zero line, scaled to 100% so that the composition of screen-detected diabetes can be compared across regions, regardless of its total prevalence. Having elevated levels of both biomarkers has high positive predictive value for subsequent clinical diagnosis and risk of complications,, and hence this group is similar to clinically-diagnosed diabetes. In panel A, regions are ordered by the total proportion of participants who had diagnosed and screen-detected diabetes. In panel B, regions are ordered by the crude proportion of participants with screen-detected diabetes who had elevated levels of both FPG and HbA1c.
Extended Data Fig. 2
Extended Data Fig. 2. Extent and composition of diagnosed and screen-detected diabetes by region, after removing two studies in Mauritius from sub-Saharan Africa.
(a) Crude and age-standardized proportion of participants with diagnosed or screen-detected diabetes, and, for those without prior diagnosis, whether they had isolated elevated FPG (FPG ≥7.0 mmol/L and HbA1c < 6.5%), isolated elevated HbA1c (HbA1c ≥6.5% and FPG < 7.0 mmol/L) or elevated levels of both, and (b) crude and age-standardized proportion of participants with screen-detected diabetes who had isolated elevated FPG, isolated elevated HbA1c or elevated levels of both, by region. Its contents are the same as the segment of Panel A that is below the zero line, scaled to 100% so that the composition of screen-detected diabetes can be compared across regions, regardless of its total prevalence. Having elevated levels of both biomarkers has high positive predictive value for subsequent clinical diagnosis and risk of complications,, and hence this group is similar to clinically-diagnosed diabetes. In panel A, regions are ordered by the total proportion of participants who had diagnosed and screen-detected diabetes. In panel B, regions are ordered by the crude proportion of participants with screen-detected diabetes who had elevated levels of both FPG and HbA1c. Regions are in the same order as in Fig. 2.
Extended Data Fig. 3
Extended Data Fig. 3. Relationship between FPG and HbA1c, among participants who had not been previously diagnosed with diabetes, by region.
The shading indicates the density of participants in each region, with darker shades corresponding to more participants and vice versa. The dotted lines are placed at FPG of 7.0 mmol/L and HbA1c of 6.5%, which are common clinical thresholds for diabetes. The numbers on the panels indicate the Pearson correlation coefficient between FPG and HbA1c in each region. A total of 623 (0.2%) participants with FPG of 19-28 mmol/L and/or HbA1c of 12-17% are not shown in the figure so that the axes have sufficient resolution in ranges where the great majority of participants were.

References

    1. Tomic D, Shaw JE, Magliano DJ. The burden and risks of emerging complications of diabetes mellitus. Nat. Rev. Endocrinol. 2022;18:525–539. doi: 10.1038/s41574-022-00690-7. - DOI - PMC - PubMed
    1. Emerging Risk Factors Collaboration. Diabetes mellitus, fasting blood glucose concentration, and risk of vascular disease: a collaborative meta-analysis of 102 prospective studies. Lancet. 2010;375:2215–2222. doi: 10.1016/S0140-6736(10)60484-9. - DOI - PMC - PubMed
    1. Cheng G, Huang C, Deng H, Wang H. Diabetes as a risk factor for dementia and mild cognitive impairment: a meta-analysis of longitudinal studies. Intern. Med. J. 2012;42:484–491. doi: 10.1111/j.1445-5994.2012.02758.x. - DOI - PubMed
    1. Tsilidis KK, Kasimis JC, Lopez DS, Ntzani EE, Ioannidis JP. Type 2 diabetes and cancer: umbrella review of meta-analyses of observational studies. Brit. Med. J. 2015;350:g7607. doi: 10.1136/bmj.g7607. - DOI - PubMed
    1. Mahamat-Saleh Y, et al. Diabetes, hypertension, body mass index, smoking and COVID-19-related mortality: a systematic review and meta-analysis of observational studies. BMJ Open. 2021;11:e052777. doi: 10.1136/bmjopen-2021-052777. - DOI - PMC - PubMed