. 2023 Nov;5(11):1870-1886.
doi: 10.1038/s42255-023-00915-7. Epub 2023 Nov 9.

Vitamin B5 supports MYC oncogenic metabolism and tumor progression in breast cancer

Collaborators, Affiliations

Vitamin B5 supports MYC oncogenic metabolism and tumor progression in breast cancer

Peter Kreuzaler et al. Nat Metab. 2023 Nov.

Abstract

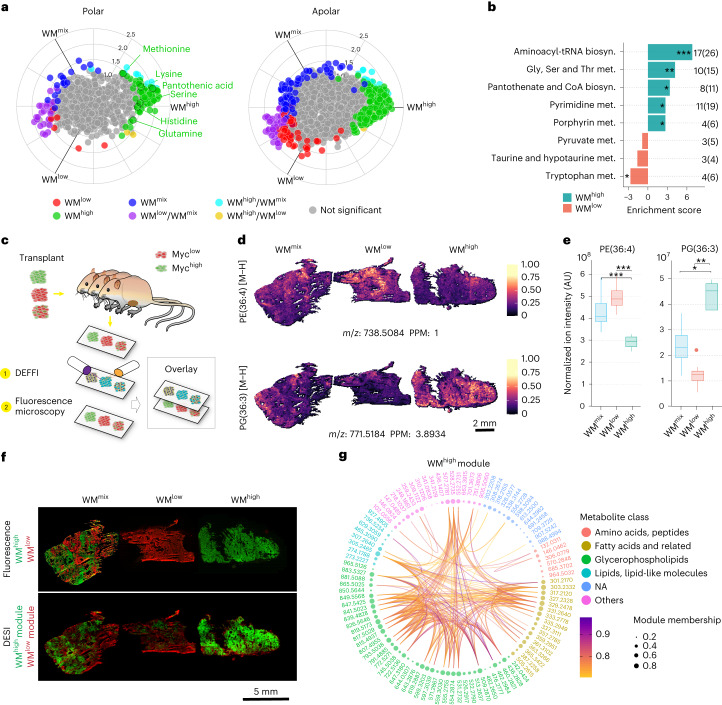
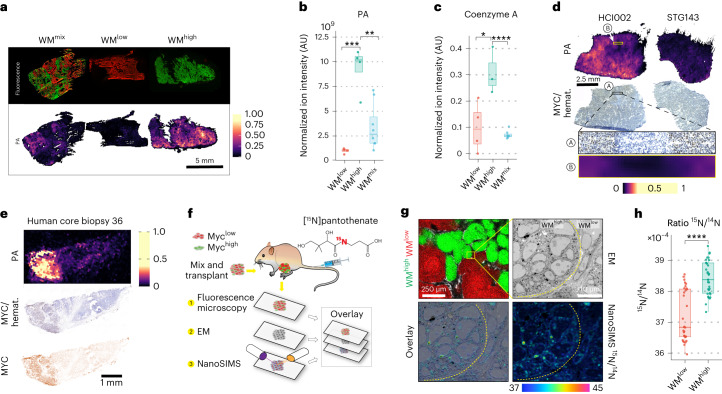
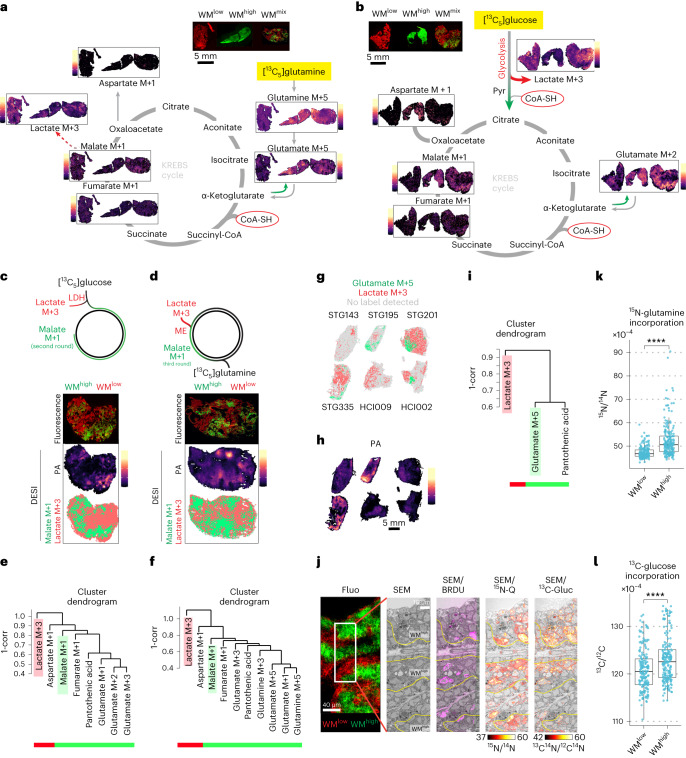
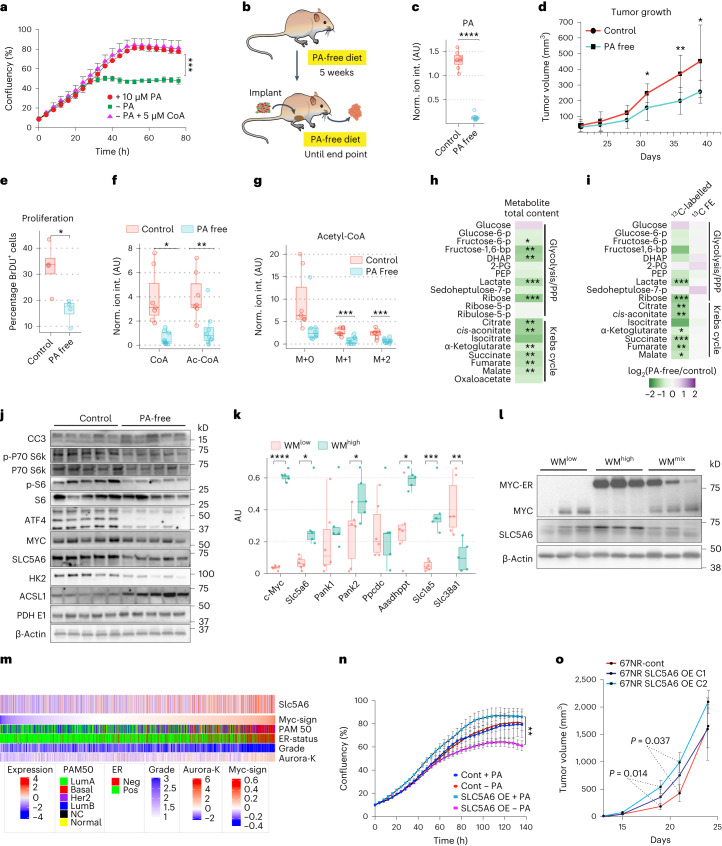
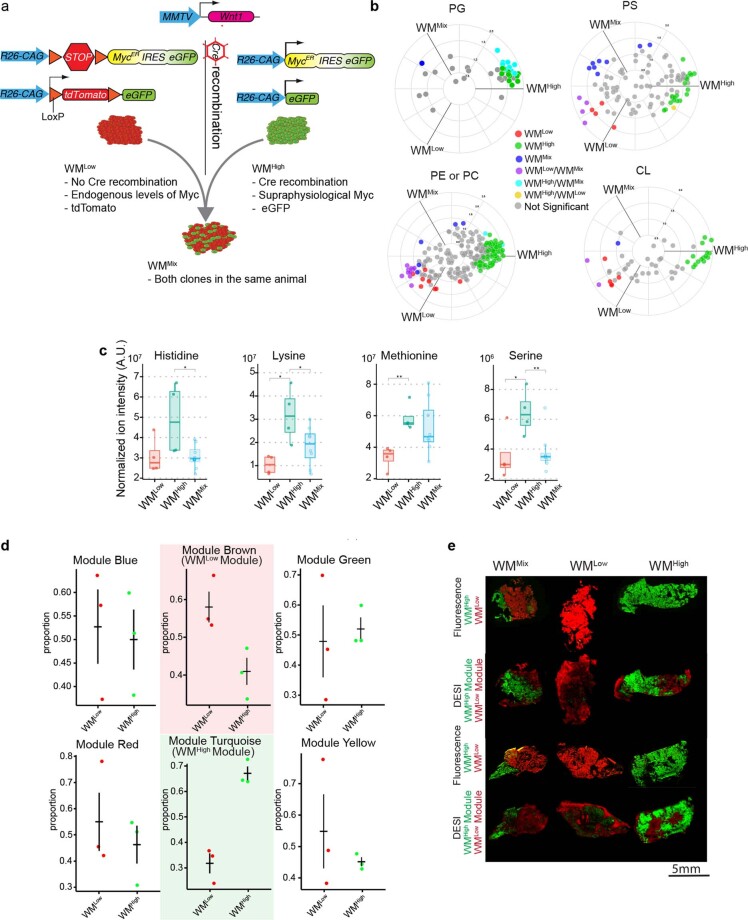
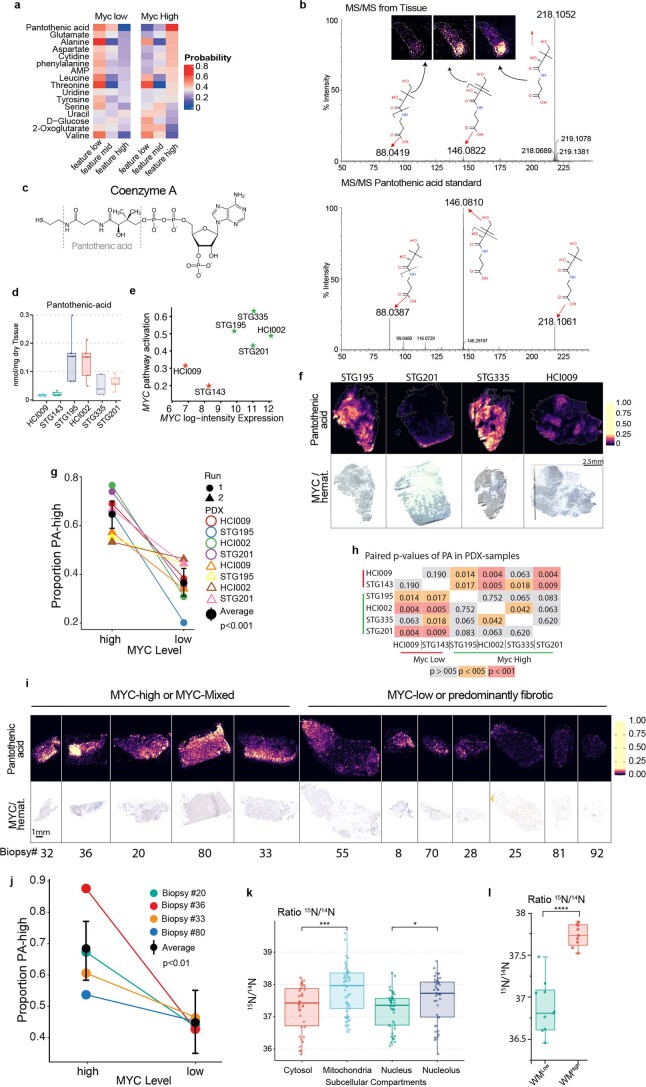
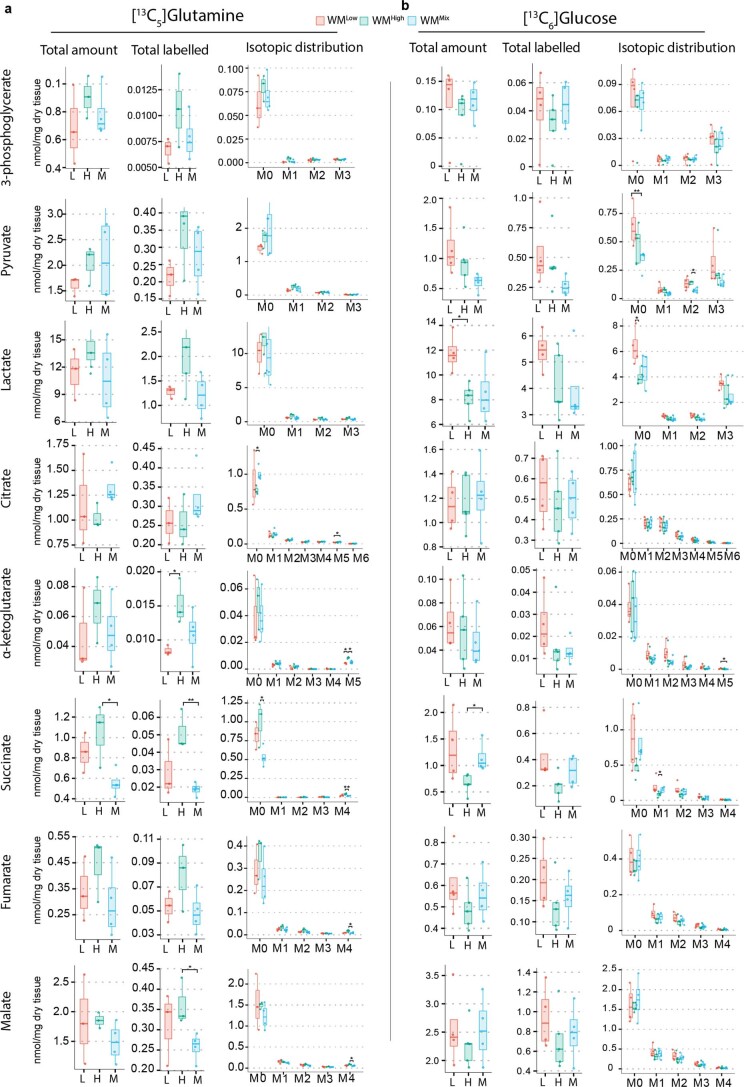
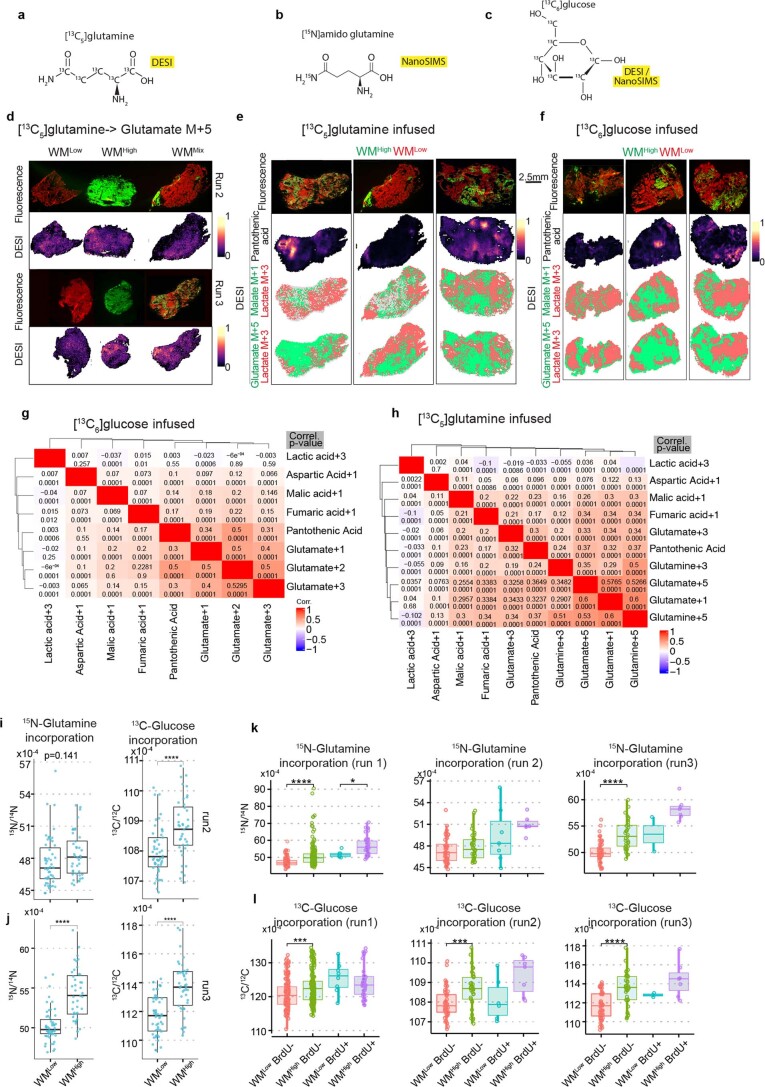
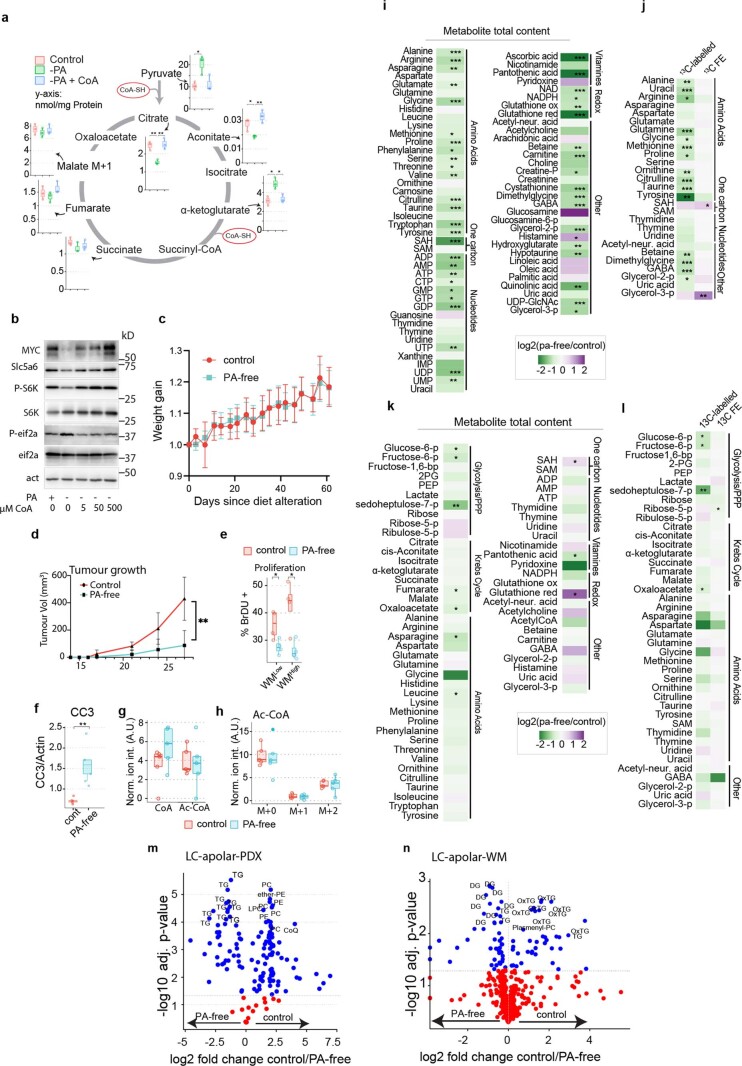
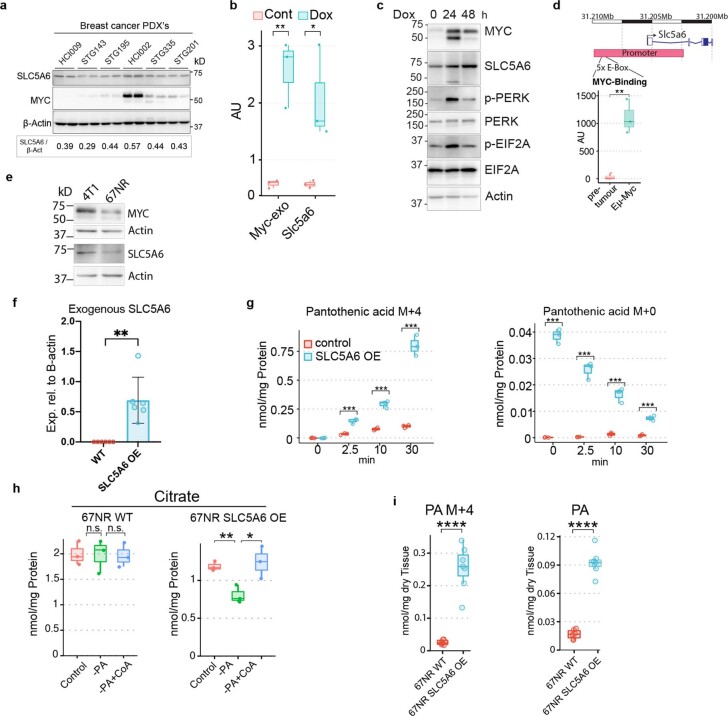
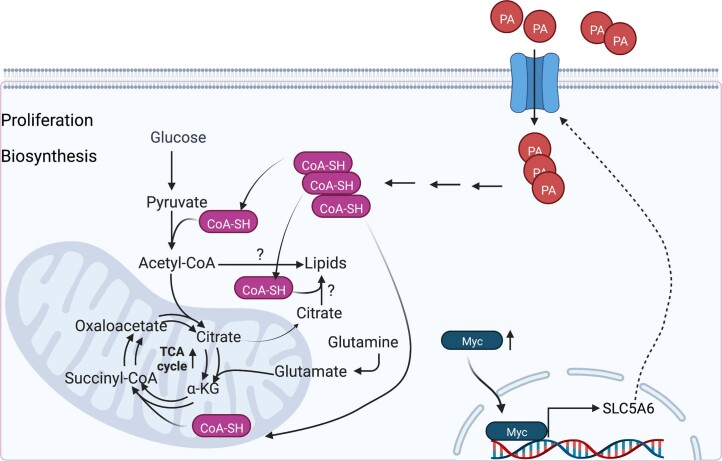
Tumors are intrinsically heterogeneous and it is well established that this directs their evolution, hinders their classification and frustrates therapy1-3. Consequently, spatially resolved omics-level analyses are gaining traction4-9. Despite considerable therapeutic interest, tumor metabolism has been lagging behind this development and there is a paucity of data regarding its spatial organization. To address this shortcoming, we set out to study the local metabolic effects of the oncogene c-MYC, a pleiotropic transcription factor that accumulates with tumor progression and influences metabolism10,11. Through correlative mass spectrometry imaging, we show that pantothenic acid (vitamin B5) associates with MYC-high areas within both human and murine mammary tumors, where its conversion to coenzyme A fuels Krebs cycle activity. Mechanistically, we show that this is accomplished by MYC-mediated upregulation of its multivitamin transporter SLC5A6. Notably, we show that SLC5A6 over-expression alone can induce increased cell growth and a shift toward biosynthesis, whereas conversely, dietary restriction of pantothenic acid leads to a reversal of many MYC-mediated metabolic changes and results in hampered tumor growth. Our work thus establishes the availability of vitamins and cofactors as a potential bottleneck in tumor progression, which can be exploited therapeutically. Overall, we show that a spatial understanding of local metabolism facilitates the identification of clinically relevant, tractable metabolic targets.


Conflict of interest statement

The authors declare no competing interests.

Figures

Fig. 1
Fig. 1. In situ segmentation of multiclonal mammary tumors.
a, Polar and apolar fractions of WMhigh, WMlow and WMmix tumors were analyzed with LC–MS (10 mg dry tissue from each sample was taken for the extraction) and plotted on a radial plot using the R package volcano3D. The radial angle ρ represents relative affiliation of metabolites to the individual samples and the distance from center the relative amounts. Colors indicate statistically significant affiliation to one or two samples. Significance was calculated with an unpaired two-tailed t-test (WMhigh, n = 4; WMlow, n = 4; WMmix, n = 8 tumors from independent animals). b, Metabolic pathways analysis of the data in a showing several significantly changed pathways and numbers of identified members against the pathway size. c, Schematic of tissue processing and DEFFI imaging. d,e, Levels and distribution of two selected ions as measured by DEFFI (d) or LC–MS (e) show concordance between the methodologies. Significance was calculated with an unpaired two-tailed t-test (WMhigh, n = 4; WMlow, n = 4; WMmix, n = 8 tumors from independent animals (WMhigh versus WMlow, P = 0.00234; WMhigh versus WMmix, P = 0.0089 (left); WMhigh versus WMlow, P = 0.0047; WMhigh versus WMmix, P = 0.0154 (right)). f, Post-DEFFI fluorescent microscopy of WMhigh, WMlow and WMmix tumors show clonal distribution (top). Ion colocalization analysis of DEFFI acquired images of WMhigh, WMlow and WMmix tumors reveal a WMhigh module (green) and a WMlow module (red) (bottom). g, Circos plot representing all metabolites found in the WMhigh module. Nodes represent the metabolites in the module. Node size is proportional to module membership, which represents a given metabolite’s strength of the colocalization index and is calculated as Pearson’s correlation between the spatial intensities of the corresponding metabolite and the module’s eigenmetabolites. Arc lines connect node pairs corresponding to colocalized metabolites with Pearson’s correlation >0.7. The nodes are color-grouped according to metabolite class based on Human Metabolome Database putative annotations (|m/z error| < 10 ppm). All box-and-whisker plots represent the following: line, median; box, interquartile range (IQR); whiskers, 1.5 × IQR limited by largest/smallest non-extreme value (NEV). In all DEFFI-MSI experiments n = 3 tumors from independent animals for each WM tumor type. P values indicated by *<0.05, ** 0.001, ***<0.0001, ****<0.00001. Source data
Fig. 2
Fig. 2. Pantothenic acid correlates with MYC expression in mammary tumors.
a, Post-DEFFI fluorescent microscopy of WMhigh, WMlow and WMmix tumors shows clonal distribution (note, this is the same image as Fig. 1f, repeated for illustrative purposes) (top). Single-ion DEFFI image of PA (n = 3 for each tumor type) (bottom). b, LC–MS analysis of WM tumors (10 mg dry tissue from each sample was taken for the extraction) shows significant increase of PA in WMhigh tumors (WMhigh versus WMlow, P = 0.00038; WMhigh versus WMmix, P = 0.0019). c, LC–MS analysis of free CoA-SH in WM tumors shows an increase in WMhigh tumors (WMhigh, n = 4; WMlow, n = 4; WMmix, n = 8 tumors from independent animals; WMhigh versus WMlow, P = 0.0313; WMhigh versus WMmix, P = 7.68 × 10−5) (b,c). d, Correlative DEFFI and IHC staining showing the distribution of PA in relation to MYC staining in human PDXs (n = 2 biological replicates for each PDX). e, Correlative DEFFI and IHC staining showing the distribution of PA in relation to MYC staining in representative human core biopsy, showing association of MYC with PA (n = 12 core biopsies). f, Workflow for correlative fluorescence microscopy, EM and NanoSIMS analysis. g, Correlative fluorescence microscopy, EM and NanoSIMS analysis shows 15N derived from 15N-PA infusions predominantly localizing in MYC-high cells, with subcellular localization in mitochondria and nucleoli. h, Cell-wise quantification of 15N/14N ratios in the WMhigh, WMlow areas shows increased amounts of PA-derived labeled 15N in WMhigh cells. For NanoSIMS 34 WMhigh and 32 WMlow individual cells were analyzed from one NanoSIMS run (P = 2.91 × 10−9). All box-and-whisker plots represent the following: line, median; box, IQR; whiskers, 1.5 × IQR limited by largest/smallest NEV. Significance was calculated with an unpaired two-tailed t-test. P values are represented by *<0.05, ** 0.001, ***<0.0001, ****<0.00001. Source data
Fig. 3
Fig. 3. Pantothenic acid correlates with areas of high MYC and anticorrelates with lactagenic metabolism.
a,b, DEFFI analysis of label incorporation into selected metabolites of WM tumors post infusion with [13C5]glutamine (a) or [13C6]glucose stripped for the natural abundance (b). c,d, Schematic of possible routes of 13C label incorporation after [13C6]glucose (c), or [13C5]glutamine (d) infusion (top). Post-DEFFI fluorescent microscopy of WMmix tumors (bottom). Binarized representation of the labeled proxy compounds (lactate M+3 isotopologue for lactagenic metabolism and malate M+1 isotopologue for increased Krebs cycle) showing Krebs cycle activity corresponds with higher PA and WMhigh areas (bottom). e,f, Dendrogram clustering between indicated proxy compounds and PA in [13C6]glucose (e) or [13C5]glutamine (f) infused tumors show a correlation for Krebs cycle proxies and no correlation with lactate. gi, Binarized images for glutamate M+5 isotopologue and lactate M+3 isotopologue (g) in six human PDXs shows less labeled lactate in areas of increased PA (h), with a positive correlation of PA with the former and no correlation with the latter (i). Binarized images were generated as above (two biological replicates from six PDXs were imaged). j, Correlative fluorescence microscopy, EM and NanoSIMS analysis after injection of BrDu, [13C6]glucose and [amide-15N]glutamine. More label is detected in WMhigh compared to WMlow. k,l, Cell-wise quantification of 13C/12C and 15N/14N ratios in WMmix tumors. The data represent one biological replicate, two further are displayed in Extended Data Fig. 4i,j (P = 5.24 × 10−17 (k); P = 3.25 × 10−5 (l)). All box-and-whisker plots represent the following: line, median; box, IQR; whiskers, 1.5 × IQR limited by largest/smallest NEV. Significance was calculated with an unpaired two-tailed t-test. P values are represented by *<0.05, ** 0.001, ***<0.0001, ****<0.00001. Note that fluorescence images from WMmix are depicted in both a and c, and b and d for better readability. Source data
Fig. 4
Fig. 4. Tumors are dependent on pantothenic acid, whose import is regulated by MYC through SLC5A6 expression.
a, IncuCyte analysis of cell growth of the high MYC 4T1 cells with and without PA (n = 3 technical replicates, error bars, mean ± s.e.m.; representative image of two biological replicates is shown, Holm–Sidak method P = 0.001248). b, Schematic of the experimental setup for diet alteration. c, LC–MS quantification of PA in extracts from HCI002 tumors grown with and without PA (P = 4.3 × 10−10). AU, arbitrary units. d, Growth of orthotopically transplanted HCI002 tumors grown with and without PA (c,d, control, n = 7; PA-free, n = 8 tumors from independent animals, mean ± s.d., P = 0.0284). e, Cell proliferation in tumors grown with and without PA quantified as BrdU-positive cells over total cells (control/PA-free, n = 4 tumors from independent animals, one section per tumor, P = 0.014). f,g, LC–MS analysis of HCI002 tumors grown with or without PA receiving a bolus of [13C6]glucose. CoA and acetyl-CoA (f) and labeled acetyl-CoA (g) (control, n = 7; PA-free, n = 8 tumors from independent animals; CoA, P = 0.00130; Ac-CoA, P = 0.0057; Ac-CoA M+0, P = 0.054; Ac-CoA M+1, P = 0.00080; Ac-CoA M+2, P = 0.0013). h, Total levels of selected metabolites from LC–MS analysis of HCI002 tumors grown with and without PA. i, Levels and fractional enrichment of 13C-labeled selected metabolites from LC–MS analysis of HCI002 tumors grown with and without PA receiving a bolus of [13C6]glucose. j, Western blot analysis of HCI002 tumors grown with and without PA. k, qRT–PCR of WMhigh and WMlow tumors (WMhigh, n = 6; WMlow, n = 5; WMmix, n = 6 tumors from independent animals, significant P values are 2.90 × 10−11, 0.013, 0.043, 0.010, 0.0005 and 0.006). l Western blot analysis of WM tumors. m, Stratification of tumors from the METABRIC dataset. n, IncuCyte growth analysis of the low MYC 67NR cells with ectopic expression of SLC5A6 with and without PA (n = 3 technical replicates; error bars, mean ± s.e.m.; representative image of three biological replicates is shown). o, Tumor growth of orthotopically transplanted 67NR cells with and without SLC5A6 over-expression (67NR control, n = 7; 67NR SLC5A6 OE C1/2, n = 6 tumors from independent animals; error bars, mean ± s.d.). Significance was calculated with an unpaired two-tailed t-test. All box-and-whisker plots represent the following: line, median; box, IQR; whiskers, 1.5 × IQR limited by largest/smallest NEV. P values indicated by *<0.05, ** 0.001, ***<0.0001, ****<0.00001. Source data
Extended Data Fig. 1
Extended Data Fig. 1. WM tumors were analyzed with LC–MS analysis and spatial metabolomics by DEFFI.
a, Overview of the transgenic background of the three WM tumors subtypes. b, Lipid classes from the apolar fraction of WMHigh, WMLow and WMMix tumors analyzed with LC–MS were selected based on their association with WMHigh and plotted on a radial plot using the R package volcano3D. The radial angle ρ represents relative affiliation of metabolites to the individual samples and the distance from center - the relative amounts. Colors indicate statistically significant affiliation to one or two samples (PG: phosphatidylglycerol, PS: phosphatidylserine, PE: phosphatidylethanolamine, PC: phosphatidylcholine, CL: cardiolipin). Significance was calculated with an unpaired two-tailed t-test (WMHigh, n = 4; WMLow, n = 4; WMMix, n = 8 tumors from independent animals). c, Selected metabolites from the LC–MS analysis of the polar fractions of WMHigh, WMLow and WMMix were plotted, showing increased levels of amino acids in WMHigh tumors. 10 mg of dry tissue from each sample were taken for the extraction. Significance was calculated with an unpaired two-tailed t-test (WMHigh, n = 4; WMLow, n = 4; WMMix, n = 8. Histidine: WMHigh vs WMMix, P = 0.02084; Lysine: WMHigh vs WMLow, P = 0.0135; WMHigh vs WMMix, P = 0.0448; Methionine: WMHigh vs WMLow, P = 0.0044; Serine: WMHigh vs WMLow, P = 0.0445; WMHigh vs WMMix, P = 0.0095). d, Dot-plots represent the proportion of pixels in the WMLow and WMHigh tumors respectively with intensities higher than the median in the module eigenmetabolite. The graphs show that the Brown module is more prevalent in the WMLow tumors, while the Turquoise module correlates with the WMHigh tumors. Data represents tree independent biological replicates (error bars: confidence interval). e, Post DEFFI fluorescent microscopy of WMHigh, WMLow and WMMix tumors is shown and ion colocalization analysis of DEFFI acquired images of WMHigh, WMLow and WMMix tumors reveals a WMHigh module (green) and a WMLow module (red). These are the two additional runs to the ones shown in Fig. 1f. P value: *<0.05, ** 0.001, ***<0.0001, ****<0.00001. See also Fig. 1.
Extended Data Fig. 2
Extended Data Fig. 2. PA correlates with MYC expression in mammary tumors.
a, Conditional probabilities of pixels with low, medium and high amounts of the metabolites specified were calculated for WMlow and WMHigh tumors, showing a very high association of high levels of PA with WMHigh tumors. b, MS/MS spectra for confirmation of PA using in situ tandem MS fragmentation of the PA precursor ion both from a standard applied to the slide prior to imaging and from primary tumor tissue (HCI002). Identical mass peaks as well as very similar relative peak intensities confirm the primary peak as PA. c, Chemical structure of CoA highlighting the part constituted by pantothenic acid. d, GC–MS analysis for PA content in human PDXs (n = 5 tumors from independent animals for each PDX). e, MYC expression and MYC pathway activation of analyzed PDXs were plotted and show good general concordance between MYC expression and pathway activation. f, Correlative DEFFI and IHC staining showing the distribution of PA in relation to MYC staining in human PDXs (n = 2 biological replicates for each PDX). g, Proportion of pixels with higher than median levels of PA in MYC high and MYC low areas measured by DEFFI on PDX samples. Data was extracted by automated segmentation on immunostaining for MYC and the masks were projected onto the measurements acquired in DEFFI. Areas of overt necrosis and any staining and processing artefacts were excluded from the quantification (Supplementary Figs. 1 and 2). The average difference of the proportion of high levels of PA in areas high or low for MYC respectively was found significantly different from zero by a linear mixed effect model fitted with the ‘glmmTMB‘ package for R (random intercepts were considered for run and tissue ID). The algorithm was applied for all data from two independent biological repeats of 4 independent PDXs. Solid black dot represents the average of all runs. Error bar represents the confidence interval. h, Pairwise P values of an unpaired two-sided Student’s t-test performed on the GC–MS analysis of PA in PDX samples as plotted in Extended Data Fig. 2e shows higher similarity between samples with the same MYC activation status. i, Correlative DEFFI and IHC staining showing the distribution of PA in relation to MYC staining in human core biopsies, showing association of MYC with PA (n = 12 core biopsies). j, Proportion of pixels with higher than median levels of PA in MYC high and Myc low areas measured by DEFFI on human core biopsies. Data was extracted by automated segmentation on immunostaining for MYC and these masks were projected onto the measurements acquired in DEFFI. Areas of overt necrosis and any staining and processing artefacts were excluded from the quantification (Supplementary Fig. 3). The analysis was performed as described in (g). The algorithm was applied on 4 independent human core biopsies. Solid black dot represents the average of all samples. Error bar represents the confidence interval. k, Guided by the EM, tumors were divided into subcellular compartments. The ROI was applied to NanoSIMS measurements and shows 15N derived from 15N-PA infusions predominantly localizes to the mitochondria (cytosol vs. mitochondria, p = 0.0005). Within the nuclear compartment, the nucleolus shows more label incorporation (nucleus vs nucleolus, p = 0.0124). Data represents one technical repeat of one sample. l, Quantification of 15N/14N ratios in randomly selected WMHigh, WMLow areas shows increased amounts of 15N-PA-derived 15N in WMHigh areas. This is a biological replicate confirming the results in Fig. 2g, h. Significance within this technical repeat was calculated with an unpaired two-tailed t-test (P = 6.066e−7). All box and whisker plots represent the following: Line: median, box: IQR, whiskers: 1.5x IQR limited by largest/smallest NEV. P value: *<0.05, ** 0.001, ***<0.0001, ****<0.00001. See also Fig. 2 and Appendix Figs. 1, 2, and 3. Source data
Extended Data Fig. 3
Extended Data Fig. 3. Activation of MYC leads to changes in carbon utilization.
GC–MS analysis of WM tumors infused with [13C5]glutamine (a) or [13C6]glucose (b) shows an increase in glutaminolysis in WMHigh and a trend towards more lactagenic metabolism in WMLow tumors. Significance was calculated with an unpaired two-tailed t-test ([13C5]glutamine infusion WMHigh, n = 3; WMLow, n = 3; WMMix, n = 4; [13C6]glucose infusions: WMHigh, n = 4 WMLow, n = 4, WMMix, n = 4 tumors from independent animals). All box and whisker plots represent the following: Line: median, box: IQR, whiskers: 1.5x IQR limited by largest/smallest NEV. P value: *<0.05, **< 0.001. See also Fig. 3. Source data
Extended Data Fig. 4
Extended Data Fig. 4. PA correlates with areas of high MYC and anticorrelates with lactagenic metabolism.
a-c, Labeled compounds utilized in DEFFI or NanoSIMS imaging as indicated. d, Aligned post DEFFI fluorescent microscopy and glutamate M + 5 isotopologues measured by DEFFI after [13C5]glutamine infusion in two repeat runs (Run 1 is displayed in Fig. 3a). e,f, Post DEFFI fluorescent microscopy of WMMix tumors, shows increased PA in WMHigh regions. The bottom panels are binarised representations of the labeled proxy compounds (lactate M + 3 isotopologue for lactagenic metabolism, malate M + 1 isotopologue for increased Krebs cycle, glutamate M + 5 for glutamine uptake) showing Krebs cycle activity corresponds with higher PA and WMHigh areas. Ion intensities were corrected for natural abundance from individual metabolites and for each pixel the metabolite with the higher value after maximal intensity normalization was depicted. Note that for illustrative purposes some panels are also displayed in Fig. 3c,d. g,h, Table showing the pairwise correlation between different detected labeled compounds and PA. The top value represents the correlation and the bottom value the p value (n = 3 tumors from independent animals). i, j, Cell-wise quantification of 13C/12C and 15N/14N ratios in WMMix tumors (run 2 and run 3 each representing a tumor from an independent biological replicate, run 2: 13C/12C, p = 3.53e−5; 15N/14N, P = 0.141; run 3: 13C/12C, P = 3e−8; 15N/14N, P = 1.14e−10) k,l, Cell-wise quantification of 13C/12C and 15N/14N ratios in WMMix tumors stratified by BrDu incorporation status (n = 3 tumors from independent animals, ((k) run 1: Brdu, P = 1.2e−11; BRDU+, P = 0.0312; run 2, P = 0.23; run 3, P = 5.94e−9; (l): run 1, P = 0.0001; run 2, P = 0.0004; run 3, P = 5.33e−7). All box and whisker plots represent the following: Line: median, box: IQR, whiskers: 1.5x IQR limited by largest/smallest NEV. Significance was calculated with an unpaired two-tailed t-test. P value: ****<0.00001. See also Fig. 3.
Extended Data Fig. 5
Extended Data Fig. 5. PA deprivation slows down mammary tumor growth in PDXs and WM tumors.
a, Selected metabolites from GCMS analysis of 4T1 cells with and without PA as well as CoA rescue. b, Western blot analysis of 4T1 cells with and without PA and with increasing amounts of CoA as a rescue (representative image of 3 biological repeats). c, Mouse weight during PA deprivation in the PDX-cohort (control diet, n = 7; PA-free diet, n = 8; error bar represents s.d.) d, Growth of WMMix tumors from mice fed a PA-free or control diet (n = 5 tumors from independent animals; error bar represent s.d., P = 0.02401). e Proliferation of WMMix tumors with and without PA quantified as BrDU-positive cells over total cells (n = 4 tumors from independent biological replicates, one section per tumor; WMlow, P = 0.0304; WMhigh, P = 0.0126). f, Densitometric analysis of cleaved caspase 3 presence, normalised to actin in HCI002 tumors from mice fed PA-free or control diet (n = 5 tumor protein extracts from independent biological replicates, P = 0.00171). g-h, LC–MS analysis of WMMix tumors receiving a bolus of [13C6]glucose shows no significantly reduced amounts of free CoA-SH, Acetyl-CoA and labeled Acetyl-CoA isotopologues upon PA deprivation (n = 5 tumors from independent animals). i, Selected metabolites of LC–MS analysis of HCI002 tumors show widespread reduction in polar metabolite levels in tumors grown on PA-free diet. j, LC–MS analysis of HCI002 tumors receiving a bolus of [13C6]glucose shows widespread reduction in label incorporation in selected metabolites upon PA deprivation, but little difference in the fractional enrichment. k, LC–MS analysis of WMMix tumors shows widespread reduction in polar metabolite levels in tumors grown on PA-free diet. l, LC–MS analysis of WMMix tumors receiving a bolus of [13C6]glucose shows widespread reduction in label incorporation in selected metabolites upon PA deprivation, but little difference in the fractional enrichment. m, LC–MS analysis of the apolar fraction of HCI002 PDX tumors (n = 7 control, n = 8 PA-free) shows accumulation of triglycerides (TG), following PA deprivation (significance was calculated with a unpaired two-sided non-adjusted Student’s t-test). n, LC–MS analysis of the apolar fraction of WMMix tumors (n = 5 tumors from independent animals) shows accumulation of diglycerides (DG) and triglycerides (TG), following PA deprivation (significance was calculated with a unpaired two-sided non-adjusted Student’s t-test). All box and whisker plots represent the following: Line: median, box: IQR, whiskers: 1.5 x IQR limited by largest/smallest NEV. Significance was calculated with an unpaired two-tailed t-test. P value: *<0.05, ** 0.001. See also Fig. 4. Source data
Extended Data Fig. 6
Extended Data Fig. 6. MYC upregulates SLC5A6 to increase PA uptake.
a, Western blot analysis for MYC and SLC56A6 in human PDXs. b, qRT-PCR analysis of 67NR cells with Doxycycline-inducible MYC shows transcriptional upregulation of Slc5A6 upon MYC induction (n = 3 extracted RNA samples from independent biological replicates, error bar represents s.d., P = 0.0013). c, Western blot analysis of 67NR cells with Doxycycline-inducible MYC shows an upregulation of SLC5A6 upon MYC induction (representative image of 3 biological repeats). d, Publicly available Myc Chip-Seq data of pre-tumoral lymphocytes as well as overt lymphoma in an Eμ-Myc-driven model show invasion of an E-box cluster localized in the Slc5A6 promoter. The data represents three biological replicates (error bar represents s.d., P = 0.0042). e, Western blot analysis of 4T1 and 67NR cells shows more MYC and SLC5A6 in 4T1 cells compared to 67NR cells. f, qPCR analysis of recombinant SLC5A6 expression (n = 5, error bar represents s.d.). g, GC–MS analysis of 67NR control and 67NR SLC5A6 over-expressing cells treated with stable-isotope labeled PA, shows an increased uptake of the labeled PA, and a higher baseline level of unlabeled PA in SLC5A6 over-expressing cells (n = 3 extracts from independent biological replicates, error bar represents s.d., PA M + 4, P = 1.5e−5, 0.0003, 4.30e−6; PA, P = 0.00032, 1.5e−5, 0.00038, 4.3e−6). h, GC–MS analysis of 67NR control and SLC5A6 over-expressing cells either starved for PA or rescued with CoA, shows no significant difference in the control cells between any of the treatments, while the SLC5A6 cells show a significant drop in citrate after PA deprivation that is readily rescued with CoA, implying metabolic reprogramming through SLC5A6 over-expression (n = 3 extracts from independent biological replicates, error bar represents s.d., control vs -PA, P = 0.0083; -PA vs -PA+CoA, P = 0.037). i, GC–MS analysis of stable-isotope labeled (M + 4) and endogenous PA in tumors grown from 67NR control cells or 67NR SLC5A6 over-expressing cells show an increased uptake of both endogenous and exogenous labeled PA (n = 6 control, n = 7 SLC5A6 OE extracts from tumors from independent biological replicates, error bar represents s.d., P = 0.0049, P = 0.0033). All box and whisker plots represent the following: Line: median, box: IQR, whiskers: 1.5x IQR limited by largest/smallest NEV. Significance was calculated with an unpaired two-tailed t-test. P value: *<0.05, ** 0.001. See also Fig. 4. Source data
Extended Data Fig. 7
Extended Data Fig. 7. Model.
MYC is upregulated in higher grade tumor areas. It can bind to the SLC5A6 promoter and increase its transcription. This in turn increases PA intake, and enhances CoA synthesis, which facilitates a biosynthetic metabolism by enhancing Krebs Cycle activity, while shunting metabolites away from lactagenic metabolism. Whether fatty acid biosynthesis is also enhanced is not subject of this study, but consistent with our model (image created with BioRender.com).

References

    1. Tammela, T. et al. A Wnt-producing niche drives proliferative potential and progression in lung adenocarcinoma. Nature10.1038/nature22334 (2017). - PMC - PubMed
    1. McGranahan, N. & Swanton, C. Clonal heterogeneity and tumor evolution: Past, present, and the future. Cell168, 613–628 (2017). - PubMed
    1. Watkins, T. B. K. et al. Pervasive chromosomal instability and karyotype order in tumour evolution. Nature587, 126–132 (2020). - PMC - PubMed
    1. Jackson, H. W. et al. The single-cell pathology landscape of breast cancer. Nature578, 615–620 (2020). - PubMed
    1. Takei, Y. et al. Integrated spatial genomics reveals global architecture of single nuclei. Nature590, 344–350 (2021). - PMC - PubMed