. 2023 Nov 9;22(1):99.
doi: 10.1186/s12941-023-00646-3.

The oral bacterial microbiota facilitates the stratification for ulcerative colitis patients with oral ulcers

Affiliations

The oral bacterial microbiota facilitates the stratification for ulcerative colitis patients with oral ulcers

Jun Xu et al. Ann Clin Microbiol Antimicrob. .

Abstract

Background: Clinically, a large part of inflammatory bowel disease (IBD) patients is complicated by oral lesions. Although previous studies proved oral microbial dysbiosis in IBD patients, the bacterial community in the gastrointestinal (GI) tract of those IBD patients combined with oral ulcers has not been profiled yet.

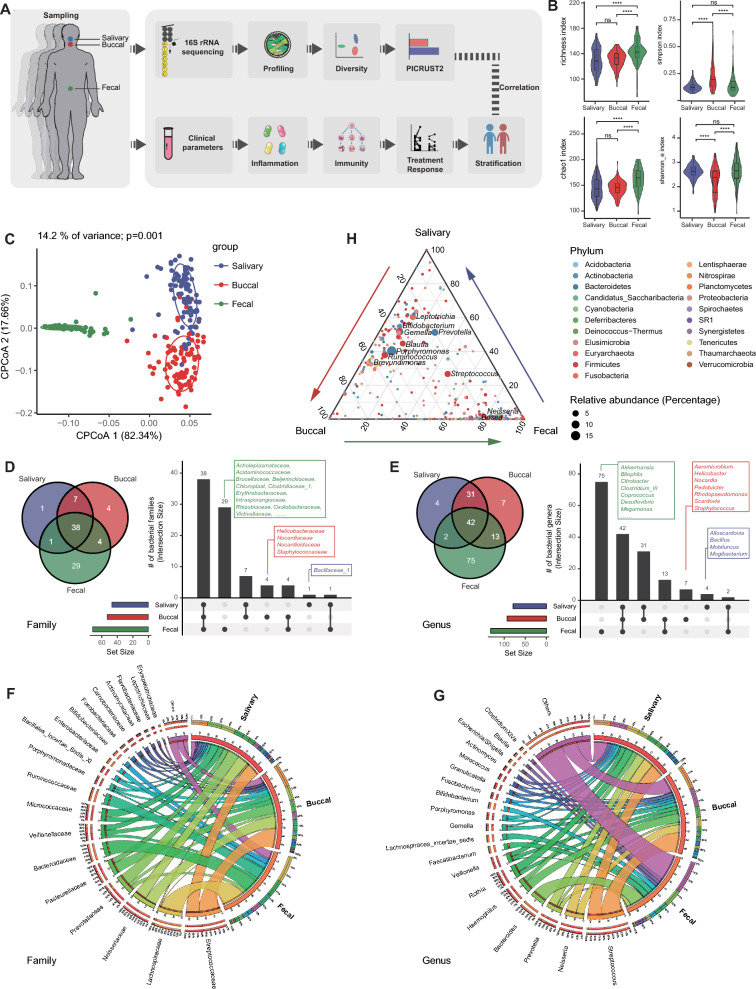
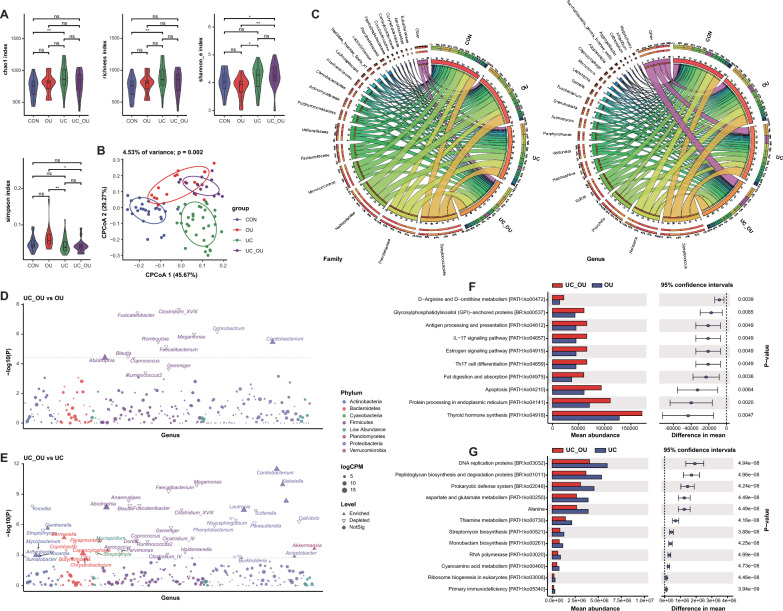
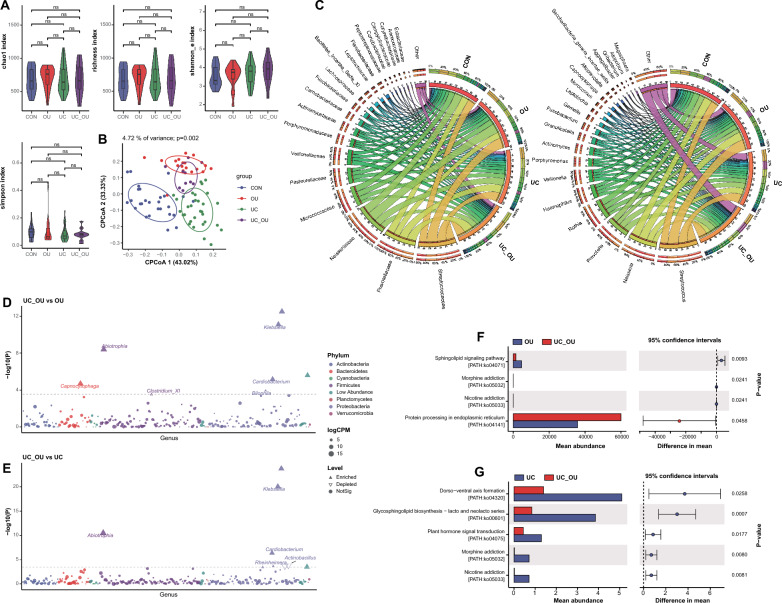
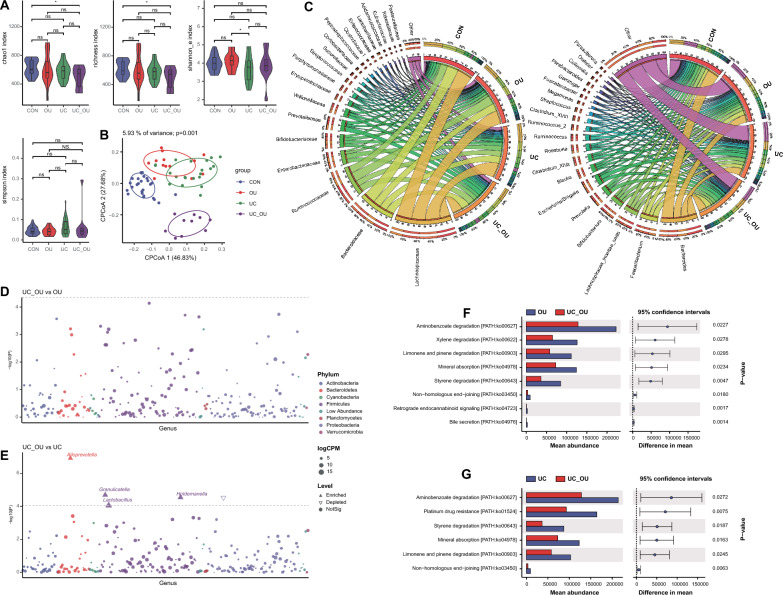
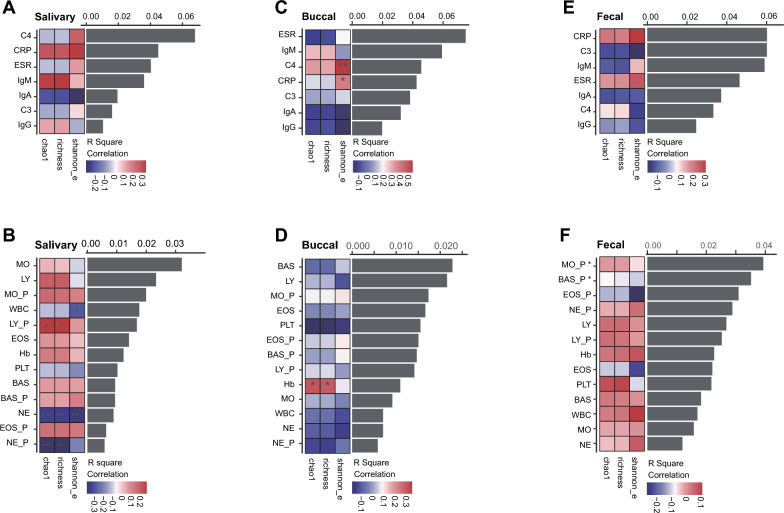
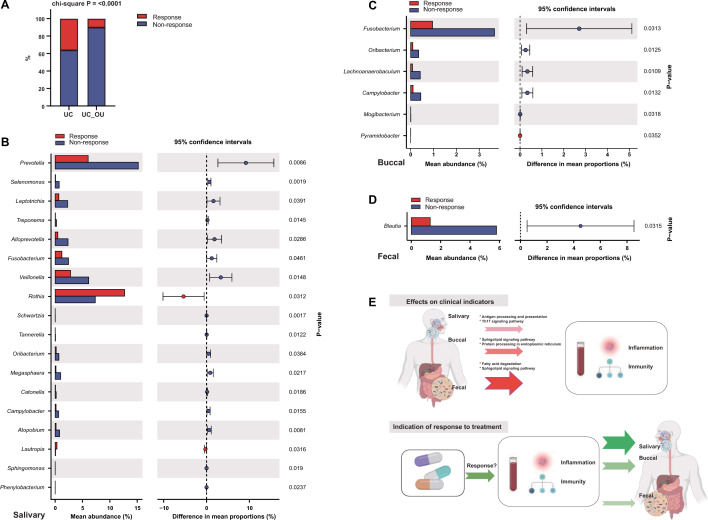
Methods: In this study, we enrolled four groups of subjects, including healthy controls (CON), oral ulcer patients (OU), and ulcerative colitis patients with (UC_OU) and without (UC) oral ulcers. Bio-samples from three GI niches containing salivary, buccal, and fecal samples, were collected for 16S rRNA V3-V4 region sequencing. Bacterial abundance and related bio-functions were compared, and data showed that the fecal microbiota was more potent than salivary and buccal microbes in shaping the host immune system. ~ 22 UC and 10 UC_OU 5-aminosalicylate (5-ASA) routine treated patients were followed-up for six months; according to their treatment response (a decrease in the endoscopic Mayo score), they were further sub-grouped as responding and non-responding patients.

Results: We found those UC patients complicated with oral ulcers presented weaker treatment response, and three oral bacterial genera, i.e., Fusobacterium, Oribacterium, and Campylobacter, might be connected with treatment responding. Additionally, the salivary microbiome could be an indicator of treatment responding in 5-ASA routine treatment rather than buccal or fecal ones.

Conclusions: The fecal microbiota had a strong effect on the host's immune indices, while the oral bacterial microbiota could help stratification for ulcerative colitis patients with oral ulcers. Additionally, the oral microbiota had the potential role in reflecting the treatment response of UC patients. Three oral bacteria genera (Fusobacterium, Oribacterium, and Campylobacter) might be involved in UC patients with oral ulcers lacking treatment responses, and monitoring oral microbiota may be meaningful in assessing the therapeutic response in UC patients.

Keywords: Bacterial microbiota; Oral ulcer; Response; Stratification; Ulcerative colitis.


Conflict of interest statement

The authors declare that they have no competing interests.

Figures

Fig. 1
Fig. 1
Bacterial profiles at different gastrointestinal tract niches. A Study design. Three types of samples from differed GI niches were collected in this study, including salivary, buccal, and fecal samples. B Alpha diversity indices of the microbiota, including the richness, Simpson’s, Shannon’s, and Chao1 indices. Horizontal bars within boxes represent medians. The tops and bottoms of the boxes represent the 75th and 25th percentiles, respectively. The upper and lower whiskers cover 1.5 × the interquartile range from the upper and lower edges of the box, respectively. P-values were obtained using the one-way ANOVA test (comparisons among four groups). C The constrained principal coordinate analysis based on the Bray–Curtis distance. The R software (v 4.0.1) with the vegan (v 2.5–7) package were used and P-values were obtained using permutational multivariate analysis of variance (PERMANOVA). D and E The upset plot shows the bacterial family (D) and genus (E) count in each GI niche. F and G Relative abundance of the top 20 bacterial families (F) and genera (G). Visualization was performed using Circos (http://circos.ca/). The right circle in the outer part shows the groups and relative proportions of bacterial species. The left outer ring and inner bands indicate the relative proportions (%) of bacterial genera in the different groups. The left inner circle represents the relative abundances of all bacteria. H The ternary plot shows the distribution of the specific bacterial genus in each GI niche. The point color represents the phylum classification of the bacterial genus. The point size presents the mean percentage of a specific genus
Fig. 2
Fig. 2
The bacterial profile in salivary samples of UC patients with or without oral ulcers. A Alpha diversity indices of the microbiota, including the richness, Simpson’s, Shannon’s, and Chao1 indices. Horizontal bars within boxes represent medians. The tops and bottoms of the boxes represent the 75th and 25th percentiles, respectively. The upper and lower whiskers cover 1.5 × the interquartile range from the upper and lower edges of the box, respectively. P-values were obtained using the one-way ANOVA test (comparisons among four groups). B The constrained principal coordinate analysis based on the Bray–Curtis distance. The R software (v 4.0.1) with the vegan (v 2.5–7) package were used, and P-values were obtained using permutational multivariate analysis of variance (PERMANOVA). C Relative abundance of the top 20 bacterial families (the left panel) and genera (the right panel). Visualization was performed using Circos (http://circos.ca/). The right circle in the outer part shows the groups and relative proportions of bacterial species. The left outer circle and inner bands show the relative proportions (%) of bacterial genera in the different groups. The left inner circle represents the relative abundances of all bacteria. D and E Comparative analysis of bacterial genus abundance between two groups (D UC_OU vs. OU; E UC_OU vs. UC). The EdgeR package was used for comparative analysis. The difference between the two groups is shown as a Manhattan diagram. Point shape indicates the genus enriched, depleted, or not significant in the former group compared with the latter. Point size indicates the counts of a specific genus. CPM, count per million. F and G Comparative analysis of bacterial function between two groups (F UC_OU vs. OU; G UC_OU vs. UC). Phylogenetic Investigation of Communities annotated the pathway information by Reconstruction of Unobserved States (PICRUSt2) software by referring to the Kyoto Encyclopedia of Genes and Genomes (KEGG) database. The STAMP software was used for data visualization. CON, healthy controls; OU, patients with only oral ulcers; UC, UC patients without oral ulcers; UC_OU, UC patients with oral ulcers; ns, not significant; *P-value < 0.05; **P-value < 0.01
Fig. 3
Fig. 3
The bacterial profile in buccal samples of UC patients with or without oral ulcers. A Alpha diversity indices of the microbiota, including the richness, Simpson’s, Shannon’s, and Chao1 indices. Horizontal bars within boxes represent medians. The tops and bottoms of the boxes represent the 75th and 25th percentiles, respectively. The upper and lower whiskers cover 1.5 × the interquartile range from the upper and lower edges of the box, respectively. P-values were obtained using the one-way ANOVA test (comparisons among four groups). B The constrained principal coordinate analysis based on the Bray–Curtis distance. The R software (v 4.0.1) with the vegan (v 2.5–7) package were used, and P-values were obtained using permutational multivariate analysis of variance (PERMANOVA). C Relative abundance of the top 20 bacterial families (the left panel) and genera (the right panel). Visualization was performed using Circos (http://circos.ca/). The right circle in the outer part shows the groups and relative proportions of bacterial species. The left outer circle and inner bands show the relative proportions (%) of bacterial genera in the different groups. The left inner circle represents the relative abundances of all bacteria. D and E, Comparative analysis of bacterial genus abundance between two groups (D UC_OU vs. OU; E UC_OU vs. UC). The EdgeR package was used for comparative analysis. The difference between the two groups is shown as a Manhattan diagram. Point shape indicates the genus enriched, depleted, or not significant in the former group compared with the latter. Point size indicates the counts of a specific genus. CPM, count per million. F and G, Comparative analysis of bacterial function between two groups (F UC_OU vs. OU; G UC_OU vs. UC). Phylogenetic Investigation of Communities annotated the pathway information by Reconstruction of Unobserved States (PICRUSt2) software by referring to the Kyoto Encyclopedia of Genes and Genomes (KEGG) database. The STAMP software was used for data visualization. CON, healthy controls; OU, patients with only oral ulcers; UC, UC patients without oral ulcers; UC_OU, UC patients with oral ulcers; ns, not significant; *P-value < 0.05; **P-value < 0.01
Fig. 4
Fig. 4
The bacterial profile in fecal samples of UC patients with or without oral ulcers. A Alpha diversity indices of the microbiota, including the richness, Simpson’s, Shannon’s, and Chao1 indices. Horizontal bars within boxes represent medians. The tops and bottoms of the boxes represent the 75th and 25th percentiles, respectively. The upper and lower whiskers cover 1.5 × the interquartile range from the upper and lower edges of the box, respectively. P-values were obtained using the one-way ANOVA test (comparisons among four groups). B The constrained principal coordinate analysis based on the Bray–Curtis distance. The R software (v 4.0.1) with the vegan (v 2.5–7) package were used, and P-values were obtained using permutational multivariate analysis of variance (PERMANOVA). C, Relative abundance of the top 20 bacterial families (the left panel) and genera (the right panel). Visualization was performed using Circos (http://circos.ca/). The right circle in the outer part shows the groups and relative proportions of bacterial species. The left outer circle and inner bands show the relative proportions (%) of bacterial genera in the different groups. The left inner circle represents the relative abundances of all bacteria. D and E, Comparative analysis of bacterial genus abundance between two groups (D UC_OU vs. OU; E UC_OU vs. UC). The EdgeR package was used for comparative analysis. The difference between the two groups is shown as a Manhattan diagram. Point shape indicates the genus enriched, depleted, or not significant in the former group compared with the latter. Point size indicates the counts of a specific genus. CPM, count per million. F and G, Comparative analysis of bacterial function between two groups [F UC_OU vs. OU; G UC_OU vs. UC]. Phylogenetic Investigation of Communities annotated the pathway information by Reconstruction of Unobserved States (PICRUSt2) software by referring to the Kyoto Encyclopedia of Genes and Genomes (KEGG) database. The STAMP software was used for data visualization. CON, healthy controls; OU, patients with only oral ulcers; UC, UC patients without oral ulcers; UC_OU, UC patients with oral ulcers; ns, not significant; *P-value < 0.05; **P-value < 0.01
Fig. 5
Fig. 5
The correlation between clinical parameters (inflammatory and immunological) and bacterial diversity (alpha and beta). A and B The correlation between inflammatory (A) or immunological (B) indices and salivary bacterial diversity. The length of the black bar shows the R square value of the indices-beta diversity correlation. The results were acquired by the redundancy analysis (RDA) using the R software (v 4.0.1) with the vegan (v 2.5–7) package. The color box shows the rho value of indices-alpha diversity correlation. The results were analyzed from Spearman’s correlation using the R software (v 4.0.1) with the vegan (v 2.5–7) package. The star symbols behind the left words show the P-values acquired from the RDA. The box’s star symbols show the adjusted P-values (false discovery rate, FDR) received from the Spearman’s correlation. (same methodology as in CF). C and D The correlation between inflammatory (C) or immunological (D) indices and buccal bacterial diversity. E and F The correlation between inflammatory (E) or immunological (F) indices and buccal bacterial diversity
Fig. 6
Fig. 6
Microbial differentiation between UC patients with and without treatment response. A The treatment response rate in UC patients with or without oral ulcers. The Chi-squared test was performed to test the response difference between the two groups. UC, UC patients without oral ulcers; UC_OU, UC patients with oral ulcers. B–D The comparative analysis of bacterial genus abundance of the samples from salivary (B), buccal (C), and fecal (D) niches. The STAMP software was used for data visualization. E The graphic summary

Similar articles

Cited by

References

    1. Ungaro R, Mehandru S, Allen PB, Peyrin-Biroulet L, Colombel JF. Ulcerative colitis. Lancet. 2017;389(10080):1756–1770. doi: 10.1016/S0140-6736(16)32126-2. - DOI - PMC - PubMed
    1. Round JL, Mazmanian SK. The gut microbiota shapes intestinal immune responses during health and disease. Nat Rev Immunol. 2009;9(5):313–323. doi: 10.1038/nri2515. - DOI - PMC - PubMed
    1. Scott A. Gut-liver axis: menace in the microbiota. Nature. 2017;551(7681):S94–S95. doi: 10.1038/d41586-017-06924-3. - DOI - PubMed
    1. Kotsiliti E. Gut microbiome and autism spectrum disorder. Nat Rev Gastroenterol Hepatol. 2022;19(1):6. doi: 10.1038/s41575-021-00564-9. - DOI - PubMed
    1. Dang AT, Marsland BJ. Microbes, metabolites, and the gut-lung axis. Mucosal Immunol. 2019;12(4):843–850. doi: 10.1038/s41385-019-0160-6. - DOI - PubMed