. 2023 Dec;10(36):e2303484.
doi: 10.1002/advs.202303484. Epub 2023 Nov 9.

Inhibition of CARM1-Mediated Methylation of ACSL4 Promotes Ferroptosis in Colorectal Cancer

Affiliations

Inhibition of CARM1-Mediated Methylation of ACSL4 Promotes Ferroptosis in Colorectal Cancer

Shengjie Feng et al. Adv Sci (Weinh). 2023 Dec.

Abstract

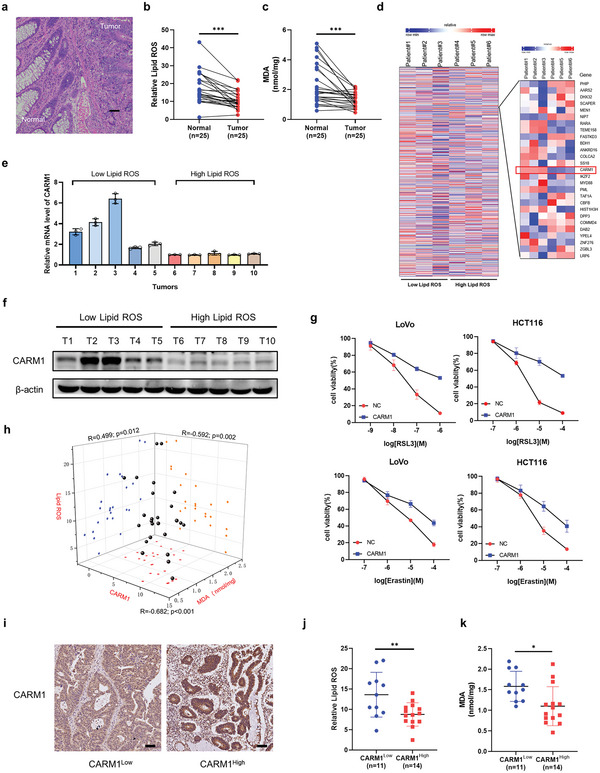
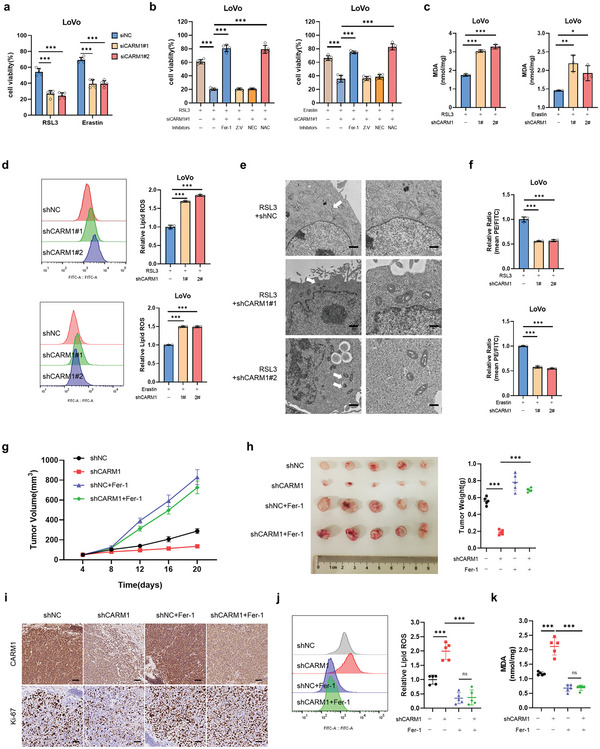
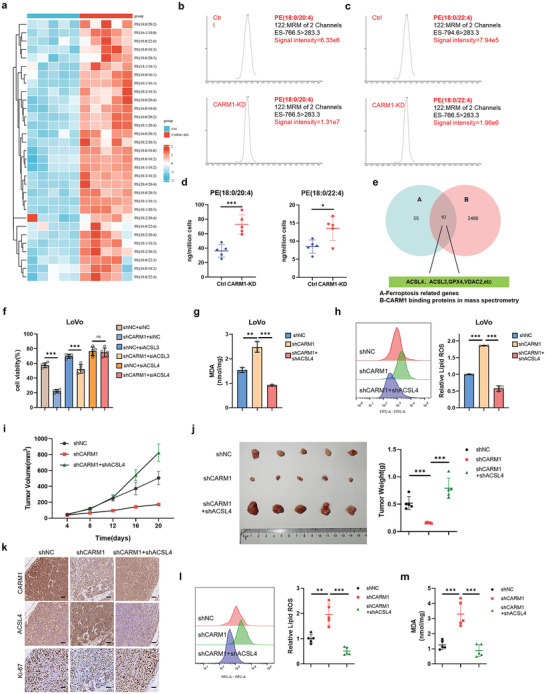
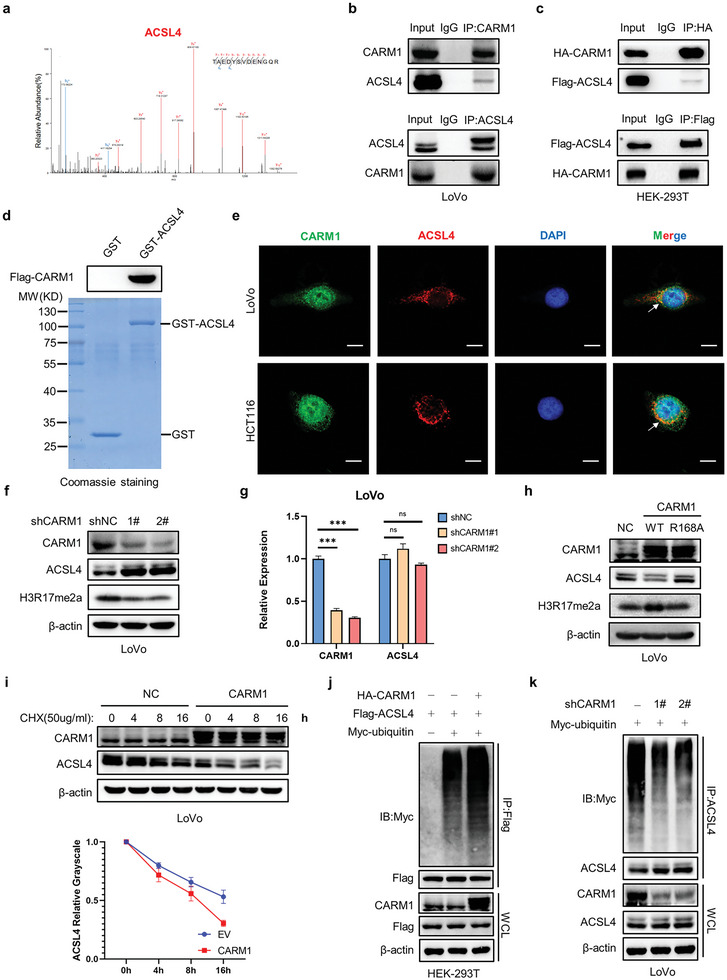
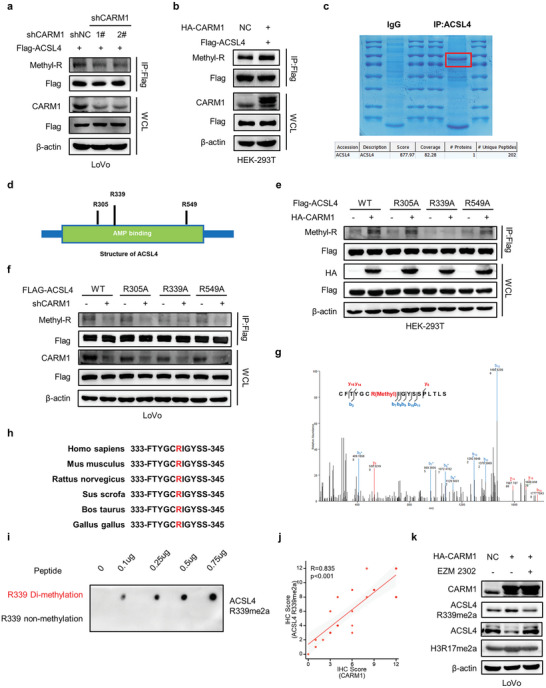
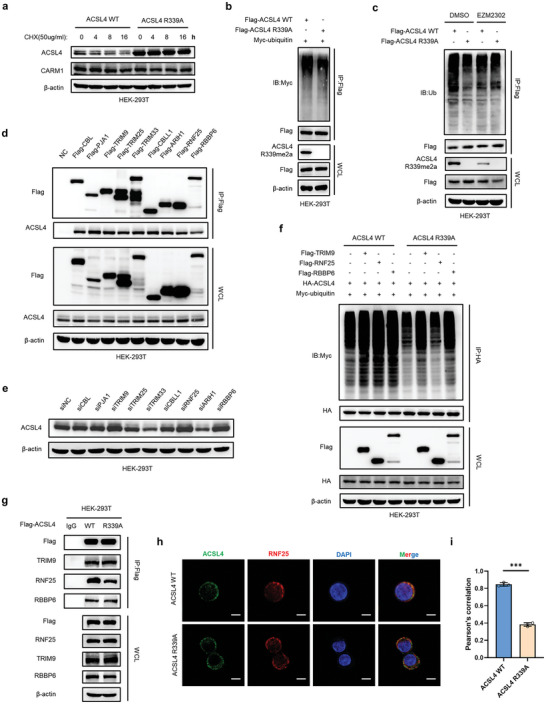
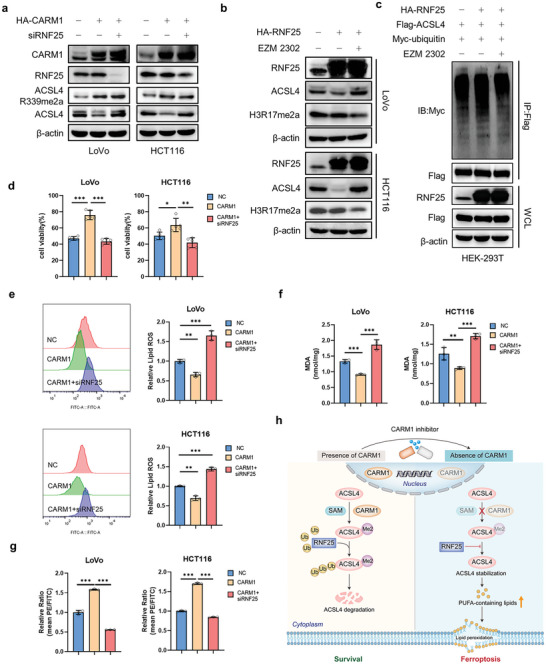
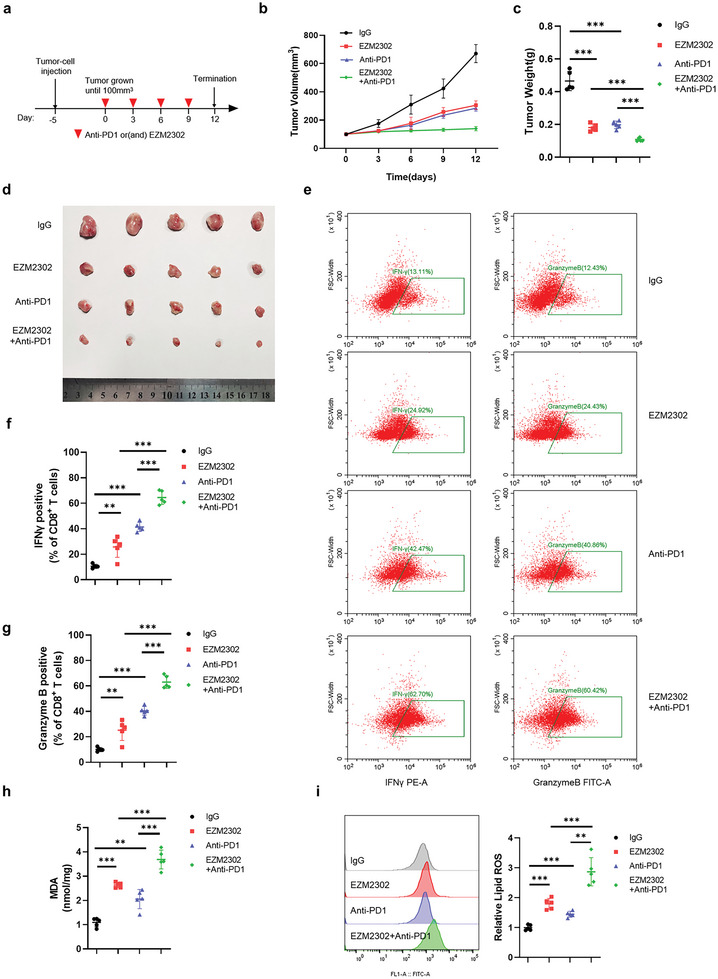
Ferroptosis, which is caused by iron-dependent accumulation of lipid peroxides, is an emerging form of regulated cell death and is considered a potential target for cancer therapy. However, the regulatory mechanisms underlying ferroptosis remain unclear. This study defines a distinctive role of ferroptosis. Inhibition of CARM1 can increase the sensitivity of tumor cells to ferroptosis inducers in vitro and in vivo. Mechanistically, it is found that ACSL4 is methylated by CARM1 at arginine 339 (R339). Furthermore, ACSL4 R339 methylation promotes RNF25 binding to ACSL4, which contributes to the ubiquitylation of ACSL4. The blockade of CARM1 facilitates ferroptosis and effectively enhances ferroptosis-associated cancer immunotherapy. Overall, this study demonstrates that CARM1 is a critical contributor to ferroptosis resistance and highlights CARM1 as a candidate therapeutic target for improving the effects of ferroptosis-based antitumor therapy.

Keywords: ACSL4 methylation; CARM1; ferroptosis.


Conflict of interest statement

The authors declare no conflict of interest.

Figures

Figure 1
Figure 1
CARM1 was negatively associated with ferroptosis. a) HE staining of clinical specimens of colon cancer. Scale bar, 20 µm. b) Twenty‐five pairs of colorectal cancer (CRC) tissues and adjacent tissues were digested into single‐cell suspensions, and lipid ROS production was assayed via flow cytometry by using C11‐BODIPY after RSL3 treatment for 4 h (n = 25). c) Malondialdehyde (MDA) levels were detected by using a lipid peroxidation MDA assay kit in single‐cell suspensions treated with RSL3 for 4 h from 25 pairs of CRC tissues and adjacent tissues (n = 25). d) Heatmap of RNA‐seq using six patient tumors with different lipid ROS levels showing changes in gene expression, including CARM1. e) Quantitative real‐time PCR (qPCR) analysis of CARM1 mRNA levels in tumors from 10 patients. f) Western blot analysis of CARM1 in the same tissues as (e). g) Cell viability was assayed in vector‐ and CARM1‐overexpressing LoVo and HCT116 cells treated with the indicated doses of RSL3 and erastin for 24 h. h) Scatter plot of the immunohistochemistry (IHC) staining score for CARM1, lipid ROS, and MDA levels in CRC tissues (n = 25). All p values and R values were calculated with Spearman's r test. i) Representative results of immunohistochemical staining for CARM1 from 25 clinical CRC patients. Scale bars, 20 µm. j,k) Lipid ROS (left) and MDA (right) levels were compared in CARM1 high (CARM1 IHC score ≥ 6) and CARM1 low (CARM1 IHC score<6) groups. The data shown represent the mean ± SD. In (b) and (c), comparisons were made by using paired Student's t‐test, and in (j) and (k), comparisons were made by using the two‐tailed, unpaired Student's t‐test; * p < 0.05, ** p < 0.01, *** p < 0.001.
Figure 2
Figure 2
CARM1‐KD enhances ferroptotic cell death. a) Cell viability was measured in siNC and siCARM1 LoVo cells treated with 2.5 × 10⁻⁶ m RSL3 or 5 × 10⁻⁶ m erastin for 12 h (n = 5 independent experiments). b) Cell viability was measured in siNC and siCARM1 LoVo cells treated with cell death inhibitors and 2. 5 × 10⁻⁶ m RSL3 or 5 × 10⁻⁶ m erastin for 12 h. Fer‐1, 1 × 10⁻⁶ m ferrostatin‐1; NAC, 5 × 10−3 m; Nec, 2 × 10⁻⁶ m necrostatin‐1; Z‐V, 20 × 10−6 m Z‐VAD‐FMK (n = 5 independent experiments). c,d) Malondialdehyde (MDA) levels and relative lipid ROS were assayed in the indicated LoVo cells treated with 2. 5 × 10⁻⁶ m RSL3 or 5 × 10⁻⁶ m erastin for 12 h (n = 3 independent experiments). e) Transmission electron microscopy (TEM) images of the indicated LoVo cells subjected to RSL3 (2. 5 × 10⁻⁶ m) for 12 h. White arrows indicate mitochondria. Scale bars, left, 2 µm; right, 500 nm. f) The indicated stable LoVo cells were used to evaluate mitochondrial membrane potential via fluorescence staining of mitochondria with JC‐1 dye (n = 3 independent experiments). g) shNC and shCARM1 LoVo cells were subcutaneously injected into the mice. RSL3 was administered to all tumors with or without Fer‐1. Tumor volumes (n = 5) were calculated every 4 days, and the growth curve was drawn. h) Images of tumors from LoVo xenograft mice with altered treatments are shown, and the tumor weights (n = 5) of the subcutaneous xenografts were measured. i) Representative immunohistochemical images of CARM1 and Ki67 in tumor sections are shown. Scale bars, 20 µm. j,k) MDA levels and relative lipid ROS in tumor cells isolated from (h) were assayed (n = 5 independent experiments). The data shown represent the mean ± SD. Comparisons were made by using one‐way ANOVA with Tukey's test; * p < 0.05, ** p < 0.01, *** p < 0.001.
Figure 3
Figure 3
The ferroptosis function of CARM1 is mediated by ACSL4. a) Heatmap of all of the major phosphatidylethanolamine (PE) species in Ctrl and CARM1‐KD LoVo cells. Each PE species was normalized to the corresponding mean value. b,c) Representative EIC images of Ctrl and CARM1‐KD LoVo cells on two major molecular species of PE (PE [18:0/20:4] and PE [18:0/22:4]), representing substrates for oxygenation during ferroptosis. d) The contents of PE (18:0/20:4) and PE (18:0/22:4) in Ctrl and CARM1‐KD LoVo cells via LC‒MS (n = 5 independent experiments). e) Screening strategy for predicting the possible substrate of CARM1 in ferroptosis. f) Cell viability was assayed in the indicated LoVo cells treated with 2. 5 × 10⁻⁶ m RSL3 for 12 h (n = 5 independent experiments). g,h) Malondialdehyde (MDA) levels and relative lipid ROS were assayed in the indicated LoVo cells treated with 2. 5 × 10⁻⁶ m RSL3 for 12 h (n = 3 independent experiments). i) The indicated stable LoVo cells were subcutaneously injected into the mice, and RSL3 was injected intratumorally (100 mg kg−1, twice per week). Tumor volumes (n = 5) were calculated every 4 days, and the growth curve was drawn. j) Images of tumors from LoVo xenograft mice with altered treatments are shown, and the tumor weights (n = 5) of the subcutaneous xenografts were measured. k) Representative immunohistochemical images of CARM1, ACSL4, and Ki67 in tumor sections are shown. Scale bars, 20 µm. l,m) MDA levels and relative lipid ROS in tumor cells isolated from (j) were assayed (n = 5 independent experiments). The data shown represent the mean ± SD. In (d), comparisons were made by using the two‐tailed, unpaired Student's t‐test; All other comparisons were made by using one‐way ANOVA with Tukey's test; * p < 0.05, ** p < 0.01, *** p < 0.001; n.s., no significant difference.
Figure 4
Figure 4
CARM1 directly interacts with and decreases ACSL4 protein levels in colon cancer cells. a) Mass spectrometry analysis identified ACSL4 in the binding protein pool of CARM1. b) Immunoprecipitation (IP) analyses were performed to examine the endogenous interaction between CARM1 and ACSL4 by using antibodies against CARM1 and ACSL4 in LoVo cells. c) IP analyses were performed to examine the exogenous interaction between CARM1 and ACSL4 by using antibodies against Flag and HA, respectively, in HEK293T cells. d) In vitro GST pull‐down assay to verify the binding of CARM1 and ACSL4. e) Immunofluorescence staining was performed to observe the colocalization of CARM1 (green) and ACSL4 (red) in LoVo and HCT116 cells. The nucleus is labeled via DAPI (blue). Scale bar, 20 µm. f) Western blot analysis of the indicated LoVo cells. Protein levels of CARM1, ACSL4, and H3R17me2a were assayed. g) Quantitative real‐time PCR (qPCR) analysis of CARM1 and ACSL4 mRNA levels in the indicated LoVo cells (n = 3 independent experiments). h) Western blot analysis of the indicated LoVo cells. Protein levels of CARM1, ACSL4, and H3R17me2a were assayed. i) Western blot analysis of vector‐ and CARM1‐overexpressing LoVo cells treated with 50 µg mL−1 cycloheximide for the indicated times. Quantitative analysis was conducted on ACSL4 levels at the indicated time points. j) IP with an anti‐Flag antibody and Western blotting with an anti‐Myc antibody were performed to detect the ubiquitination level of ACSL4. k) CARM1‐knockdown cells were transfected with the indicated plasmid and treated with MG132 (10 × 10−6 m) for 8 h. IP with an anti‐ACSL4 antibody and Western blot analysis of the ubiquitination of endogenous ACSL4 were performed. The data shown represent the mean ± SD. Comparisons were made by using one‐way ANOVA with Tukey's test; *** p < 0.001; n.s., no significant difference.
Figure 5
Figure 5
CARM1 methylates ACSL4 at R339. a,b) Co‐immunoprecipitation (Co‐IP) was performed to detect the methylation levels of ACSL4 with CARM1 attenuation (left) or upregulation (right). c) IP assay was performed for the enrichment of ACSL4 protein, staining was performed with Coomassie bright blue and verification was conducted by using mass spectrometry. d) Schematic diagram of ACSL4 structure and methylation sites. e) Co‐IP was performed to detect the methylation changes in WT ACSL4 and the R305A, R339A, and R549A mutants with CARM1 overexpression. f) Co‐IP was performed to detect the methylation changes in WT ACSL4 and the R305A, R339A, and R549A mutants with CARM1 attenuation. g) Secondary mass spectrometry result of one possible methylation residue at arginine 339. h) The ACSL4 R339 site amino acid in different species. i) Dot plot assay verifying the specificity of anti‐ACSL4 R339me2a using 0.1‐0.75 µg of different peptides. j) Correlation between CARM1 and ACSL4 R339Ame2a expression in colorectal cancer (CRC) tissues (n = 25) was determined by using the Spearman correlation coefficient test. All p and R values were calculated with Spearman's r test. k) Western blot analysis of vector‐ and CARM1‐overexpressing LoVo cells treated with DMSO or 10 × 10−9 m EZM2302 for 24 h. Protein levels of CARM1, ACSL4, ACSL4 R339me2a, and H3R17me2a were assayed.
Figure 6
Figure 6
ACSL4 R339 methylation promotes the degradation of ACSL4 by RNF25. a) Western blot analysis of ACSL4 WT and ACSL4 R339A‐overexpressing stable HEK293T cells treated with 50 µg mL−1 cycloheximide for the indicated times. b) HEK293T cells transfected with the indicated plasmids and treated with 10 × 10−6 m MG132 for 8 h. Immunoprecipitation (IP) with anti‐Flag antibody and Western blotting with anti‐Myc antibody were performed to detect the ubiquitination level of ACSL4. c) HEK293T cells were treated as in (b) and treated with or without 10 × 10−9 m EZM2302 for 24 h. IP with an anti‐Flag antibody and Western blotting with an anti‐ubiquitin antibody were performed to detect the ubiquitination level of ACSL4. d) IP analyses were performed to examine the interaction between the indicated E3 ubiquitin ligase and endogenous ACSL4 using anti‐Flag antibodies in HEK293T cells. e) Western blot analysis of HEK293T cells transfected with the indicated siRNAs of E3 ubiquitin ligase. Protein levels of ACSL4 were assayed. f) HEK293T cells transfected with the indicated plasmids and treated with 10 × 10−6 m MG132 for 8 h. IP with anti‐HA antibody and Western blotting with anti‐Myc antibody were performed to detect the ubiquitination level of ACSL4. g) IP analyses were performed to detect the interaction changes between ACSL4 WT or ACSL4 R339A and the indicated E3 ubiquitin ligase. h) Immunofluorescence staining was performed to observe the colocalization changes of ACSL4 (green) and RNF25 (red) in ACSL4 WT and ACSL4 R339A LoVo cells. The nucleus is labeled by using DAPI (blue). Scale bar, 20 µm. i) Statistics of the colocalization of ACSL4 and RNF25, as indicated by Pearson's correlation (30 cells per sample). The data shown represent the mean ± SD. Comparisons were made by using two‐tailed, unpaired Student's t‐test; *** p < 0.001.
Figure 7
Figure 7
RNF25 knockdown inhibits CARM1‐induced ferroptosis resistance. a) Western blot analysis of LoVo and HCT116 cells transfected with the indicated plasmid and siRNAs. Protein levels of CARM1, RNF25, ACSL4 and ACSL4 R339me2a were assayed. b) Western blot analysis of vector‐ and RNF25‐overexpressing LoVo and HCT116 cells treated with DMSO or 10 × 10−9 m EZM2302 for 24 h. Protein levels of RNF25, ACSL4, and H3R17me2a were assayed. c) HEK293T cells transfected with the indicated plasmids and treated with or without 10 × 10−9 m EZM2302 for 24 h. Immunoprecipitation (IP) with an anti‐Flag antibody and Western blotting with an anti‐Myc antibody were performed to detect the ubiquitination level of ACSL4. d) Cell viability was assayed in the indicated LoVo and HCT116 cells as (a) treated with 2. 5 × 10−6 m RSL3 for 12 h (n = 5 independent experiments). e,f) Malondialdehyde (MDA) levels and relative lipid ROS were assayed in the indicated LoVo and HCT116 cells treated with 2. 5 × 10⁻⁶ m RSL3 for 12 h (n = 3 independent experiments). g) Mitochondrial membrane potential was detected for the same cells as (e) by using fluorescence staining of mitochondria with JC‐1 dye (n = 3 independent experiments). h) Schematic diagram of our hypothesis about this project. The data shown represent the mean ± SD. Comparisons were made by using one‐way ANOVA with Tukey's test; * p < 0.05, ** p < 0.01, *** p < 0.001.
Figure 8
Figure 8
EZM2302 strengthens the efficacy of immunotherapy by promoting ferroptosis. a) Treatment protocol for MC38 xenografts in C57 mice following treatment with mouse anti‐PD1 antibody and EZM2302. b) MC38 cells were subcutaneously injected into the mice, and tumors were treated with mouse anti‐PD1 antibody and EZM2302. After tumors grew to 100 mm3, tumor volumes (n = 5) were calculated every 3 days, and the growth curve was drawn. c,d) Images of tumor size in different groups are shown, and the tumor weights (n = 5) of the subcutaneous xenografts were measured. e) Representative dot plot of mouse CD8+ T cells examined for the expression of interferon γ (IFN‐γ) (left) and granzyme B (GzmB) (right) after the indicated treatments. The proportions of cells with IFN‐γ or GzmB expression are shown on the left (n = 5 independent experiments). f,g) Representative contour plots of human peripheral CD8+ T cells examined for the expression of IFN‐γ (middle left) and granzyme B (GzmB) (bottom left) after the indicated treatments. h,i) Malondialdehyde (MDA) levels and relative lipid ROS in tumor cells isolated from (d) were assayed (n = 5 independent experiments). The data shown represent the mean ± SD. Comparisons were made by using one‐way ANOVA with Tukey's test; ** p < 0.01, *** p < 0.001.

References

    1. Dixon S. J., Lemberg K. M., Lamprecht M. R., Skouta R., Zaitsev E. M., Gleason C. E., Patel D. N., Bauer A. J., Cantley A. M., Yang W. S., Morrison B., Stockwell B. R., Cell 2012, 149, 1060. - PMC - PubMed
    1. Tang D., Chen X., Kang R., Kroemer G., Cell Res. 2021, 31, 107. - PMC - PubMed
    1. Yang W. S., Stockwell B. R., Trends Cell Biol. 2016, 26, 165. - PMC - PubMed
    1. Friedmann Angeli J. P., Schneider M., Proneth B., Tyurina Y. Y., Tyurin V. A., Hammond V. J., Herbach N., Aichler M., Walch A., Eggenhofer E., Basavarajappa D., Rådmark O., Kobayashi S., Seibt T., Beck H., Neff F., Esposito I., Wanke R., Förster H., Yefremova O., Heinrichmeyer M., Bornkamm G. W., Geissler E. K., Thomas S. B., Stockwell B. R., O'donnell V. B., Kagan V. E., Schick J. A., Conrad M., Nat. Cell Biol. 2014, 16, 1180. - PMC - PubMed
    1. Ahola S., Rivera P. M., Hermans S., Chandragiri S., Giavalisco P., Nolte H., Langer T., Cell Metab. 2022, 34, 1875. - PubMed

Publication types

Substances

LinkOut - more resources