. 2024 Jan;11(2):e2302965.
doi: 10.1002/advs.202302965. Epub 2023 Nov 9.

YAP Signaling Regulates the Cellular Uptake and Therapeutic Effect of Nanoparticles

Affiliations

YAP Signaling Regulates the Cellular Uptake and Therapeutic Effect of Nanoparticles

Marco Cassani et al. Adv Sci (Weinh). 2024 Jan.

Abstract

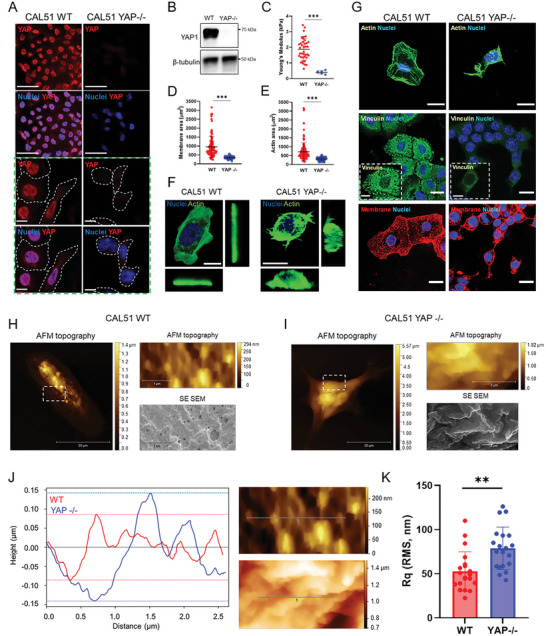
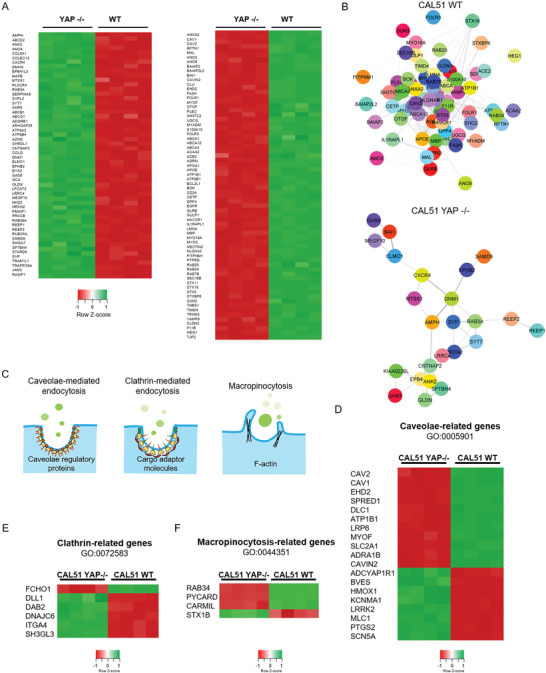
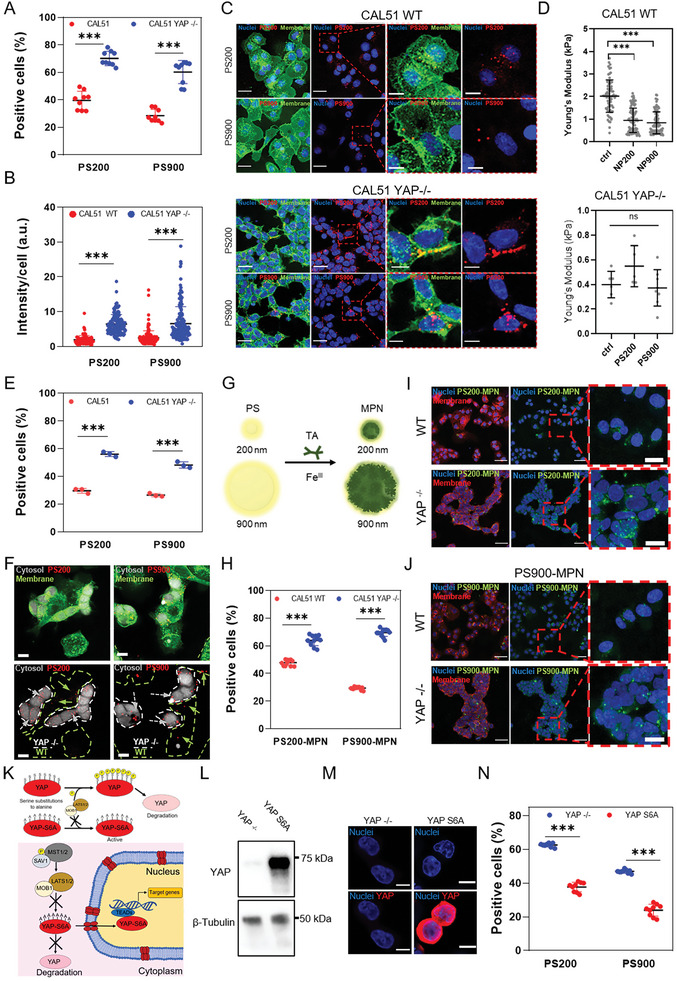
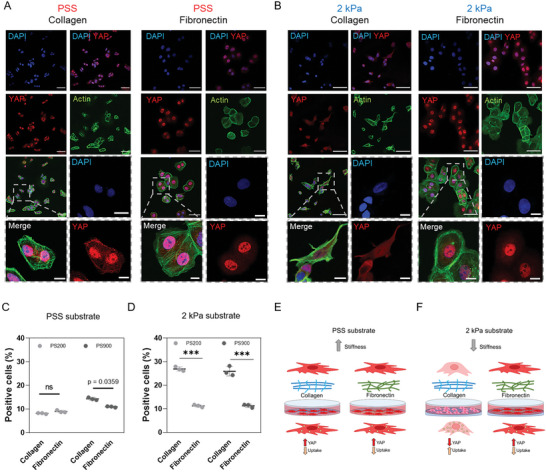
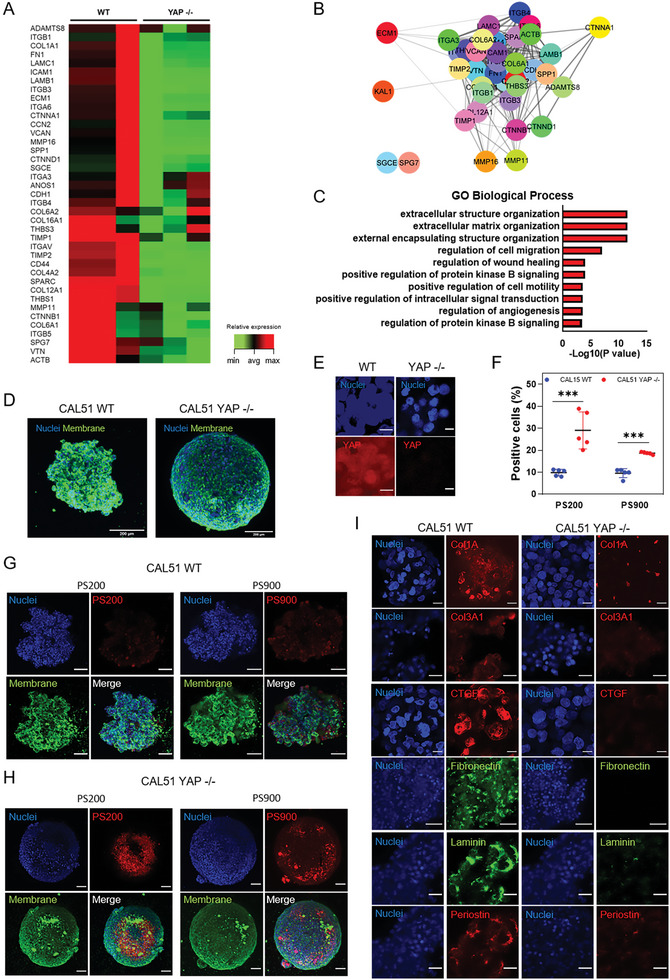
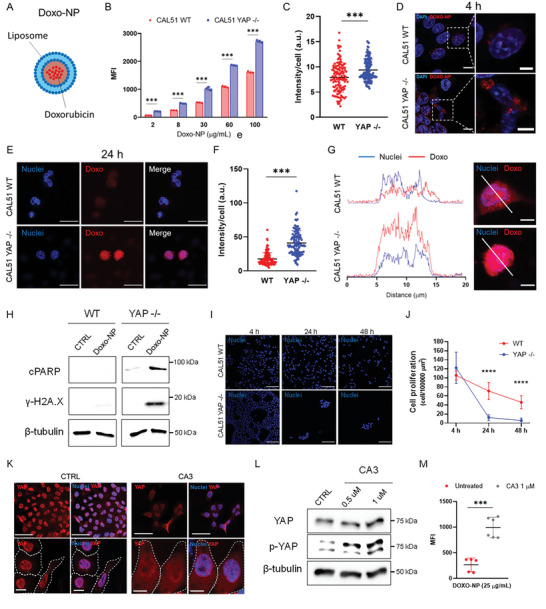
Interactions between living cells and nanoparticles are extensively studied to enhance the delivery of therapeutics. Nanoparticles size, shape, stiffness, and surface charge are regarded as the main features able to control the fate of cell-nanoparticle interactions. However, the clinical translation of nanotherapies has so far been limited, and there is a need to better understand the biology of cell-nanoparticle interactions. This study investigates the role of cellular mechanosensitive components in cell-nanoparticle interactions. It is demonstrated that the genetic and pharmacologic inhibition of yes-associated protein (YAP), a key component of cancer cell mechanosensing apparatus and Hippo pathway effector, improves nanoparticle internalization in triple-negative breast cancer cells regardless of nanoparticle properties or substrate characteristics. This process occurs through YAP-dependent regulation of endocytic pathways, cell mechanics, and membrane organization. Hence, the study proposes targeting YAP may sensitize triple-negative breast cancer cells to chemotherapy and increase the selectivity of nanotherapy.

Keywords: YAP-signaling; bio-nano interactions; cancer treatment; mechanobiology; nanoparticles.


Conflict of interest statement

The authors declare no conflict of interest.

Figures

Figure 1
Figure 1
YAP depletion affects CAL51 adhesion, mechanics, morphology, and membrane properties. A) Representative confocal images depicting YAP expression in WT or YAP ‐/‐ CAL51 cells. Cells were stained for YAP (AF555, red), and nuclei were counterstained with DAPI (blue). Scale bar: 50 µm. The green dashed line box shows higher magnification pictures. Scale bar: 10 µm. B) Western blot analysis showing the levels of YAP protein in WT or YAP ‐/‐ CAL51 cells. β‐tubulin was used for protein loading normalization. C) Dot plot representation of the Young's modulus analysis of WT or YAP ‐/‐ CAL51 cells as measured by atomic force microscopy (AFM). WT CAL51: n = 80; YAP ‐/‐ CAL51: n = 10. Statistical analysis was performed by unpaired t‐test with Welch's correction; *** p < 0.001. D) Dot plot analysis of WT or YAP ‐/‐ CAL51 total membrane area. Cells were stained with Alexa Fluor 488‐labeled wheat germ agglutinin (WGA‐488, green). n > 100 cells. Statistical analysis was performed by unpaired t‐test with Welch's correction; *** p < 0.001. E) Dot plot analysis of WT or YAP ‐/‐ CAL51 cell surface area calculated based on the total actin coverage of the cells. Cells were stained with Alexa Fluor 488‐labeled Phalloidin (Pha‐488, green). n > 100. Statistical analysis was performed by unpaired t‐test with Welch's correction; *** p < 0.001. F) CAL51 WT (left) and YAP ‐/‐ cells (right) 3D reconstruction. Cells were stained with DAPI and WGA‐488 (green). Scale bar: 20 µm. G) Representative confocal images of WT or YAP ‐/‐ CAL51 cells stained for nuclei (DAPI, blue) and actin (Pha‐488, green, top), vinculin (AF488, green, middle), and membrane (WGA‐647, red, bottom), respectively. Scale bar: 20 µm. The insets display high‐magnification images. Scale bar: 10 µm. Correlative Probe and Electron Microscopy (CPEM) imaging of CAL51 WT (H) and CAL51 YAP ‐/‐ (I) cells. AFM and SEM images are shown. White dashed line boxes indicate the detail of the magnifications shown as AFM and SEM images on the right of each main micrograph. J) Plot displaying the profile of the membrane roughness as determined for WT (red) and YAP ‐/‐ (blue) CAL51 cells in the region highlighted in the SEM images on the right (red dashed line, top for CAL51 WT; blue dashed line, bottom for YAP ‐/‐ CAL51). The roughness profile was calculated on the deconvolved images. Scale bar: 0.5 µm. K) Mean square roughness of the height irregularity (R q) measured on WT (red) and YAP ‐/‐ (blue) CAL51cells. n = 20. Statistical analysis was performed by unpaired t‐test with Welch's correction; ** p < 0.01.
Figure 2
Figure 2
YAP depletion alters the expression of genes related to membrane organization and endocytosis pathways. A) Heatmap of the relative expression of significantly regulated genes associated with the membrane organization network in YAP ‐/‐ and WT CAL51 cells. n = 4 (P adj < 0.05, log2Fc > ǀ2ǀ). B) STRING PPI network of differently expressed proteins involved in membrane organization in WT (top) and YAP ‐/‐ CAL51 (bottom) cells obtained from Cytoscape (P adj < 0.05, log2Fc > ǀ2ǀ, confidence cutoff 0.4). C) Graphical representation of the main mechanisms of endocytosis, i.e., caveolae‐related endocytosis, clathrin‐related endocytosis, and macropinocytosis, investigated in the present study. D) Heatmap of genes involved in endocytosis pathways for caveolae‐related genes. E) heatmap of genes involved in clathrin‐mediated endocytosis pathways. F). Heatmap of genes involved in macropinocytosis (P adj < 0.05, log2Fc > ǀ1ǀ).
Figure 3
Figure 3
YAP knockout promotes nanoparticle binding and internalization in CAL51 TNBC cells. A) 4‐hour cellular uptake of PS200 and PS900 in WT (red) and YAP ‐/‐ CAL51 (blue). Statistical analysis was performed using the two‐way ANOVA followed by Sidak's multiple comparisons test. n = 3; *** p < 0.001. B) Nanoparticle intensity per cell after 4 h of incubation of CAL51 WT and YAP ‐/‐ cells with PS200 and PS900. Statistical analysis was performed using the two‐way ANOVA followed by Sidak's multiple comparisons test. n = 3; *** indicates p < 0.001. n > 100 cells. C) Confocal images of WT (top) and YAP ‐/‐ (bottom) CAL51 cells after 4 h of incubation with PS200 and PS900. Cells were stained with WGA‐488 (green) and/or DAPI (blue). Magnified images are displayed inside the red dashed line boxes for each cell and particle type. Scale bar: 25 and 10 µm. D) Young's modulus analysis of WT (top) and YAP ‐/‐ (bottom) cells after 4 h of incubation with PS200 and PS900, as measured by atomic force microscopy (AFM). Statistical analysis was performed using the Kruskal–Wallis one‐way ANOVA followed by Dunn's multiple comparisons test. WT CAL51: n = 80; YAP ‐/‐ CAL51: n = 10; *** p < 0.001; ns, non‐significant. E) 4‐hour cellular uptake of PS200 and PS900 in a co‐culture of WT (red) and YAP ‐/‐ (blue) CAL51. Statistical analysis was performed using the two‐way ANOVA followed by Sidak's multiple comparisons test. n = 3; *** p < 0.001. F) Confocal images of WT and YAP ‐/‐ cells co‐culture in the presence of PS200 and PS900 for 4 h. White dashed line indicates CAL51 YAP ‐/‐ cells. Grey arrows indicate particles co‐localized with YAP ‐/‐ cells (encircled by white dashed lines), while green arrows indicate particles in contact with WT cells (encircled by green dashed lines). CAL51 YAP ‐/‐ cells are stained with 7‐amino‐4‐chloromethylcoumarin (grey) and whole cell population with WGA‐488 (green). Scale bar: 10 µm. G) The surface properties of PS200 and PS900 were modified by MPN coating, using tannic acid and FeCl3. H) 4‐hour cellular uptake of PS200‐MPN and PS900‐MPN for WT (red) and YAP ‐/‐ (blue) CAL51. Statistical analysis was performed using the two‐way ANOVA followed by Sidak's multiple comparisons test. n = 3; *** p < 0.001. I,J) Confocal images of WT (top) and YAP ‐/‐ (bottom) CAL51 cells after 4 h of incubation with PS200 (I) and PS900 (J). Cells are stained with WGA‐647 (red) and DAPI (blue). The particles are displayed in green. Magnified images are displayed inside red dashed line boxes for each cell and particle type. Scale bar: 50 and 10 µm. K) Schematic representation of the phosphorylation‐mediated repression of YAP translocation to the nucleus by kinases involved in different pathways, mainly Hippo pathway (LATS1/2 kinases and scaffolding protein MOB1). Due to substitutions of serine residues with alanine residues in six different positions (S61A, S109A, S127A, S128A, S131A, S136A, S164A, and S381A), YAP‐S6A cannot be phosphorylated by upstream kinases, thus is constitutively active in the cell nucleus. L) Western blot analysis of the levels of YAP protein in CAL51 YAP ‐/‐ and in cells transfected with a plasmid carrying a copy of the YAPS6A gene. β‐tubulin was used for protein loading normalization. M) Confocal images of YAP ‐/‐ (CTRL) and YAPS6A CAL51. Cells were stained with DAPI (blue) and YAP (AF555, red). Scale bar: 10 µm. N) 4‐hour cellular uptake of PS200 and PS900 in YAP ‐/‐ (blue) and YAPS6A (red) CAL51. Statistical analysis was performed using the two‐way ANOVA followed by Sidak's multiple comparisons test. n = 3; *** p < 0.001.
Figure 4
Figure 4
Substrate mechanics impairs nanoparticle uptake through YAP. A) Confocal images of CAL51 WT cells grown on a stiff polystyrene substrate coated with collagen (left) or fibronectin (right). Cells were stained with DAPI (blue), Pha‐488 (green), and YAP (AF555, red). Magnified images are displayed inside gray dashed line boxes. Scale bar: 50 and 10 µm. B) Confocal images of WT CAL51 cells grown on a 2 kPa soft substrate coated with collagen (left) or fibronectin (right). Cells were stained with DAPI (blue), Pha‐488 (green), and YAP (AF555, red). Magnified images are displayed inside gray dashed line boxes. Scale bar: 50 and 10 µm. C) 4‐hour cellular uptake of PS200 (light gray) and PS900 (dark gray) in WT cells grown on a stiff polystyrene substrate coated with collagen or fibronectin. Statistical analysis was performed using the two‐way ANOVA followed by Sidak's multiple comparisons test. n = 3; ns, non‐significant. D) 4‐hour cellular uptake of PS200 (light gray) and PS900 (dark gray) in WT CAL51 grown on a 2 kPa soft substrate coated with collagen or fibronectin. Statistical analysis was performed using the two‐way ANOVA followed by Sidak's multiple comparisons test. n = 3; *** p < 0.001. E) Schematic representation of the mechanism proposed for the differences found in nanoparticle uptake in WT CAL51 cells grown on polystyrene substrates. The cells are well‐spread and attached to the surface, with high YAP nuclear localization. F) Schematic representation of the mechanism proposed for the differences found in nanoparticle uptake in WT CAL51 cells grown on soft substrates. When cells are grown on a soft substrate with a molecular‐mechanical inert coating such as collagen, YAP shuttles out of the nucleus in an inactive state, and cells appear round and poorly spread. This decrease in YAP activity leads to a significant increase in nanoparticle uptake. Conversely, fibronectin coating outplays soft stiffness substrates, activates YAP and restores the mechanical properties. Nanoparticle uptake is reduced similar to what happens on stiff polystyrene.
Figure 5
Figure 5
YAP knockdown affects nanoparticle binding and ECM deposition in 3D CAL51 spheroids. A) Heatmap representing the changes in expression for ECM and cell adhesion molecules in YAP ‐/‐ compared to WT CAL51 cells, as obtained from RT2‐profiler PCR array analysis (P adj < 0.05, fold change 2). B) STRING PPI network of differently expressed ECM proteins in CAL51 WT obtained from Cytoscape (P adj < 0.05, log2Fc > ǀ2ǀ, confidence cutoff 0.4). C) Bar plot representation of common enriched biological processes and pathways related to ECM network from the ENRICHR database, showing the most significantly upregulated genes in WT compared to YAP ‐/‐ CAL51 cells (P adj < 0.05, log2Fc > ǀ2ǀ). D) Z‐projection images of WT (left) and YAP ‐/‐ CAL51 (right) spheroids after 5 days of culture. Cells are stained with WGA‐488 (green) and DAPI (blue). Scale bar: 200 µm. E) Confocal images of the spheroids derived from WT and YAP ‐/‐ cells. Cells were stained with DAPI (blue) and YAP (AF555, red). Scale bar: 10 µm. F) 4‐hour cellular uptake of PS200 and PS900 in WT (red) and YAP ‐/‐ (blue) CAL51 spheroids. Statistical analysis was performed using the two‐way ANOVA followed by Sidak's multiple comparisons test. n = 5; *** p < 0.001. G) Confocal images of the spheroids derived from WT CAL51 cells incubated with PS200 (left) and PS900 (right) for 4 h. H) Representative confocal images of the spheroids derived from YAP‐/‐ CAL51 cells incubated with PS200 (left) and PS900 (right) for 4 h. Cells were stained with WGA‐488 (green) and DAPI (blue). Nanoparticles are shown in red. Scale bar: 100 µm. I) Representative confocal images of the indicated ECM components for the spheroids derived from WT (left) and YAP ‐/‐ (right) CAL51 cells. Collagen type 1 alpha (Col1A), collagen type III alpha 1 (Col3A1), connective tissue growth factor (CTGF), and periostin are stained with 2nd antibody labeled with AF‐555 (red); fibronectin and laminin are stained with II‐antibody labeled with AF‐488 (green). Scale bar: 25 µm.
Figure 6
Figure 6
Pharmacological and genetic targeting of YAP increases the internalization of doxorubicin‐loaded liposomes and improves drug delivery in TNBC CAL51 cells. A) Graphical representation of doxorubicin‐loaded liposome (Doxo‐NP) formulation used for drug delivery. B) Median fluorescence intensity (MFI) of Doxo‐NP uptake in WT (red) and YAP ‐/‐ (blue) CAL51 as a function of nanoparticle concentration after 4‐hour incubation. Statistical analysis was performed using the two‐way ANOVA followed by Sidak's multiple comparisons test. n = 3; *** p < 0.001. C) Nanoparticle intensity per cell after a 4‐hour incubation of WT and YAP ‐/‐ CAL51 cells with Doxo‐NP. Statistical analysis was performed using the unpaired t‐test with Welch's correction. n > 120; *** p < 0.001. D) Confocal images of WT (top) and YAP ‐/‐ (bottom) CAL51 cells after 4‐hour incubation with Doxo‐NP. Cells were stained with DAPI (blue). Nanoparticles are displayed in red. Magnified images are shown inside white dashed line boxes. Scale bar: 10 and 5 µm. E) Representative confocal images of WT (top) and YAP ‐/‐ (bottom) CAL51 cells at 24 h after 4‐hour incubation with Doxo‐NP. Cells were stained with DAPI (blue). Doxorubicin is displayed in red. Scale bar: 20 µm. F) Dot plot representation of doxorubicin intensity per cell at 24 h after a 4‐hour incubation of WT and YAP ‐/‐ cells with Doxo‐NP. Statistical analysis was performed using the unpaired t‐test with Welch's correction. n > 100; *** p < 0.001. G) A plot profile of doxorubicin intensity (red) co‐localized with the nucleus (blue, DAPI) of WT (top) and YAP ‐/‐ (bottom) CAL51 cells. On the right, confocal images show a detailed view of the region chosen for the intensity plots (white line) in WT (top) and YAP ‐/‐ (bottom) cells. Scale bar: 10 µm. H) Western blot showing the levels of cleaved PARP (cPARP) and histone H2AX (γ‐H2A.X) in WT (left) and YAP ‐/‐ (right) CAL51 cells untreated (CTRL) or treated with Doxo‐NP for 4 h and collected for the analysis 48 h post‐treatment. β‐tubulin was used for protein loading normalization. I) Representative confocal images of WT (top) and YAP ‐/‐ (bottom) CAL51cells after 4 h of incubation with Doxo‐NP and 24 and 48 h after treatment with the nanoparticles. Nuclei were stained with DAPI. Scale bar: 100 µm. J) Cell proliferation plot expressed as number of cells per surface area for WT (red line and circle) and YAP ‐/‐ (blue line and squares) CAL51cells at 0, 24, and 48 h after 4‐hour Doxo‐NP treatment. Statistical analysis was performed using the two‐way ANOVA followed by Sidak's multiple comparisons test. n = 3; *** p < 0.001. K) Representative confocal images of untreated (CTRL, left) or CA3‐treated WT cells (1 µm CA3, left) for 12 h. Cells were stained with YAP (AF555, red) and the nuclei were counterstained with DAPI (blue) and. The cell perimeter and cell nuclei are highlighted with a dashed white line and a dashed blue line respectively, in magnified images (bottom). Scale bar: 50 and 10 µm. L) Western blot showing the levels of YAP and phospho‐YAP (p‐YAP) in WT CAL51 untreated (CTRL) or treated with 0.5 and 1 µm CA3 inhibitor for 12 h. β‐tubulin was used for protein loading normalization. M) MFI after a 4‐hour incubation of CAL51 WT cells with Doxo‐NP without treatment (red) or after treatment with 1 µm CA3 inhibitor for 12 h (grey). Statistical analysis was performed using the unpaired t‐test with Welch's correction. n = 5; *** p < 0.001.

References

    1. Dupont S., Morsut L., Aragona M., Enzo E., Giulitti S., Cordenonsi M., Zanconato F., Le Digabel J., Forcato M., Bicciato S., Elvassore N., Piccolo S., Nature 2011, 474, 179. - PubMed
    1. Camargo F. D., Gokhale S., Johnnidis J. B., Fu D., Bell G. W., Jaenisch R., Brummelkamp T. R., Curr. Biol. 2007, 17, 2054. - PubMed
    1. Heallen T., Zhang M., Wang J., Bonilla‐Claudio M., Klysik E., Johnson R. L., Martin J. F., Science 2011, 332, 458. - PMC - PubMed
    1. Luo J., Li P., Stem Cell Res. Ther. 2022, 13, 10. - PMC - PubMed
    1. Zhang H., Pasolli H. A., Fuchs E., Proc. Natl. Acad. Sci. USA 2011, 108, 2270. - PMC - PubMed

Publication types

MeSH terms

Substances

LinkOut - more resources