

Effects of sensory integration training on balance function and executive function in children with autism spectrum disorder: evidence from Footscan and fNIRS
- PMID: 37946875
- PMCID: PMC10631781
- DOI: 10.3389/fpsyg.2023.1269462
Effects of sensory integration training on balance function and executive function in children with autism spectrum disorder: evidence from Footscan and fNIRS
Abstract
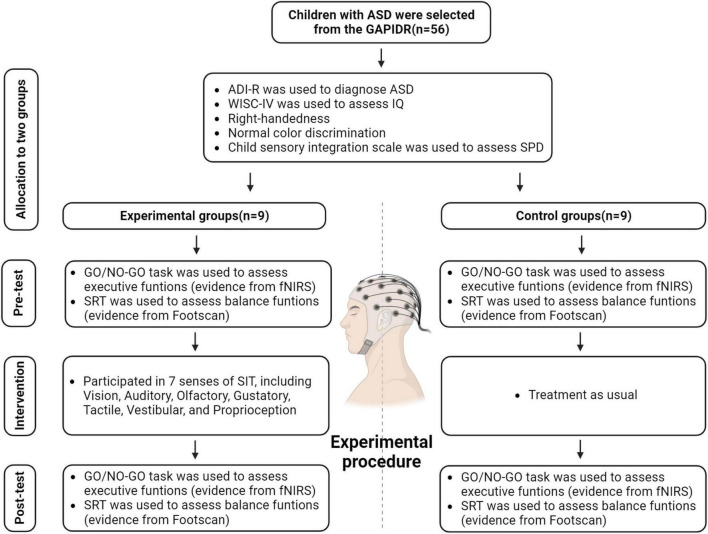
Introduction: This study investigates the efficacy of sensory integration training (SIT) in enhancing balance and executive functions in children with autism spectrum disorder (ASD), with the aim of highlighting its potential for organizing and processing sensory information in the brain.
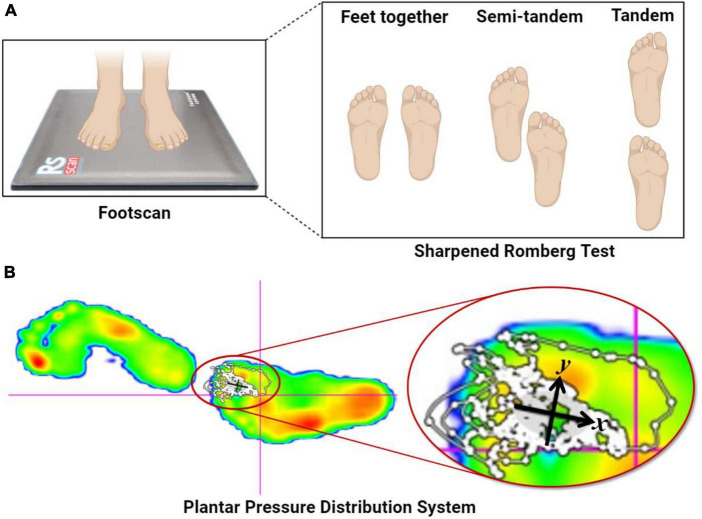
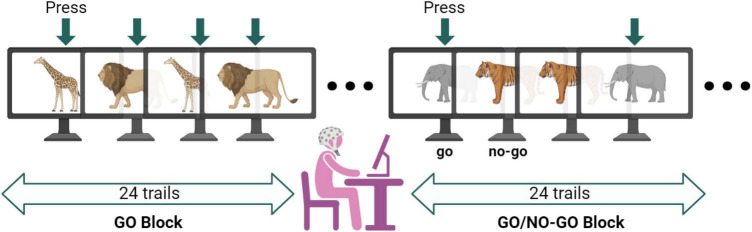
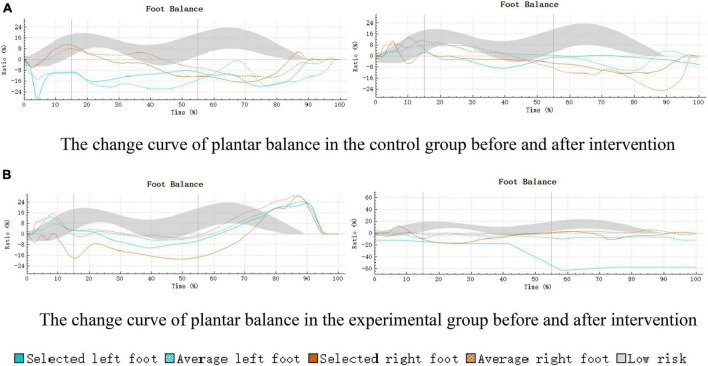
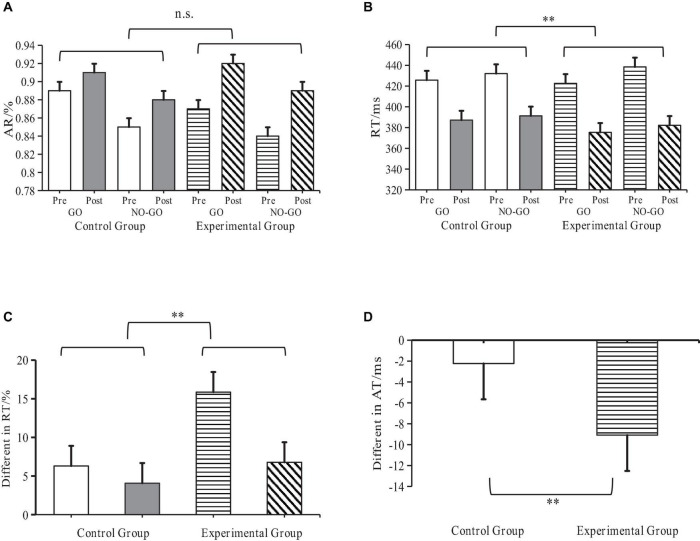
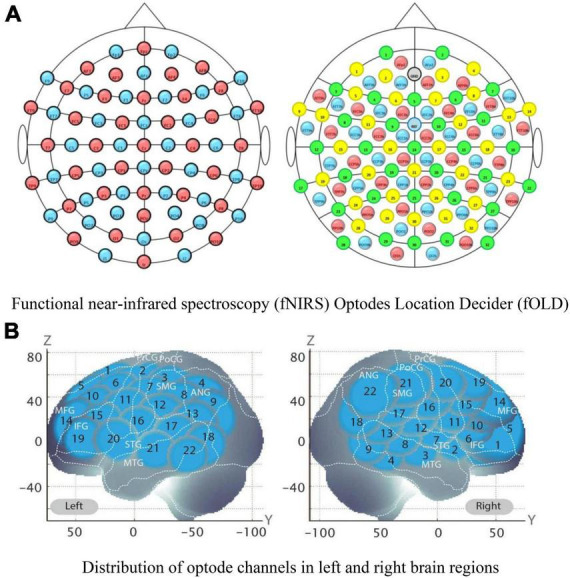
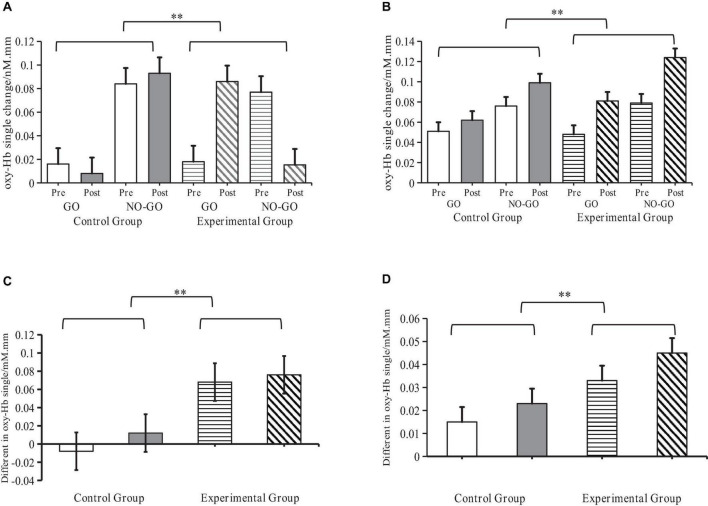
Methods: Utilizing Footscan for biomechanical evidence and functional near-infrared spectroscopy (fNIRS) for neural activation, we engaged two participant groups: a control group (n = 9) and an experimental group (n = 9). Assessments involved the Sharpened Romberg Test (SRT) for balance under varied visual conditions and the Go/No-Go task for executive function.
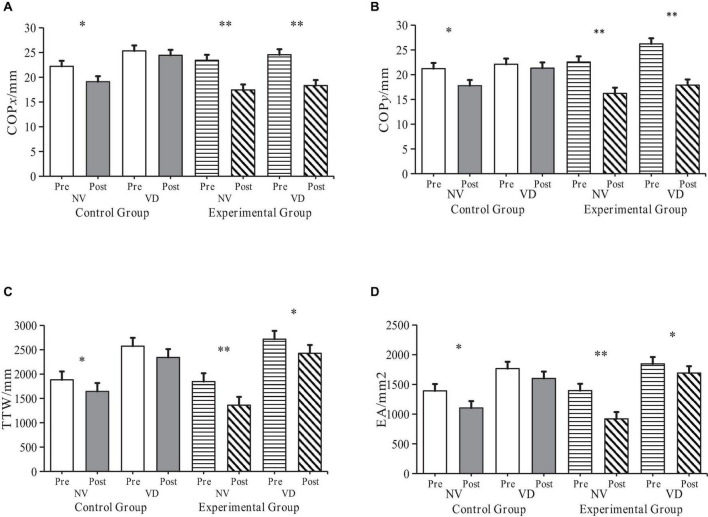
Results: The SIT intervention significantly improved balance function, particularly in Visual Deprivation (VD) scenarios. Neurophysiological data revealed heightened activation in the right Inferior Frontal Gyrus (R-IFG) and right Middle Frontal Gyrus (R-MFG), suggesting enhanced executive function. The potential of R-IFG/MFG activation as a reliable biomarker for assessing executive function in ASD was identified.
Discussion: The study provides empirical evidence supporting SIT's effectiveness in enhancing balance and executive functions in children with ASD. The therapy not only improves sensory processing and motor skills but also appears to compensate for sensory deficits, particularly in vision, vestibular perception, and proprioception. Enhanced neural activation in specific PFC regions underscores SIT's role in improving cognitive aspects, including inhibitory control and cognitive flexibility. The multidisciplinary approach adopted for this research highlights the intricate interplay between sensory-motor functions and cognitive control in ASD, paving the way for integrated therapeutic strategies. Despite these advancements, the mechanisms through which SIT exerts these multifaceted effects require further exploration.
Keywords: Footscan; Go/No-Go; balance function; executive function; fNIRS; sensory integration training.
Copyright © 2023 Deng, Lei and Du.
Conflict of interest statement
The authors declare that the research was conducted in the absence of any commercial or financial relationships that could be construed as a potential conflict of interest.
Figures
Similar articles
-
Sports game intervention aids executive function enhancement in children with autism - An fNIRS study.Neurosci Lett. 2024 Feb 6;822:137647. doi: 10.1016/j.neulet.2024.137647. Epub 2024 Jan 17. Neurosci Lett. 2024. PMID: 38242348 Clinical Trial.
-
Response inhibition in children with different subtypes/presentations of attention deficit hyperactivity disorder: A near-infrared spectroscopy study.Front Neurosci. 2023 Mar 2;17:1119289. doi: 10.3389/fnins.2023.1119289. eCollection 2023. Front Neurosci. 2023. PMID: 36937678 Free PMC article.
-
Effortful Control and Prefrontal Cortex Functioning in Children with Autism Spectrum Disorder: An fNIRS Study.Brain Sci. 2020 Nov 20;10(11):880. doi: 10.3390/brainsci10110880. Brain Sci. 2020. PMID: 33233632 Free PMC article.
-
Exploring brain functions in autism spectrum disorder: A systematic review on functional near-infrared spectroscopy (fNIRS) studies.Int J Psychophysiol. 2019 Mar;137:41-53. doi: 10.1016/j.ijpsycho.2019.01.003. Epub 2019 Jan 19. Int J Psychophysiol. 2019. PMID: 30664885
-
Stimulus processing and error monitoring in more-able kindergarteners with autism spectrum disorder: a short review and a preliminary Event-Related Potentials study.Eur J Neurosci. 2018 Mar;47(6):556-567. doi: 10.1111/ejn.13580. Epub 2017 Jun 8. Eur J Neurosci. 2018. PMID: 28394438 Review.
Cited by
-
Improving sensory integration in Chinese children with moderate sensory integration challenges through engaging basketball training.Front Psychol. 2025 Jan 15;15:1481945. doi: 10.3389/fpsyg.2024.1481945. eCollection 2024. Front Psychol. 2025. PMID: 39881696 Free PMC article.
-
Advances and trends in the application of functional near-infrared spectroscopy for pediatric assessments: a bibliometric analysis.Front Neurol. 2024 Sep 6;15:1459214. doi: 10.3389/fneur.2024.1459214. eCollection 2024. Front Neurol. 2024. PMID: 39309263 Free PMC article.
-
Effects of Baduanjin on motor function in children with developmental coordination disorders: study protocol for a randomised controlled trial.BMJ Open. 2024 Dec 2;14(12):e084061. doi: 10.1136/bmjopen-2024-084061. BMJ Open. 2024. PMID: 39622562 Free PMC article.
-
Effects of Rope Therapy on Social Attention and Temperament Traits in Autistic Children.Children (Basel). 2025 Jul 3;12(7):881. doi: 10.3390/children12070881. Children (Basel). 2025. PMID: 40723073 Free PMC article.
-
Effects of Dance-Based Aerobic Training on Functional Capacity and Risk of Falls in Older Adults with Mild Cognitive Impairment.J Clin Med. 2025 Aug 21;14(16):5900. doi: 10.3390/jcm14165900. J Clin Med. 2025. PMID: 40869725 Free PMC article.
References
-
- Akbar M., Loomis R., Paul R. (2013). The interplay of language on executive functions in children with ASD. Res. Autism Spectr. Disord. 7 494–501. 10.1016/j.rasd.2012.09.001 - DOI
-
- Ayres A. J. (1972). Sensory integration and learning disorders. Los Angeles, CA: Western Psychological Services.
-
- Ayres A. J. (2005). Sensory integration and the child: 25th anniversary edition. Los Angeles, CA: Western Psychological Services.
-
- Ayres A. J., Robbins J., McAtee S., Network P. T. (2005). Sensory integration and the child: Understanding hidden sensory challenges. Los Angeles, CA: Western Psychological Services.
LinkOut - more resources
Full Text Sources
Medical
Miscellaneous