. 2023 Dec 19;14(6):e0167623.
doi: 10.1128/mbio.01676-23. Epub 2023 Nov 10.

Eukaryotic genomes from a global metagenomic data set illuminate trophic modes and biogeography of ocean plankton

Affiliations

Eukaryotic genomes from a global metagenomic data set illuminate trophic modes and biogeography of ocean plankton

Harriet Alexander et al. mBio. .

Abstract

Single-celled eukaryotes play ecologically significant roles in the marine environment, yet fundamental questions about their biodiversity, ecological function, and interactions remain. Environmental sequencing enables researchers to document naturally occurring protistan communities, without culturing bias, yet metagenomic and metatranscriptomic sequencing approaches cannot separate individual species from communities. To more completely capture the genomic content of mixed protistan populations, we can create bins of sequences that represent the same organism (metagenome-assembled genomes [MAGs]). We developed the EukHeist pipeline, which automates the binning of population-level eukaryotic and prokaryotic genomes from metagenomic reads. We show exciting insight into what protistan communities are present and their trophic roles in the ocean. Scalable computational tools, like EukHeist, may accelerate the identification of meaningful genetic signatures from large data sets and complement researchers' efforts to leverage MAG databases for addressing ecological questions, resolving evolutionary relationships, and discovering potentially novel biodiversity.

Keywords: eukaryotic metagenome-assembled genomes; genomes; metagenomics; protists.


Conflict of interest statement

The authors declare no conflict of interest.

Figures

Fig 1
Fig 1
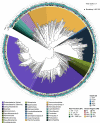
TOPAZ eukaryotic MAGs span the eukaryotic tree of life. The maximum likelihood tree was inferred from a concatenated protein alignment of 49 proteins from the eukaryotic BUSCO gene set (eukaryota_odb10) that were found to be commonly present across at least 75% of the 485 TOPAZ eukaryotic MAGs that were estimated to be 30% complete based on BUSCO ortholog presence (highly complete). The MAG names were omitted but the interactive version of the tree containing the MAG names can be accessed through iTOL (https://itol.embl.de/shared/halexand). Branches (nodes) are colored based on consensus protein annotation estimated by EUKulele and MM-Seqs. The OR, D, and SF of the co-assembly that a MAG was isolated from are color coded as colored bars. The completeness (comp), or percentage of the 255 eukaryotic BUSCOs present in a MAG, and contamination (cont), or over-representation (more than one copy) of eukaryotic BUSCOs in a MAG, are depicted as a heatmap. Predicted heterotrophy index (H-index), which ranges from phototroph-like (-300) to heterotroph-like (300) is shown as a heatmap. The predicted trophic mode (T-pred) based on the trophy random forest classifier with heterotroph (pink) and phototroph (green) is depicted. The number of proteins predicted with EukMetaSanity is shown as a bar graph along the outermost ring.
Fig 2
Fig 2
Estimated trophic status of TOPAZ eukaryotic MAGs. (Top) Trophic status was predicted for each high-completion TOPAZ eukaryotic MAG using a Random Forest model trained on the presence and absence of KEGG orthologs and is shown as a color (green, phototroph, pink, heterotroph). The heterotrophy index (H-index) (equation 8) for each MAG is plotted with a box plot showing the range of the H-index for each higher-level group. (Bottom) The relative distribution and abundance of phototroph (green), non-metazoan heterotroph (pink), and metazoan heterotroph (purple) are depicted across all surface samples. Plots are subdivided by size classes. “SAR” denotes MAGs with taxonomy assignments that were not resolved beyond the SAR group (Stramenopile, Alveolate, or Rhizaria).
Fig 3
Fig 3
Diversity of the high-quality non-redundant bacterial TOPAZ MAGs. The approximately maximum-likelihood phylogenetic tree was inferred from a concatenated protein alignment of 75 proteins using FastTree and GToTree workflow. The MAG names were omitted but the interactive version of the tree containing the MAG names can be accessed through iTOL (https://itol.embl.de/shared/halexand). Branches (nodes) are colored based on taxonomic annotations estimated by GTDBtk. The OR, SF, and D of the co-assembly that a MAG was isolated from is color coded as colored bars. The GC (%) content is shown as a bar graph (in green), the genome size as a bubble plot (the estimated size of the smallest genome included in this tree is 1.00 Mbp and the largest is 13.24 Mbp), and the number of MAGs in each genomic cluster (of 99 or higher %ANI) as a bar plot (in gray).
Fig 4
Fig 4
Distinct communities recovered from the TOPAZ MAGs. (a) A network analysis performed on the metagenomic abundance of all recovered eukaryotic and prokaryotic TOPAZ MAGs based on Spearman correlation analysis, identifying five distinct communities (see Materials and Methods). A force-directed layout of the seven communities is shown with eukaryotes (circles) and bacteria (triangles). Only linkages between eukaryotes are visualized. (b) The connectedness and taxonomic composition of each community are depicted. Connectedness was calculated based on equations 9)–11. (c) A Spearman correlation between the summed metagenomic abundance of each community and environmental parameters from the sampling (70), modeled mesoscale physical features based on d’Ovidio et al. (71) (indicated with *), and averaged remote sensing products (indicated with **). Significant Spearman correlations, those with a Bonferroni adjusted P < 0.01, are indicated with a dot on the heatmap.

References

    1. Caron DA, Countway PD, Jones AC, Kim DY, Schnetzer A. 2012. Marine protistan diversity. Annu Rev Mar Sci 4:467–493. doi:10.1146/annurev-marine-120709-142802 - DOI - PubMed
    1. Mitra A, Flynn KJ, Burkholder JM, Berge T, Calbet A, Raven JA, Granéli E, Glibert PM, Hansen PJ, Stoecker DK, Thingstad F, Tillmann U, Våge S, Wilken S, Zubkov MV. 2014. The role of mixotrophic protists in the biological carbon pump. Biogeosciences 11:995–1005. doi:10.5194/bg-11-995-2014 - DOI
    1. Caron DA, Alexander H, Allen AE, Archibald JM, Armbrust EV, Bachy C, Bell CJ, Bharti A, Dyhrman ST, Guida SM, Heidelberg KB, Kaye JZ, Metzner J, Smith SR, Worden AZ. 2017. Probing the evolution, ecology and physiology of marine protists using transcriptomics. Nat Rev Microbiol 15:6–20. doi:10.1038/nrmicro.2016.160 - DOI - PubMed
    1. Strom SL. 2008. Microbial ecology of ocean biogeochemistry: a community perspective. Science 320:1043–1045. doi:10.1126/science.1153527 - DOI - PubMed
    1. Caron DA, Countway PD. 2009. Hypotheses on the role of the protistan rare biosphere in a changing world. Aquat Microb Ecol 57:227–238. doi:10.3354/ame01352 - DOI