. 2023 Oct 24;12(21):2514.
doi: 10.3390/cells12212514.

Generation of Fibrotic Liver Organoids Using Hepatocytes, Primary Liver Sinusoidal Endothelial Cells, Hepatic Stellate Cells, and Macrophages

Affiliations

Generation of Fibrotic Liver Organoids Using Hepatocytes, Primary Liver Sinusoidal Endothelial Cells, Hepatic Stellate Cells, and Macrophages

Yongdae Yoon et al. Cells. .

Abstract

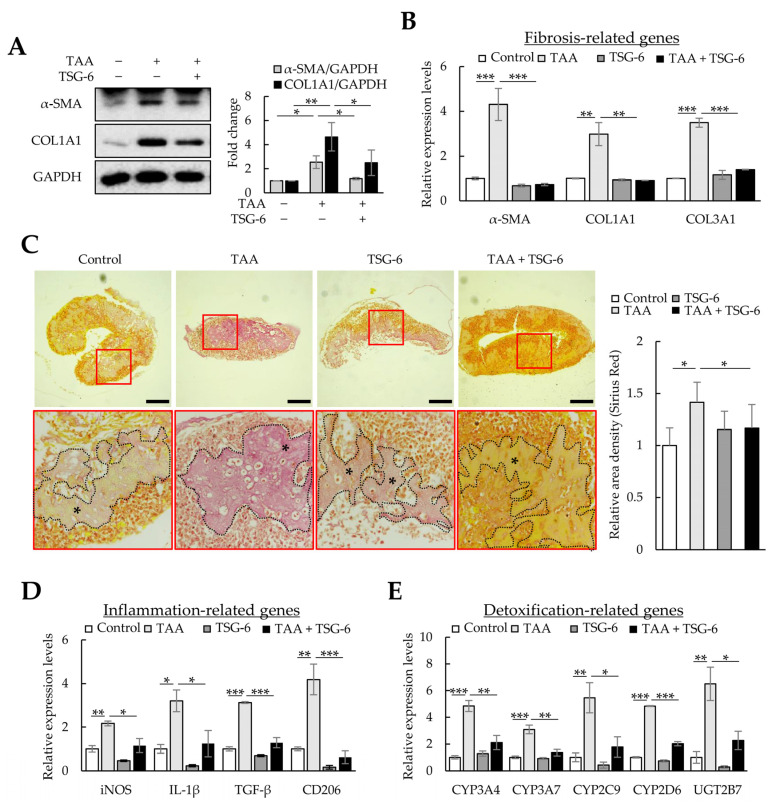
Liver organoids generated with single or multiple cell types have been used to investigate liver fibrosis development, toxicity, pathogenesis, and drug screening. However, organoid generation is limited by the availability of cells isolated from primary tissues or differentiated from various stem cells. To ensure cell availability for organoid formation, we investigated whether liver organoids could be generated with cell-line-based Huh-7 hepatocellular carcinoma cells, macrophages differentiated from THP-1 monocytes, and LX-2 hepatic stellate cells (HSCs) and primary liver sinusoidal endothelial cells (LSECs). In liver organoids, hepatocyte-, LSEC-, macrophage-, and HSC-related gene expression increased relative to that in two-dimensional (2D)-cultured Huh-7/LSEC/THP-1/LX-2 cells without Matrigel. Thioacetamide (TAA) increased α-smooth muscle actin expression in liver organoids but not in 2D-cultured cells, whereas in TAA-treated organoids, the expression of hepatic and LSEC markers decreased and that of macrophage and HSC markers increased. TAA-induced fibrosis was suppressed by treatment with N-acetyl-L-cysteine or tumor-necrosis-factor-stimulated gene 6 protein. The results showed that liver toxicants could induce fibrotic and inflammatory responses in liver organoids comprising Huh-7/LSEC/macrophages/LX-2 cells, resulting in fibrotic liver organoids. We propose that cell-line-based organoids can be used for disease modeling and drug screening to improve liver fibrosis treatment.

Keywords: Matrigel; fibrosis; inflammation; liver organoid; three-dimensional culture.


Conflict of interest statement

The authors declare no conflict of interest.

Figures

Figure 1
Figure 1
Liver organoids generated by multiple cells. To generate self-assembled liver organoids, Huh-7, liver sinusoidal endothelial (LSECs), LX-2, and macrophage cells were seeded in a Matrigel-coated 96-well plate and cultured for three days. Fibrotic liver organoids were produced by thioacetamide (TAA) treatment for an additional three days. (A) Schematic diagram of the experimental protocol. (B) Representative images of 2D-cultured cells at the indicated time points (days 0–3). The medium was replaced with fresh medium every two days. (C) Representative images at indicated time points (days 0 to 6). The self-assembled liver organoid was cultured for six days without subculturing while exchanging with fresh medium every two days. (D) Viability of 2D-cultured cells and organoids up to six days. * p < 0.05. (E) Cells required for self-assembly of liver organoids. Liver organoids were prepared by excluding one cell type from the Huh-7, LSECs, LX-2, and macrophage cells or by replacing LSECs with human umbilical vein endothelial cells (HUVECs). (F) Images of representative liver organoids generated using immortalized primary hepatocytes and LSECs instead of Huh-7 and LSECs. Scale bar for (B,C,E,F): 1 mm. (G) Immunofluorescence images of liver organoids. To evaluate the cell distribution, antibodies against CK8, CD31, EMR1, and PDGFRα/β were applied to liver organoid sections obtained from day 6 without TAA treatment to detect Huh-7, LSECs, macrophages, and LX-2 cells, respectively. Red arrowheads indicate PDGFRα/β-positive cells. Green arrowheads indicate CK8-, CD31-, or EMR1-positive cells. Scale bars: 500 µm. Data shown for (BG) are representative of three independent experiments.
Figure 2
Figure 2
Effects of TGF-β signaling on liver organoid generation. In this study, we used liver sinusoidal endothelial cells (LSECs) at p4 and checked whether the LSECs at p4 had unique characteristics or were differentiated into fibroblasts; these aspects were evaluated by determining CD31 and α-SMA expression, respectively. In addition, to evaluate the effects of TGF-β signaling in LX-2 cells on liver organoid generation, multiple cells in Matrigel-coated plates were treated with A83-01 or TGF-β. Furthermore, we investigated whether LX-2 cells and TGF-β signaling affected liver organoid generation. (A) α-SMA and CD31 expression in LSECs according to the passage (p) number. The intensity of protein expression was quantified through densitometry in ImageJ, and its relative expression was normalized against that of GAPDH. * p < 0.05, ** p < 0.01. (B) Self-assembly of the four cell types (Huh-7, LSECs, macrophages, and LX-2 cells). A83-01, a TGF-β receptor inhibitor, inhibited the self-assembly of the four cell types. (C) Self-assembly of three cell types (Huh-7, macrophages, and LX-2 cells). In the absence of LSECs, a higher ratio of LX-2 cells increased self-assembly but did not enhance the formation of spherical clusters. However, when the mixing ratio of LX-2 cells was 6-fold higher or more and when TGF-β was present, spherical clusters similar to liver organoids formed when the four cell types were induced. Scale bars: 1 mm. Data shown are representative of three independent experiments.
Figure 3
Figure 3
Gene expression profiles in 2D- and 3D-cultured cells. The four cell types were cultured for three days in 96-well plates without or with Matrigel for 2D or 3D cultures, respectively. Gene expression was analyzed using qPCR. (A) Hepatocyte-related gene expression profiles in 2D- and 3D-cultured cells. (B) Inflammation-related gene expression in 2D- and 3D-cultured cells. (C) Extracellular-matrix-related gene expression in 2D- and 3D-cultured cells. (D) Endothelial-cell-related gene expression in 2D- and 3D-cultured cells. Target gene expression was normalized using GAPDH expression. Relative fold changes in mRNA expression were measured using the 2−(ΔΔCt) method. The results are presented as the means ± standard deviation (SD) of three replicates. * p < 0.05, ** p < 0.01, and *** p < 0.001. 2D; two-dimensional-cultured cells, Orga; 3D-cultured liver organoid.
Figure 4
Figure 4
Fibrosis modeling in liver organoids using liver toxicants. Liver organoids on day 3 were treated with thioacetamide (TAA), ethanol (Et-OH), or acetaminophen (APAP) for an additional three days to generate fibrotic liver organoids. (A) α-SMA and COL1A1 expression in TAA-treated liver organoids. The intensity of protein expression was quantified through densitometry in ImageJ, and its relative expression was normalized against that of GAPDH. (B) LX-2-dependent α-SMA expression in fibrotic liver organoids. In liver organoids prepared without LX-2 cells, no increase in α-SMA expression was detected even after TAA treatment. (C) Liver-organoid-dependent α-SMA expression after TAA treatment. α-SMA expression increased in liver organoids treated with ≤5 mM TAA, but gradually decreased at >20 mM TAA, reaching control levels at 80 mM TAA. However, no α-SMA expression was detected in 2D-cultured cells treated with TAA up to 80 mM. Data shown are representative of two independent experiments. (D) Collagen expression in liver organoids. Liver organoid sections obtained on day 6 were stained with a Picro-Sirius Red solution to detect collagen expression with or without TAA treatment, and images were analyzed using light microscopy. The black stars indicate areas rich in collagen. Data shown are representative of three independent experiments. Scale bars: 50 µm. (E) α-SMA and COL1A1 expression in liver organoids treated with TAA, Et-OH, or APAP. Data in (A,B,E) are presented as the means ± SD of three independent experiments. * p < 0.05, ** p < 0.01, and *** p < 0.001.
Figure 5
Figure 5
Gene expression profiles using liver toxicants. Liver organoids on day 3 were treated with the liver toxicants thioacetamide (TAA), ethanol (Et-OH), and acetaminophen (APAP) for an additional two days. Gene expression was analyzed using qPCR. (A) Hepatocyte-related gene expression profiles in TAA-treated liver organoids. (B) Inflammation-related gene expression in TAA-treated liver organoids. (C) Extracellular matrix (ECM)-related gene expression in TAA-treated liver organoids. (D) Endothelial-cell-related gene expression in TAA-treated liver organoids. (E) Expression of CYPs in toxicant-treated liver organoids. GAPDH expression was used to normalize the expression of target genes. The 2−(ΔΔCt) method measured relative fold changes in mRNA expression. The results are presented as the means ± SD from three replicates. * p < 0.05, ** p < 0.01, and *** p < 0.001.
Figure 6
Figure 6
Antifibrotic effects of N-acetyl-L-cysteine (NAC) in thioacetamide (TAA)-treated liver organoids. Liver organoids on day 3 were treated with 1 mM of TAA, and NAC was added on day 4. qPCR, immunoblotting, and Picro-Sirius Red staining were conducted on samples prepared on day 5 or 6. (A) α-SMA and COL1A1 expression in fibrotic liver organoids treated with NAC. The intensity of protein expression was quantified through densitometry in ImageJ, and its relative expression was normalized against that of GAPDH. Data are presented as the means ± SD of three independent experiments. * p < 0.05 and ** p < 0.01. (B) Fibrotic marker expression in fibrotic liver organoids treated with NAC. The expression of α-SMA, COL1A1, and COL3A1 was analyzed using qPCR on day 5. (C) Collagen expression in fibrotic liver organoids treated with NAC on day 6. Collagen in liver organoids was stained with Picro-Sirius Red solution, and images were analyzed using light microscopy. Data shown are representative of three independent experiments. The black stars indicate areas rich in collagen. Scale bars: 50 µm. (D) Inflammation-related gene expression in fibrotic liver organoids treated with NAC. (E) CYP expression in fibrotic liver organoids treated with NAC. qPCR (B,D,E) was conducted on day 5 samples, and target gene expression was normalized using GAPDH expression. Relative fold changes in mRNA expression were measured using the 2−(ΔΔCt) method. The results are presented as the means ± SD of three replicates. * p < 0.05, ** p < 0.01, and *** p < 0.001.
Figure 7
Figure 7
Antifibrotic effects of tumor necrosis factor-stimulated gene 6 protein (TSG-6) in thioacetamide (TAA)-treated liver organoids. Liver organoids on day 3 were treated with 1 mM of TAA, and TSG-6 was added on day 4. qPCR or immunoblotting and Picro-Sirius Red staining were conducted on samples prepared on day 5 or 6, respectively. (A) α-SMA and COL1A1 expression in fibrotic liver organoids treated with TSG-6. Data are presented as the means ± SD of three independent experiments. * p < 0.05 and ** p < 0.01. (B) Fibrotic marker expression in fibrotic liver organoids treated with TSG-6. The expression of α-SMA, COL1A1, and COL3A1 was analyzed using qPCR on day 5. (C) Collagen expression in fibrotic liver organoids treated with TSG-6 on day 6. Collagen in liver organoids was stained with Picro-Sirius Red solution, and images were analyzed using light microscopy. The black stars indicate areas rich in collagen. Data shown are representative of three independent experiments. Scale bars: 50 µm. (D) Inflammation-related gene expression in fibrotic liver organoids treated with TSG-6. (E) CYP expression in fibrotic liver organoids treated with TSG-6. qPCR (B,D,E) was conducted on day 5 samples, and target gene expression was normalized using GAPDH expression. Relative fold changes in mRNA expression were measured using the 2−(ΔΔCt) method. The results are presented as means ± SD of three replicates. * p < 0.05, ** p < 0.01, and *** p < 0.001.
Figure 8
Figure 8
Antifibrotic effects of tumor-necrosis-factor-stimulated gene 6 protein (TSG-6) in TGF-β-treated liver organoids. Liver organoids on day 3 were treated with TGF-β, and TSG-6 was added on day 4. qPCR or immunoblotting and Picro-Sirius Red staining were conducted on samples prepared on day 5 or 6, respectively. (A) Fibrotic marker expression in TGF-β-treated liver organoids. The expression of α-SMA, COL1A1, and COL3A1 was analyzed using qPCR on day 5. (B) α-SMA expression in TGF-β-treated liver organoids. (C) Antifibrotic effects of TSG-6 in TGF-β-treated liver organoids. The expression of α-SMA, COL1A1, and COL3A1 was analyzed using qPCR. qPCR (A,C) was conducted on day 5 samples, and target gene expression was normalized using GAPDH expression. Relative fold changes in mRNA expression were measured using the 2−(ΔΔCt) method. (D) Decreased expression of α-SMA by TSG-6 in TGF-β-treated liver organoids. (E) SMAD3 phosphorylation reduction by TSG-6 in TGF-β-treated liver organoids. Data in (AE) are presented as the means ± SD of three independent experiments. * p < 0.05, ** p < 0.01, and *** p < 0.001. (F) Collagen expression in fibrotic liver organoids treated with TSG-6 on day 6. Collagen in liver organoids was stained with Picro-Sirius Red solution, and images were analyzed using light microscopy. Data shown are representative of three independent experiments. The black stars indicate areas rich in collagen. Scale bars: 50 µm.

References

    1. Fallowfield J.A., Iredale J.P. Targeted treatments for cirrhosis. Expert Opin. Ther. Targets. 2004;8:423–435. doi: 10.1517/14728222.8.5.423. - DOI - PubMed
    1. Zhang Z., Wang F.S. Stem cell therapies for liver failure and cirrhosis. J. Hepatol. 2013;59:183–185. doi: 10.1016/j.jhep.2013.01.018. - DOI - PubMed
    1. Alfaifi M., Eom Y.W., Newsome P.N., Baik S.K. Mesenchymal stromal cell therWapy for liver diseases. J. Hepatol. 2018;68:1272–1285. doi: 10.1016/j.jhep.2018.01.030. - DOI - PubMed
    1. Eom Y.W., Kim G., Baik S.K. Mesenchymal stem cell therapy for cirrhosis: Present and future perspectives. World J. Gastroenterol. 2015;21:10253–10261. doi: 10.3748/wjg.v21.i36.10253. - DOI - PMC - PubMed
    1. Yi T., Song S.U. Immunomodulatory properties of mesenchymal stem cells and their therapeutic applications. Arch. Pharm. Res. 2012;35:213–221. doi: 10.1007/s12272-012-0202-z. - DOI - PubMed

Publication types

LinkOut - more resources