. 2023 Oct 31;12(21):2550.
doi: 10.3390/cells12212550.

LRRK2 Attenuates Antioxidant Response in Familial Parkinson's Disease Derived Neural Stem Cells

Affiliations

LRRK2 Attenuates Antioxidant Response in Familial Parkinson's Disease Derived Neural Stem Cells

Jeffrey Kim et al. Cells. .

Abstract

Parkinson's disease (PD) is the second most prevalent neurodegenerative disease, characterized by the loss of midbrain dopaminergic neurons which leads to impaired motor and cognitive functions. PD is predominantly an idiopathic disease; however, about 5% of cases are linked to hereditary mutations. The most common mutation in both familial and sporadic PD is the G2019S mutation of leucine-rich repeat kinase 2 (LRRK2). Currently, it is not fully understood how this mutation leads to PD pathology. In this study, we isolated self-renewable, multipotent neural stem cells (NSCs) from induced pluripotent stem cells (iPSCs) harboring the G2019S LRRK2 mutation and compared them with their isogenic gene corrected counterparts using single-cell RNA-sequencing. Unbiased single-cell transcriptomic analysis revealed perturbations in many canonical pathways, specifically NRF2-mediated oxidative stress response, and glutathione redox reactions. Through various functional assays, we observed that G2019S iPSCs and NSCs exhibit increased basal levels of reactive oxygen species (ROS). We demonstrated that mutant cells show significant increase in the expression for KEAP1 and decrease in NRF2 associated with a reduced antioxidant response. The decreased viability of mutant NSCs in the H2O2-induced oxidative stress assay was rescued by two potent antioxidant drugs, PrC-210 at concentrations of 500 µM and 1 mM and Edaravone at concentrations 50 µM and 100 µM. Our data suggest that the hyperactive LRRK2 G2019S kinase activity leads to increase in KEAP1, which binds NRF2 and leads to its degradation, reduction in the antioxidant response, increased ROS, mitochondria dysfunction and cell death observed in the PD phenotype.

Keywords: Parkinson’s disease; induced pluripotent stem cells; neural stem cells; single cell transcriptomics; target identification.


Conflict of interest statement

MMD is founder of NeoNeuron LLC.

Figures

Figure 1
Figure 1
Characterization of LRRK2 G2019S (Mut) iPSCs and isogenic gene corrected (GC) iPSCs. (A) Representative confocal images of Mut (Left) and GC (Right) iPSCs showing the expression of the pluripotent stem cell markers: NANOG (Red), Octamer-binding protein 4 (OCT4, Green), Stage-specific embryo antigen 4 (SSEA4, Red), and TRA-1-60 (Green). (B) Western blot analysis of lysates from Mut and GC iPSCs for LRRK2 kinase activity measured through levels of phosphorylation of RAB10 at T73. The cell lysates were also blotted to determine the change in total amount of RAB10 protein levels. β-actin was used as loading control. The molecular weights in kDa are represented on the right side of the panel. (C) Representative confocal images of Mut (Top) and GC (Bottom) showing similarities of iPSC-derived dopaminergic neurons in the two cell lines. ß-tubulin class III (TUJ1, Red) and Tyrosine hydroxylase (TH, Green). Scale bars are: 100 µm in (A), 20 µm in (C).
Figure 2
Figure 2
Single-cell RNA-seq reveals significant differentially expressed genes between the Mut and isogenic GC iPSCs. Single-cell RNA-seq was performed to compare GC NSC (n = 67) and Mut NSC (n = 78). (A) Principal component analysis (PCA) shows distinct clustering of GC (Red Circle) and Mut (Green Triangle) NSCs. (B) Heatmap showing expression levels of all genes after performing hierarchical clustering. (C) Volcano plot reveals 91 upregulated genes and 292 downregulated genes where fold change threshold is set at 2 and p ≤ 0.05.
Figure 3
Figure 3
Pathway analysis of significant differentially expressed genes. Gene ontology (GO) term enrichment analysis using DAVID functional annotation (A,B). Gene set of all significantly downregulated genes (A) and significantly downregulated genes (B). Gene ontology was selected based on p ≤ 0.05. (C) Overlapping canonical pathways identified using Ingenuity Pathway Analysis (IPA) of all significantly downregulated genes.
Figure 4
Figure 4
LRRK2 Mut iPSCs and NSCs exhibit increased levels of basal intracellular ROS. Mitosox Red staining of Mut and GC iPSCs and NSCs (A,B). Representative confocal images of Mut and GC iPSCs (A) and Mut and GC NSCs (B). Corrected total cell fluorescence (CTCF) was measured with ImageJ as described in Method section. Data represent mean ± SEM of experiments performed two or three times on independent culture preparations, each performed in duplicate or triplicate. *** p ≤ 0.001. (C) Electron paramagnetic (EPR) spectroscopy using 1-hydroxy-3-methoxycarbonyl-2,2,5,5-tetramethylpyrrolidine (CMH) probe to measure superoxide content in Mut (Orange) and GC (Blue) NSCs. Recordings were conducted with borosilicate capillary tubes. (D) EPR using MitoTEMPO probe to measure antioxidant potential in Mut (Orange) and GC (Blue) NSCs. Recordings were conducted with a quartz flat cell. Signal intensity was determined by calculating area under the curve of the EPR spectrum (Left). Signal intensity was normalized by protein concentration. Recordings were conducted in triplicate. Data represent mean ± s.e.m. * p ≤ 0.05, ** p ≤ 0.01, *** p ≤ 0.001 and **** p ≤ 0.0001. Scale bars are 10 µm in (A,B).
Figure 5
Figure 5
LRRK2 Mut iPSCs and NSCs exhibit increased mitochondrial lipid peroxidation. (A) Cardiolipin concentration was measured in the isolated cellular fraction and the mitochondria fraction of GC (Blue) and Mut (Orange) iPSCs. (B) Confocal photomicrograph of Mut and GC iPSCs showing the lipid peroxidation of Mut vs. GC NSCs. During oxidation, the modified linoleic acid produces alkyne-modified protein that is multiplexed with Alexa Fluor 488 to produce a green fluorescence indicative of lipid peroxidation. The lipid peroxidation of Mut and GC NSCs was measured using confocal microscopy and the corrected total cell fluorescence (CTCF) measured with ImageJ. (C) Mitochondrial respiration of GC and Mut NSCs was measured using Seahorse. See Results section for description. Data represent mean ± SEM of experiments performed two or three times on independent culture preparations, each performed in duplicate or triplicate. *** p ≤ 0.001, **** p ≤ 0.0001. Scale bar is 20 µm in (B).
Figure 6
Figure 6
LRRK2 Mut NSCs exhibit reduced antioxidant response. (A) Gene expression for KEAP1, NRF2, GCLC, and GSS of Mut (Orange) and GC (Blue) NSCs were measured with qPCR performed in triplicates in two independent experiments. (B) Western blot analysis of lysates from Mut and GC iPSCs and NSCs labeled for KEAP1 and NRF2 protein levels. β-actin used as loading control. The molecular weights in kDa are represented on the left side of the panel. (C) Representative confocal images of Mut and GC NSCs stained for KEAP1 (RED) and NRF2 (Green). Cells were treated with 500 nM MG132 for 2 h prior to staining to prevent the degradation of NRF2. Corrected total cell fluorescence (CTCF) was measured with ImageJ. (D) Glutathione concentration of Mut (Orange) and GC (Blue) NSCs were measured with a fluorometric assay. Data represent mean ± SEM of experiments performed two or three times on independent culture preparations, each performed in duplicate or triplicate. * p ≤ 0.05, ** p ≤ 0.01, and **** p ≤ 0.0001. Scale bar is 10 µm in (C).
Figure 7
Figure 7
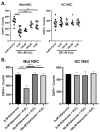
Antioxidant neuroprotective effects of PRC-210 and Edaravone. Cell viability in the H2O2-induced oxidative stress assay was measured through quantification of DAPI+ cells. (A) Mut (Left) and GC (Right) NSCs were treated with 200 µM H2O2 for 2 h combined with increasing concentrations of the antioxidant PrC-210 at 0 µM, 100 µM, 500 µM and 1 mM concentrations. (B) Mut NSCs and GC NSCs were treated with 200 µM H2O2 for 2 h combined with increasing concentrations of the antioxidant Edaravone at concentrations 50 µM and 100 µM. DAPI+ cells were manually counted using ImageJ. Data represent mean ± SEM of experiments performed two or three times on independent culture preparations, each performed in duplicate or triplicate. ** p ≤ 0.01, *** p ≤ 0.001, and **** p ≤ 0.0001.
Figure 8
Figure 8
LRRK2 G2019S reduces antioxidant response. Our data suggest that the hyperactive LRRK2 G2019S kinase activity leads to increase in KEAP1, which binds NRF2 and leads to its degradation, reduction in the antioxidant response, increased ROS, mitochondria dysfunction, and cell death.

References

    1. Braak H., Braak E., Yilmazer D., Schultz C., de Vos R.A., Jansen E.N. Nigral and extranigral pathology in Parkinson’s disease. J. Neural Transm. Suppl. 1995;46:15–31. - PubMed
    1. Jellinger K.A. Pathology of Parkinson’s disease. Changes other than the nigrostriatal pathway. Mol. Chem. Neuropathol. 1991;14:153–197. doi: 10.1007/BF03159935. - DOI - PubMed
    1. Emre M., Aarsland D., Brown R., Burn D.J., Duyckaerts C., Mizuno Y., Broe G.A., Cummings J., Dickson D.W., Gauthier S., et al. Clinical diagnostic criteria for dementia associated with Parkinson’s disease. Mov. Disord. 2007;22:1689–1707. doi: 10.1002/mds.21507. - DOI - PubMed
    1. Gelb D.J., Oliver E., Gilman S. Diagnostic criteria for Parkinson Disease. Arch. Neurol. 1999;56:7. doi: 10.1001/archneur.56.1.33. - DOI - PubMed
    1. Hughes A.J., Daniel S.E., Kilford L., Lees A.J. Accuracy of clinical diagnosis of idiopathic Parkinson’s disease: A clinico-pathological study of 100 cases. J. Neurol. Neurosurg. Psychiatry. 1992;55:181–184. doi: 10.1136/jnnp.55.3.181. - DOI - PMC - PubMed

Publication types

MeSH terms

Substances