. 2023 Nov 10;18(11):e0294249.
doi: 10.1371/journal.pone.0294249. eCollection 2023.

Estrogen inhibits colonic smooth muscle contractions by regulating BKβ1 signaling

Affiliations

Estrogen inhibits colonic smooth muscle contractions by regulating BKβ1 signaling

Jing Wen et al. PLoS One. .

Abstract

The estrogen inhibits colonic smooth muscle contractions, which may lead to constipation. However, the mechanisms of inhibition are poorly understood. Therefore, the present study examined the effect of estrogen on rat colonic smooth muscle contractions and its potential association with the large-conductance Ca2+-activated K+ channels β1 (BKβ1) subunit. Twenty-four female Sprague Dawley rats were randomly assigned to 4 groups. After 2 weeks of intervention, the contraction activity of isolated colonic smooth muscle and the expression of BKβ1 in colonic smooth muscle of rats were detected. Additionally, in order to investigate the effects of estrogen on BKβ1 expression and calcium mobilization, in vitro experiments were conducted using rat and human colonic smooth muscle cells (SMCs). BKβ1 shRNA was used to investigate whether calcium mobilization is affected by BKβ1 in colonic SMCs. To explore the relationship between ERβ and BKβ1, serial deletions, site-directed mutagenesis, a dual-luciferase reporter assay, and chromatin immunoprecipitation assays were employed. In response to E2, colonic smooth muscle strips showed a decrease in tension, while IBTX exposure transiently increased tension. Furthermore, in these muscle tissues, BKβ1 and α-SMA were found to be co-expressed. The E2 group showed significantly higher BKβ1 expression. In cultured colonic SMCs, the expression of BKβ1 was found to increase in the presence of E2 or DPN. E2 treatment reduced Ca2+ concentrations, while BKβ1 shRNA treatment increased Ca2+ concentrations relative to the control. ERβ-initiated BKβ1 expression appears to occur via binding to the BKβ1 promoter. These results indicated that E2 may upregulate BKβ1 expression via ERβ and inhibit colonic smooth muscle contraction through ERβ by directly targeting BKβ1.


Conflict of interest statement

The authors have declared that no competing interests exist

Figures

Fig 1
Fig 1. Iberiotoxin-sensitive BKβ1 is involved in E2-induced colonic SMC relaxation.
A Contractile activity of colonic SMC in each group (n = 6 each). B Detection of the maximal contraction after Ach stimulation. *P < 0.05 when compared with C, BSA-E2 and E2+EI groups. C Representative trace showing that E2 (1 μmol/l) inhibits rat colonic SMC contractions. Preincubation with Iberiotoxin (IBTX, 1 μmol/l), a BKβ1 blocker, partially reversed the contractile E2-induced inhibition (n = 6 each). D Results are presented as a percentage, which is expressed as the ratio of the contraction amplitude of smooth muscles after DMSO or estrogen treatment to the maximum value of ACH-induced contraction. All data are displayed as mean ± SEM. *P < 0.05 and **P < 0.01.
Fig 2
Fig 2. BKβ1 expression and distribution in rat colonic smooth muscle.
A Representative double immunofluorescence image showing BKβ1 expression (green) and α-SMA (red) in four groups (n = 6 each) of colonic smooth muscle (immunofluorescence double labeling, ×200). Scale bar = 10 μm. B Left panel: BKβ1 protein expression as showed by western blotting in four groups; right panel: quantification of BKβ1 protein levels normalized to GAPDH, n = 6. All data are displayed as mean ± SEM. *P < 0.05 when compared with C, BSA-E2 and EI groups.
Fig 3
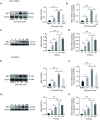
Fig 3. E2 treatment increases BKβ1 expression in colonic SMCs in a concentration- and time-dependent manner.
A E2 was administered to rat CoSMCs for 24 h at 0, 10, 50, or 100 nmol/l. Left panel: representative protein bands; right panel: quantitative analysis for BKβ1; data were normalized to GAPDH (n = 3). B BKβ1 mRNA expressional analysis using qPCR in rat CoSMCs. Data are expressed relative to GAPDH mRNA transcript levels (n = 3). C Rat CoSMCs were treated with 50 nmol/l of E2 for 0, 6, 12, 24 or 48 h. Left panel: representative protein bands; right panel: quantitative analysis for BKβ1 (n = 3). D Total BKβ1 mRNA as detected by qPCR in rat CoSMCs (n = 3). E E2 was administered to HCoSMCs for 24 h at 0, 10, 50, or 100 nmol/l. Left panel: representative protein bands; right panel: quantitative analysis for BKβ1 (n = 3). F BKβ1 mRNA expression in HCoSMCs analyzed using qPCR (n = 3). G HCoSMCs treated with 50 nmol/l of E2 for 0, 6, 12, 24 or 48 h. Left panel: representative protein bands; right panel: quantitative analysis for BKβ1 (n = 3). H Total BKβ1 mRNA expression in HCoSMCs as detected by qPCR (n = 3). Mean ± SEM. *P < 0.05 and **P <0.01. Rat CoSMCs: rat colonic smooth muscle cells; HCoSMCs: human colonic smooth muscle cells.
Fig 4
Fig 4. E2 promoted BKβ1 expression in SMCs in an ERβ-dependent manner.
SMCs were incubated with DMSO (2 μl), E2 (50 nmol/l), PPT (1 μmol/l), DPN (1 μmol/l), ICI 182780 (1 μmol/l) + E2 (50 nmol/l), or BSA-E2 (50 nmol/l) for 24 h. A Western blot analysis of BKβ1in rat CoSMCs. Left panel: representative protein bands; right panel: quantitative analysis for BKβ1 (n = 3). data were normalized to GAPDH. B BKβ1 mRNA expressional analysis using qPCR in rat CoSMCs. Data are expressed relative to GAPDH mRNA transcript levels (n = 3). C Western blot analysis of BKβ1in HCoSMCs. Left panel: representative protein bands; right panel: quantitative analysis for BKβ1 (n = 3). BKβ1 expression was normalized to GAPDH (loading control). D BKβ1 mRNA expression in HCoSMCs analyzed using qPCR. Data are expressed relative to GAPDH mRNA transcript levels (n = 3). All data are displayed as mean ± SEM. **P < 0.01 compared with DMSO, PPT, ICI+E2 and BSA-E2.
Fig 5
Fig 5. Evaluation of the effect of E2 on [Ca2+]i mobilization in SMCs after Ach stimulation.
A Changes in fluorescence intensity due to [Ca2+]i relative to the baseline (F/F0) in rat CoSMCs treated with DMSO, E2 + IBTX, or E2. Left panel: fluorescence intensity of [Ca2+]i; right panel: quantitative analysis of peak F/F0 and representative image of fluorescence at peak F/F0 from three independent experiments (n = 3). B Changes in fluorescence intensity due to [Ca2+]i relative to the baseline (F/F0) in HCoSMCs treated with DMSO, E2 + IBTX, or E2. Left panel: fluorescence intensity of [Ca2+]i; right panel: quantitative analysis of peak F/F0 and representative image of fluorescence at peak F/F0 from three independent experiments (n = 3). F0 was derived from the average intensity of the first 0–20 s. C BKβ1 mRNA levels in rat CoSMCs after transfection with BKβ1 shRNA for 48 h (n = 3). D Changes in fluorescence intensity due to [Ca2+]i relative to the baseline (F/F0) in rat CoSMCs treated with BK β1-subunit knockdown. Left panel: fluorescence intensity of [Ca2+]i; right panel: quantitative analysis of peak F/F0. F0 was derived from the average intensity of the first 0–30 s. E BKβ1 mRNA levels in HCoSMCs after transfection with BKβ1 shRNA for 48 h (n = 3). F Changes in fluorescence intensity due to [Ca2+]i relative to the baseline (F/F0) in HCoSMCs treated with BK β1-subunit knockdown. Left panel: fluorescence intensity of [Ca2+]i; right panel: quantitative analysis of peak F/F0. All data are displayed as mean ± SEM. *P < 0.05 and **P < 0.01.
Fig 6
Fig 6. KCNMB1 is a direct transcriptional target of ESR2.
A Luciferase intensity of the reporter gene driven by the KCNMB1 promoter in HCoSMCs. *P < 0.05 vs. LV-control, n = 3. B Luciferase activities of the reporter gene driven by a serially truncated/mutated KCNMB1 promoter with ESR2 binding sites indicated in HCoSMCs. **P < 0.01 vs. KCNMB1 promoter sequence (−1,783/+98), n = 3. C ChIP assay for the binding of ESR2 to the KCNMB1 promoter in HCoSMCs. In CHIP and dual luciferase experiments, HCoSMCs were treatment with 50 nmol/l E2.Y-axis shows enrichment with anti-ESR2 antibodies vs. the IgG control. *P < 0.05 vs. anti-IgG, n = 3.

Similar articles

Cited by

References

    1. Camilleri M, Ford AC, Mawe GM, et al.. Chronic constipation. Nat Rev Dis Primers. 2017; 3: 17095. doi: 10.1038/nrdp.2017.95 . - DOI - PubMed
    1. Bharucha AE, Lacy BE. Mechanisms, Evaluation, and Management of Chronic Constipation. Gastroenterology. 2020; 158(5): 1232–1249. doi: 10.1053/j.gastro.2019.12.034 . - DOI - PMC - PubMed
    1. Baffy N, Foxx-Orenstein AE, Harris LA, et al.. Intractable Constipation in the Elderly. Curr Treat Options Gastroenterol. 2017; 15(3): 363–381. doi: 10.1007/s11938-017-0142-2 . - DOI - PubMed
    1. Gual O, Bozkurt A, Deniz M, et al.. Effect of sex steroids on colonic distension-induced delay of gastric emptying in rats. J Gastroenterol Hepatol. 2004; 19(9): 975–981. doi: 10.1111/j.1440-1746.2004.03409.x . - DOI - PubMed
    1. Xiong W, Jiang Y, Yu T, et al.. Estrogen-regulated expression of SK3 channel in rat colonic smooth muscle contraction. Life Sci; 2020, 263: 118549. doi: 10.1016/j.lfs.2020.118549 . - DOI - PubMed

Publication types