. 2023 Nov 10;19(11):e1011789.
doi: 10.1371/journal.ppat.1011789. eCollection 2023 Nov.

Antibody-mediated spike activation promotes cell-cell transmission of SARS-CoV-2

Affiliations

Antibody-mediated spike activation promotes cell-cell transmission of SARS-CoV-2

Shi Yu et al. PLoS Pathog. .

Erratum in

Abstract

The COVID pandemic fueled by emerging SARS-CoV-2 new variants of concern remains a major global health concern, and the constantly emerging mutations present challenges to current therapeutics. The spike glycoprotein is not only essential for the initial viral entry, but is also responsible for the transmission of SARS-CoV-2 components via syncytia formation. Spike-mediated cell-cell transmission is strongly resistant to extracellular therapeutic and convalescent antibodies via an unknown mechanism. Here, we describe the antibody-mediated spike activation and syncytia formation on cells displaying the viral spike. We found that soluble antibodies against receptor binding motif (RBM) are capable of inducing the proteolytic processing of spike at both the S1/S2 and S2' cleavage sites, hence triggering ACE2-independent cell-cell fusion. Mechanistically, antibody-induced cell-cell fusion requires the shedding of S1 and exposure of the fusion peptide at the cell surface. By inhibiting S1/S2 proteolysis, we demonstrated that cell-cell fusion mediated by spike can be re-sensitized towards antibody neutralization in vitro. Lastly, we showed that cytopathic effect mediated by authentic SARS-CoV-2 infection remain unaffected by the addition of extracellular neutralization antibodies. Hence, these results unveil a novel mode of antibody evasion and provide insights for antibody selection and drug design strategies targeting the SARS-CoV-2 infected cells.


Conflict of interest statement

The authors have declared that no competing interests exist.

Figures
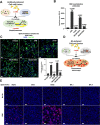
Fig 1
Fig 1
Receptor binding motif (RBM) antibodies drive ACE2-independent cell-cell fusion (A) Schematics of the antibody-induced cell-cell fusion model used to quantify spike-mediated syncytium formation. Cells co-expressing SARS-CoV-2 spike and Cre, were co-cultured with Stop-luc expressing HEK293T cells for 16 hours, before cell lysates were collected for bioluminescence detection; (B) Luciferase activity (RLU) measured from HEK293T cell lysates collected from the neutralization antibody stimulation described in (A) for 16 hours. CB6, FD20, REGN10933 and REGN10987 were diluted in PBS and used at 12.5 nM. Data are representative of five individual repeats. Data are displayed as individual points with mean ± standard error of the mean (SEM); (C) Representative fluorescent image captured at 488 nm from lentivirus-transduced A549 cells expressing SARS-CoV-2 spike, stimulated with 12.5 nM Isotype, CB6, FD20, REGN10933 and REGN10987 for 16 hours. Anti-S2 was stained with Alexa fluor 488, syncytia are indicated with white arrows and syncytia formation per field of view (FOV) from individual repeats were summarized, scale bars are representative of 50 μm. Images were representative of at least four individual repeats; (D) Schematics of the antibody-induced cell-cell fusion model for qualification of spike-induced syncytia formation. Cells co-expressing spike and Cre, were cocultured with Stop-mCherry expressing HEK293T cells for 16 hours, cell nuclei were counterstained with 100 ng/mL Hoescht33342 and fluorescent images were then captured; (E) Representative fluorescent images for mCherry reporter and Hoechst33342 captured at 594 and 405 nm from HEK293T cells expressing Alpha, Beta, Delta, Omicron BA.1 and BA.4 spike VOCs, stimulated without or with 12.5 nM CB6 antibody, scale bars are representative of 50 μm. Images are representative of three individual experiments.
Fig 2
Fig 2. Antibody-induced cell-cell fusion requires spike proteolysis at the S1/S2 junction.
(A) Immunoblots showing shedded S1 subunits and human IgG heavy chain (IgG Hc), full-length spike, S1, S2 and cleaved S2’ collected from supernatant and cell lysate fractions of antibody-treated HEK293T cells expressing WT full-length spike for 16 hours. CB6, FD20, REGN10933 and REGN10987 were diluted in PBS and used at 12.5 nM, blots are representative of at least three independent experiments; (B) Immunoblots showing proteinase K-resistant S2’ cleavage product, obtained from cell lysates described in (A) and were then treated in the absence or presence of 10 μg/mL proteinase K for 30 min at 37°C, blots are representative of two individual repeats; (C) Luciferase activity (RLU) measured from cell-cell fusion assay and immunoblots showing shedded S1 subunits, IgG Hc, full-length spike, S1, S2 and cleaved S2’ collected from supernatant and cell lysate fractions of CB6-stimulated HEK293T cells. CB6 doses used were 0.1, 0.5, 2.5 and 12.5 nM respectively, human IgG isotype was used at 12.5 nM for the negative control. Data and blots are representative of four individual repeats; (D) Immunoblots showing shedded S1 subunits, full-length spike and S1 collected from supernatant and cell lysate fractions of lentivirus-transduced A549 cells expressing WT full-length spike, stimulated without or with 12.5 nM CB6 antibody. Blots are representative of three individual repeats; (E) Luciferase activity (RLU) measured from cell-cell fusion assay and immunoblots showing shedded S1 subunits, IgG Hc, full-length spike, S1, S2 and cleaved S2’ collected from supernatant and cell lysate fractions of CB6-stimulated HEK293T cells expressing Beta spike VOCs carrying N417 or K417 revert mutation, blots and data are representative of four individual repeats; (F) Schematics of the R685A (furin-cleavage site deficient) spike mutant, and representative fluorescent images captured at 594 nm and 405 nm from HEK293T cells expressing WT and R685A spike mutant, stimulated without or with 12.5 nM CB6; scale bars are representative of 50 μm, images were representative of two individual repeats; (G) Luciferase activity (RLU) measured from antibody-induced cell-cell fusion assay, where co-cultured HEK293T cells expressing WT or R685A spike mutant were stimulated without or with 12.5 nM CB6 for 16 hours (Top). Supernatants and cell lysates were used for immunoblots of shedded S1 subunits, IgG Hc, full-length spike, S1, S2 and cleaved S2’ (Bottom). Blots are representative of three independent experiments.
Fig 3
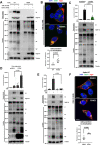
Fig 3. Furin-dependent priming of spike at the plasma membrane promotes antibody-mediated cell-cell fusion.
(A) Immunoblots of shedded S1 subunits, IgG Hc collected from supernatants; or full-length spike, S1, S2 and cleaved S2’ and IgG Hc collected from HEK293T cell lysates expressing WT or R685A spike mutant, stimulated without or with 12.5 nM CB6 antibody for 16 hours, in the absence or presence of 50 nM Bafilomycin A1 (BafA1). Blots are representative of three individual experiments; (B) Representative confocal images of 12.5 nM CB6 antibody-stimulated HEK293T cells expressing WT or R685A spike mutant for 16 hours. Anti-Early endosomes antigen 1 (EEA1) and Anti-human IgG (H+L chains) were stained with Alexa fluor 488 and 555 respectively, co-localizations are indicated with white arrows and R values derived from Pearson’s coefficients summarized, scale bars are representative of 10 μm. Images are representative of four individual experiments; (C) Luciferase activity (RLU) measured from 12.5 nM CB6-stimulated siControl or siFURIN donor HEK293T cells co-expressing Cre and WT spike, mixed with siControl or siFURIN acceptor Stop-Luc-expressing cells for 16 hours (top); and immunoblots showing shedded S1 subunits, hIgG Hc and full-length spike, S1, S2 and S2’ collected from co-cultured cell supernatants and lysates (bottom). Data shown are representative of four independent repeats; (D) Luciferase activity (RLU) measured from 12.5 nM CB6-stimulated over-expressing pcDNA4 (empty vector) or FURIN donor HEK293T cells co-expressing Cre and WT spike, mixed with over-expressing pcDNA4 or FURIN acceptor Stop-Luc-expressing cells for 16 hours (top); and immunoblots showing shedded S1 subunits, hIgG Hc and full-length spike, S1, S2 and S2’ collected from co-cultured cell supernatants and lysates (bottom). Data shown are representative of four independent repeats; (E) Luciferase activity (RLU) measured from HEK293T cells co-expressing WT spike and Cre, mixed with Stop-Luc-expressing cells, in the absence or presence of 25 μM dec-RVKR-cmk (RVKR) for 16 hours (top); immunoblots showing shedded S1 subunits, full-length S, S1, S2 and cleaved S2’ collected from supernatants and lysates (bottom). Data shown are representative of five independent repeats, and the blot is representative of three repeats; (F) Representative confocal images of 12.5 nM CB6 antibody-stimulated HEK293T cells expressing WT spike, treated with DMSO or 25 μM RVKR for 16 hours. Anti-Early endosomes antigen 1 (EEA1) and Anti-human IgG (H+L chains) were stained with Alexa fluor 488 and 555 respectively, scale bars are representative of 10 μm, co-localizations are indicated with white arrows and R values derived from Pearson’s coefficients were summarized. Data are displayed as individual points with mean ± standard error of the mean (SEM). P value was obtained by one-way ANOVA with Sidak’s post hoc test and is indicated on the figure.
Fig 4
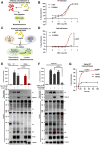
Fig 4. Inhibition of S1 shedding restores the neutralization efficiency of RBM antibodies.
(A) Schematic representation of antibody neutralization of pseudotyped particles (PPs): serial diluted antibodies are pre-incubated with PPs prepared using SARS-CoV-2 spike and a retroviral transfer vector harboring a luciferase reporter for 1 hours at 37°C, before infection of ACE2-expressing cells for 48 hours at 37°C. Bioluminescence activity were quantified at end-point as the PP infection rate; (B) Neutralization curve of CB6 monoclonal antibody on PPs prepared using WT or R685A spike mutants. Percentage of neutralization were normalized against the infection control pre-incubated with PBS, data are representative of six individual repeats; (C) Schematic representation of antibody neutralization of the cell-cell fusion: serial diluted antibodies are pre-incubated with HEK293T cells co-expressing SARS-CoV-2 spike and Cre for 1 hour at 37°C, before co-cultured with HEK293T cells co-expressing control or ACE2 and Stop-Luc for 6 hours at 37°C. Fusion-induced bioluminescence activity were quantified at end-point; (D) Neutralization curve of CB6 monoclonal antibody on WT or R685A spike-induced cell-cell fusion. Percentage of neutralization were normalized against the cell-cell fusion control pre-incubated with PBS, data are representative of six individual repeats; (E) Luciferase activity (RLU) measured from HEK293T cells co-expressing Cre and WT or R685A spike mutants without or with 100 nM CB6 pretreatment for 1 hour, then co-cultured with Stop-Luc-expressing control or ACE2 cells for further 6 hours (top); and immunoblots showing shedded S1 subunits, hIgG Hc, full-length spike, S1, S2, cleaved S2’ and ACE2 collected from co-cultured cell supernatants and lysates (bottom). Blots are representative of four independent experiments; (F) Luciferase activity (RLU) measured from HEK293T cells co-expressing Cre and WT spike without or with 100 nM CB6 pretreatment in the presence of 25 μM RVKR, before mixing with Stop-Luc-expressing cells carrying control or ACE2 for further 6 hours (top); with immunoblots showing shedded S1 subunits, IgG Hc and full-length spike, S1, S2, cleaved S2’ and ACE2 collected from co-cultured cell supernatants and lysates (bottom). Blots are representative of four independent experiments; (G) Percentage neutralization of increasing concentrations of (10, 25, 50 and 100 nM) CB6 for 1 hour, before co-cultured with Stop-Luc-expressing cells carrying ACE2 for further 6 hours. P values were obtained by one-way ANOVA with Sidak’s post hoc test and are indicated on the figure.
Fig 5
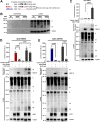
Fig 5. Protease-induced cleavage at S1/S2 bridge site promotes antibody evasion.
(A) Amino acid sequence alignment of the SARS-CoV-2 WT, R685A and ΔRRAR spike mutants at S1/S2 cleavage site. Polybasic and trypsin-cleavable arginine residues are labeled in bold; (B) Immunoblots showing full-length spike and S1, collected from supernatant and lysate fractions of HEK293T cells expressing WT, R685A and ΔRRAR spike mutants treated without or with 5 μg/mL TPCK-trypsin for 6 hours. Blots are representative of two independent experiments; (C) Luciferase activity (RLU) measured from HEK293T cells co-expressing Cre and R685A spike mutants, stimulated with 12.5 nM CB6 without or with 1 μg/mL TPCK-trypsin for 16 hours (top); and immunoblots showing shedded S1 subunits, hIgG Hc and full-length spike, S1, S2 and cleaved S2’ collected from co-cultured cell supernatants and lysates (bottom). Data and blots are representative of four independent experiments; (D) Luciferase activity (RLU) measured from HEK293T cells co-expressing Cre with R685A spike mutant, pretreated with 100 nM CB6 for 1 hour in the absence (Red bars) or presence (Gray bars) of 1 μg/mL trypsin, then co-cultured with Stop-Luc-expressing cells carrying control or ACE2 for further 6 hours (top); and immunoblots showing shedded S1 subunits, human hIgG Hc and full-length spike, S1, S2, S2’ and ACE2 collected from co-cultured cell supernatants and lysates (bottom). Data are representative of nine individual repeats, blots are representative of six independent experiments; (E) Luciferase activity (RLU) measured from HEK293T cells co-expressing Cre with ΔRRAR spike mutant, pretreated with 100 nM CB6 for 1 hour in the absence (Blue bars) or presence (Gray bars) of 1 μg/mL trypsin, then co-cultured with Stop-Luc-expressing cells carrying control or ACE2 for further 6 hours (top); and immunoblots showing shedded S1 subunits, human hIgG Hc and full-length spike, S1, S2, S2’ and ACE2 collected from co-cultured cell supernatants and lysates (bottom). Data are representative of six individual repeats, blots are representative of two independent experiments. P values were obtained by one-way ANOVA with Sidak’s post hoc test and are indicated on the figure.
Fig 6
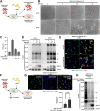
Fig 6. Antibody-mediated spike activation during SARS-CoV-2 infection.
(A) Schematic representation of antibody-treatment on SARS-CoV-2 post-infected cells. Wildtype Vero E6 cells or Vero E6-TMPRSS2 cells were inoculated with 2 MOI live SARS-CoV-2 (isolate Wuhan-Hu-1) virus for 4 hours to ensure efficient viral entry; culture growth media were then replaced without or with antibody to investigate the possible role of antibody on post-infected cells. Supernatants and cell lysates were harvested 48 hours post infection (hpi) for viral titer and spike cleavage; (B) Brightfield images of 2 MOI SARS-CoV-2 infected wildtype Vero E6 cells, treated without or with 12.5 or 25 nM CB6 antibody for 24 and 48 hours. White arrows indicate patched cytopathic effect under the effect of antibody; scale bars are indicative of 50 μm and images are representative of two independent experiments; (C) SARS-CoV-2 viral titer measured on fresh Vero E6 cells by 50% tissue culture infectious dose (TCID50), inoculated with serially diluted supernatants collected from (B). TCID50 was measured with the Reed–Muench method, data were representative of two individual repeats; (D) Immunoblots of SARS-CoV-2 full-length spike, S2, S2’ and N proteins, collected from wildtype Vero E6 cell lysates 24 and 48 hpi as described in (B). Blots are representative of three individual experiments; (E) Immunofluorescent images showing morphology of 2 MOI SARS-CoV-2 infected VeroE6 and VeroE6-TMPRSS2 cells, treated without or with 12.5 nM CB6 antibody 48 hpi. Anti-SARS-CoV-2 N and Anti-human IgG (H+L chains) were stained with Alexa fluor 488 and 555 respectively. Scale bars are indicative of 50 μm; (F) Schematic representation of anti-ACE2 blocking antibody and CB6 treatment on SARS-CoV-2 post-infected cells, wildtype Vero E6 cells were inoculated with 2 MOI live SARS-CoV-2 (isolate Wuhan-Hu-1) virus for 4 hours to before medium was replaced without or with 1 μg/mL anti-ACE2 blocking antibody and 12.5 nM CB6, cells were further incubated for 48 hours; (G) Immunofluorescent images showing morphology of 2 MOI SARS-CoV-2 infected wildtype Vero E6 cells, treated without or with 12.5 nM CB6 antibody in the absence or presence of 1 μg/mL anti-ACE2 blocking antibody for 48 hpi. Anti-SARS-CoV-2 N and Anti-human IgG (H+L chains) were stained with Alexa fluor 488 and 555 respectively. Scale bars are indicative of 50 μm; (H) Immunoblots of SARS-CoV-2 full-length spike, S2, S2’ and N, collected from wildtype Vero E6 lysates described in (G), blots are representative of two individual repeats.
Fig 7
Fig 7. Graphical abstract of antibody-mediated spike activation.
(A) When SARS-CoV-2 spike is cleaved at the S1/S2 cleavage site and expressed on the infected cell membrane, binding of Class I antibodies (Abs) onto the receptor binding motif (RBM) trigger the rapid shedding of S1 subunit at the cell surface. This event allows the functional activation of the S2’ cleavage site by membrane bound proteases, such as TMPRSS2. Exposure of fusion peptide at the plasma membrane triggers receptor-independent cell-cell fusion among adjacent cells. This process drives the functional activation of spike-expressed on the cell membrane and promote cell-cell transmission of the SARS-CoV-2 virus; (B) However, when spike S1/S2 site is not cleaved by an endogenously expressed protease, for instance by host cell furin or TMPRSS2, binding of Class I Abs on the RBM is unable to trigger S1 shedding from the spike-expressing cells. Instead, binding of Class I Ab leads to the internalization of spike trimers, where S2’ cleavage and exposure of fusion peptide could occur inside endolysosomes. As a result, cell-cell transmission of the SARS-CoV-2 virus could be efficiently prevented. Figure was illustrated using images created with BioRender.com.

References

    1. Walls AC, Park YJ, Tortorici MA, Wall A, McGuire AT, Veesler D. Structure, Function, and Antigenicity of the SARS-CoV-2 Spike Glycoprotein. Cell. 2020;181(2):281–92.e6. Epub 2020/03/09. doi: 10.1016/j.cell.2020.02.058 ; PubMed Central PMCID: PMC7102599. - DOI - PMC - PubMed
    1. Li W, Moore MJ, Vasilieva N, Sui J, Wong SK, Berne MA, et al. Angiotensin-converting enzyme 2 is a functional receptor for the SARS coronavirus. Nature. 2003;426(6965):450–4. doi: 10.1038/nature02145 ; PubMed Central PMCID: PMC7095016. - DOI - PMC - PubMed
    1. Zhou P, Yang XL, Wang XG, Hu B, Zhang L, Zhang W, et al. A pneumonia outbreak associated with a new coronavirus of probable bat origin. Nature. 2020;579(7798):270–3. Epub 2020/02/03. doi: 10.1038/s41586-020-2012-7 ; PubMed Central PMCID: PMC7095418. - DOI - PMC - PubMed
    1. Lan J, Ge J, Yu J, Shan S, Zhou H, Fan S, et al. Structure of the SARS-CoV-2 spike receptor-binding domain bound to the ACE2 receptor. Nature. 2020;581(7807):215–20. Epub 2020/03/30. doi: 10.1038/s41586-020-2180-5 . - DOI - PubMed
    1. Shang J, Ye G, Shi K, Wan Y, Luo C, Aihara H, et al. Structural basis of receptor recognition by SARS-CoV-2. Nature. 2020;581(7807):221–4. Epub 2020/03/30. doi: 10.1038/s41586-020-2179-y . - DOI - PMC - PubMed

Supplementary concepts