

Snakebite epidemiology, outcomes and multi-cluster risk modelling in Eswatini
- PMID: 37948462
- PMCID: PMC10664941
- DOI: 10.1371/journal.pntd.0011732
Snakebite epidemiology, outcomes and multi-cluster risk modelling in Eswatini
Abstract
Background: Halving snakebite morbidity and mortality by 2030 requires countries to develop both prevention and treatment strategies. The paucity of data on the global incidence and severity of snakebite envenoming causes challenges in prioritizing and mobilising resources for snakebite prevention and treatment. In line with the World Health Organisation's 2019 Snakebite Strategy, this study sought to investigate Eswatini's snakebite epidemiology and outcomes, and identify the socio-geographical factors associated with snakebite risk.
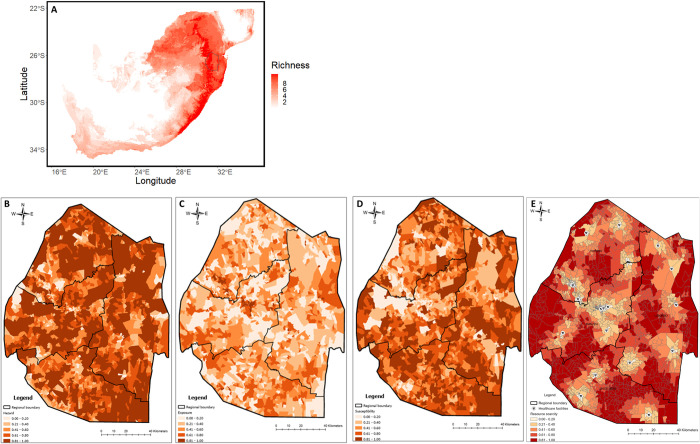
Methodology: Programmatic data from the Ministry of Health, Government of Eswatini 2019-2021, was used to assess the epidemiology and outcomes of snakebite in Eswatini. We developed a snake species richness map from the occurrence data of all venomous snakes of medical importance in Eswatini that was subjected to niche modelling. We formulated four risk indices using snake species richness, various geospatial datasets and reported snakebites. A multivariate cluster modelling approach using these indices was developed to estimate risk of snakebite and the outcomes of snakebite in Eswatini.
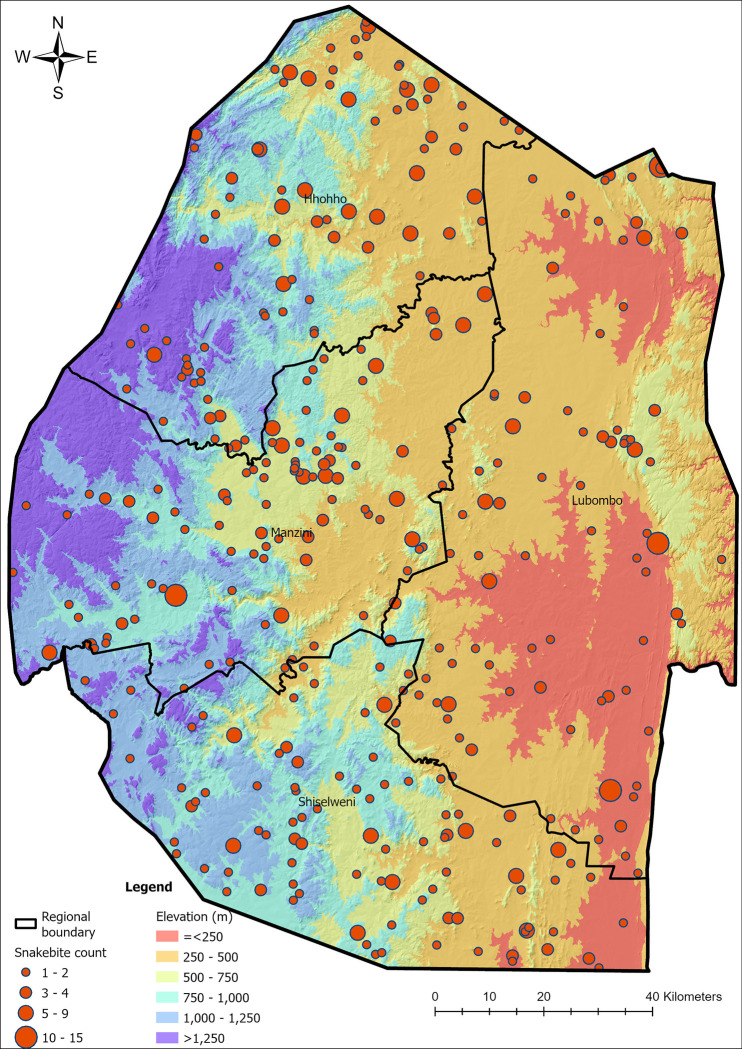
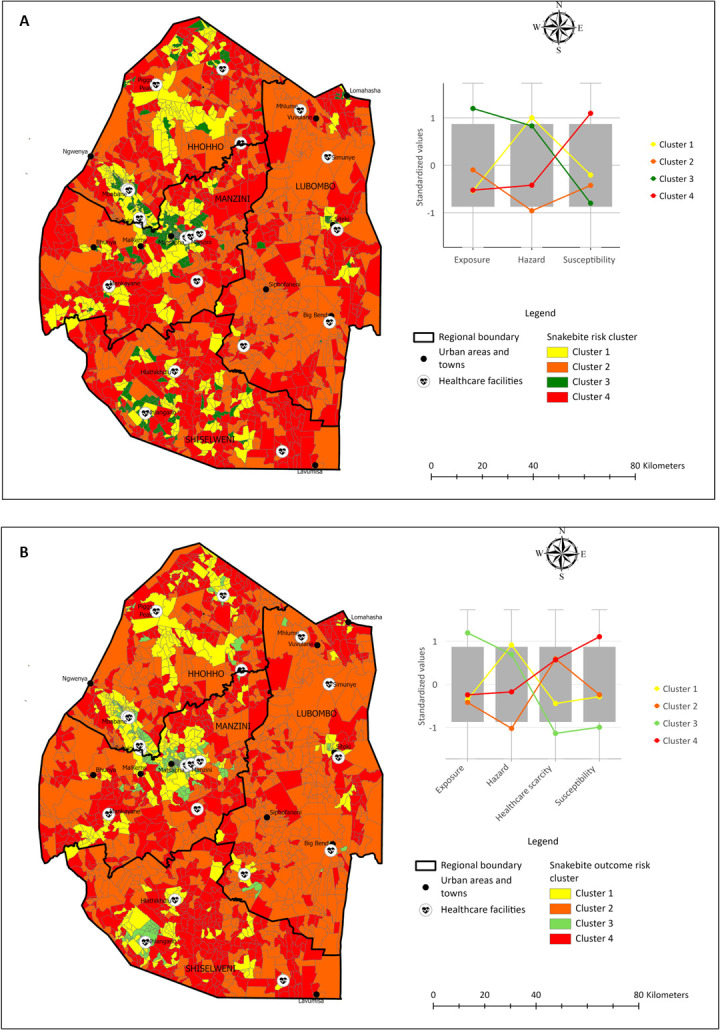
Principal findings: An average of 466 snakebites was recorded annually in Eswatini. Bites were recorded across the entire country and peaked in the evening during summer months. Two cluster risk maps indicated areas of the country with a high probability of snakebite and a high probability of poor snakebite outcomes. The areas with the highest rate of snakebite risk were primarily in the rural and agricultural regions of the country.
Significance: These models can be used to inform better snakebite prevention and treatment measures to enable Eswatini to meet the global goal of reducing snakebite morbidity and mortality by 50% by 2030. The supply chain challenges of antivenom affecting southern Africa and the high rates of snakebite identified in our study highlight the need for improved snakebite prevention and treatment tools that can be employed by health care workers stationed at rural, community clinics.
Copyright: © 2023 Padidar et al. This is an open access article distributed under the terms of the Creative Commons Attribution License, which permits unrestricted use, distribution, and reproduction in any medium, provided the original author and source are credited.
Conflict of interest statement
The authors have declared that no competing interests exist.
Figures


References
-
- World Health Organisation. WHO to unveil strategy to improve snakebite prevention and access to treatment. 2017. [cited 3 Jan 2022]. Available: https://www.who.int/news/item/25-08-2017-who-to-unveil-strategy-to-impro...
-
- World Health Organisation. Snakebite envenoming. 2021. [cited 5 Oct 2021]. Available: https://www.who.int/news-room/fact-sheets/detail/snakebite-envenoming
MeSH terms
Substances
Grants and funding
LinkOut - more resources
Full Text Sources
